

Abstract
Aims
To characterize pharmacokinetic parameters of MK-0916 and its safety and tolerability in lean, healthy male subjects following single and multiple oral doses. To assess (by stable-isotope labelling) the in vivo inhibition of cortisone-to-cortisol conversion following oral MK-0916.
Methods
Data are presented from two randomized, controlled, double-blind, rising-dose phase I studies. In the first study, subjects received single oral doses of 0.4–100 mg MK-0916 (n = 16). In the second study, subjects received 0.2–225 mg MK-0916 followed by daily doses of 0.2–100 mg for 13 days beginning on day 2 or day 15 (n = 80). Plasma and urine drug concentrations were measured for pharmacokinetic analysis. For pharmacodynamic analysis, concentrations of plasma [13C4]cortisol were measured by high-pressure liquid chromatography and tandem mass spectrometry following a single oral dose of 5 mg [13C4]cortisone.
Results
Doses ≥3 mg were rapidly absorbed (time at which maximal concentration was achieved in plasma, 1.1–1.8 h). Exposure (measured as the area under the concentration–time curve from 0 to 168 h) increased approximately in proportion to dose. Values for the maximal plasma concentration and the plasma concentration at 24 h increased in excess of dose proportionality at doses <6 mg and roughly in proportion to dose at doses >6 mg. In subjects dosed with 6 mg MK-0916 once daily for 14 days, the mean trough plasma concentration was 240 nm and in vivo cortisone-to-cortisol conversion was inhibited by 84%. The relationship between plasma MK-0916 and hepatic 11β-hydroxysteroid dehydrogenase type 1 inhibition was well represented by a simple Emax model with an IC50 of 70.4 nm. Exposure to MK-0916 was generally well tolerated.
Conclusions
These findings indicate that 11β-hydroxysteroid dehydrogenase type 1 is effectively inhibited in human subjects by doses of MK-0916 that are well tolerated.
Keywords: 11β-hydroxysteroid dehydrogenase type 1, cortisol, cortisone, metabolic syndrome
WHAT IS ALREADY KNOWN ABOUT THIS SUBJECT
The intracellular enzyme 11β-hydroxysteroid dehydrogenase type 1 converts the inactive glucocorticoid cortisone into the active hormone cortisol in many tissues, including the liver and adipocytes. It is thought that increased conversion of cortisone to cortisol contributes to pathophysiology associated with the metabolic syndrome.
MK-0916 is an inhibitor of 11β-hydroxysteroid dehydrogenase type 1 that has been evaluated clinically as a potential therapy for type 2 diabetes, obesity or hypertension.
WHAT THIS STUDY ADDS
In lean, healthy male subjects, MK-0916 was well tolerated when given in oral doses that were sufficient to provide profound inhibition of hepatic conversion of cortisone to cortisol.
Multiple-dose administration of 6 mg day−1 MK-0916 provided mean plasma concentrations >200 nm at all times, a plasma drug concentration that inhibited systemic 11β-hydroxysteroid dehydrogenase type 1 by 84%.
Introduction
There is considerable interest in the development of inhibitors of the enzyme 11β-hydroxysteroid dehydrogenase type 1 (11β-HSD1) as a potential therapy for the metabolic syndrome, which comprises insulin resistance, dyslipidaemia, visceral obesity and/or hypertension [1–3], conditions that are known to increase the long-term risk for cardiovascular and renal disease [4]. The enzyme 11β-HSD1 is expressed by many tissues, including the liver and adipocytes. It converts the inactive glucocorticoid cortisone into the active hormone cortisol within cells, and through this local action it increases intracellular glucocorticoid activity in the liver and other organs (Figure 1) [2, 5, 6]. It is a working hypothesis that inhibition of 11β-HSD1 in patients with the metabolic syndrome will reduce intracellular cortisol concentrations and lead to improvement in one or more of its components [1, 7, 8]. Some 11β-HSD1 inhibitors have entered into clinical testing; included among these are the compounds AMG221 [9], INCB13739 [10], MK-0916 [11, 12] and MK-0736 [12].
Figure 1.
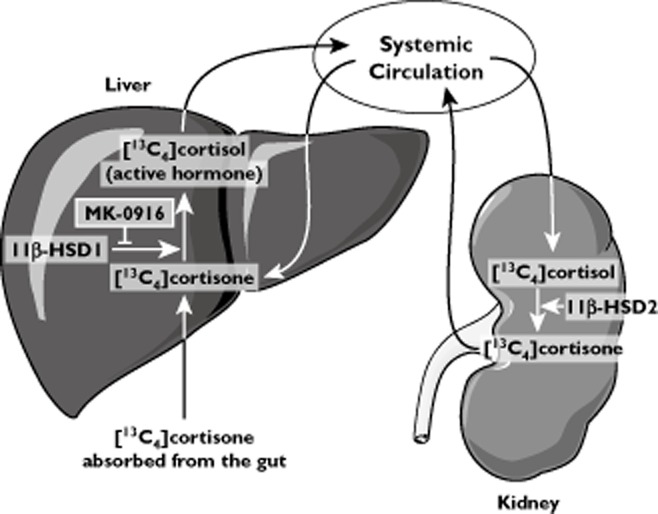
In the liver and other tissues, inactive cortisone is converted into the active hormone cortisol by 11β-hydroxysteroid dehydrogenase type 1 (11β-HSD1), the target of MK-0916 action. Primarily in the kidney, 11β-hydroxysteroid dehydrogenase type 2 (11β-HSD2) converts circulating cortisol back to cortisone. Nearly all orally administered [13C4]cortisone is converted to [13C4]cortisol in its first pass through the liver. Inhibition of hepatic 11β-HSD1 in vivo reduces [13C4]cortisol concentrations in the plasma by blocking this first-pass metabolism
In a mouse model of obesity (the diet-induced obese mouse), animals treated with MK-0916 (compound 5a in reference [13]) for 9 days lost an average of 5% of bodyweight relative to control animals; studies with MK-0916 in streptozotocin-induced diabetic mice on a high-fat diet (a model for type 2 diabetes) produced evidence for antihyperglycaemic activity, and in the murine apoE model of atherosclerosis, plaque size was significantly reduced compared with placebo in animals treated for 8 weeks with MK-0916 (A. Hermanowski-Vosatka unpublished data). Clinical trials with this compound have produced mixed results, however. In a trial conducted in patients with the metabolic syndrome and type 2 diabetes, MK-0916 failed to lower blood glucose significantly but did significantly lower blood pressure [11]. In a subsequent trial conducted in normoglycaemic patients with hypertension, the primary antihypertensive end-point was not met (by the 11β-HSD1 inhibitor MK-0736) [12]. In both studies, treatment with HSD1 inhibitors resulted in modest but statistically significant weight loss.
Understanding the level of target engagement is important for interpreting the results of these studies. The activity of 11β-HSD1 can be monitored in human subjects by administering stable-isotope-labelled cortisone and measuring the production of labelled cortisol. In a pioneering study with this technique, it was found that a small quantity (5 mg) of orally administered [2H5]cortisone was converted almost entirely into [2H5]cortisol in its first pass through the liver [14, 15]. Here, we have applied this methodology to the evaluation of target engagement by 11β-HSD1 inhibitors in humans.
In the present report, we present the key findings from pharmacokinetic (PK) and pharmacodynamic (PD) studies of MK-0916 that laid the groundwork for its recent clinical trials. The main objectives of these studies were as follows: (i) to assess the safety and tolerability of MK-0916 administered orally in single doses (up to 150 mg) and multiple doses (up to 50 mg day–1); (ii) to characterize PK parameters of MK-0916 following administration of single and multiple doses; and (iii) to find a well-tolerated dose of MK-0916 that produced meaningful inhibition of 11β-HSD1 in vivo, as determined by concentrations of [13C4]cortisol measured after administration of [13C4]cortisone orally. Some additional objectives in these studies included assessment of potential effects of MK-0916 on glucocorticoid homeostasis and ratios between cortisol and cortisone metabolites in the urine.
Methods
The findings in this report are from two randomized, double-blind and placebo-controlled phase I clinical trials. The first study was an initial investigation (Merck MK-0916 Protocol 001, referred to hereafter as the ‘single-dose study’) that primarily evaluated safety, tolerability and pharmacokinetic parameters in subjects (n = 16) given single rising doses of MK-0916. The second study was a PK-PD study (Merck MK-0916 Protocol 002, the ‘multiple-dose study’), in which subjects (n = 80) were given rising multiple doses and a primary goal was to evaluate inhibition of hepatic 11β-HSD1. Both of these studies were conducted at SGS Life Science Services (Antwerp, Belgium) in accordance with principles of Good Clinical Practice. The protocols were reviewed and approved by the appropriate institutional review board (Commissie voor Medische Ethiek, ZNA Middelheim, Antwerp, Belgium).
Subjects
All subjects were male, 18–45 years old, nonsmokers, in good health and within 25% of their ideal bodyweight as defined by the 1983 Metropolitan Life Height–Weight Tables for Men [16]. Subjects were judged to be in good health based on medical history, physical examination and routine laboratory tests. These subjects had not taken any medications (prescription or nonprescription) for 2 weeks prior to the study and did not anticipate any need for medication during the study.
Materials
MK-0916 (3-[1-(4-chlorophenyl)-trans-3-fluorocyclobutyl]4,5-dicyclopropy1-r-4H-1,2,4-triazole) and [1,2,4,19-13C4]cortisone (referred to hereafter as ‘[13C4]cortisone’) were synthesized at Merck Research Laboratories. Doses of MK-0916 were administered orally in capsule form. [13C4]Cortisone was administered orally as an aqueous solution (1 mg ml−1). The analyses of [13C4]cortisone and [13C4]cortisol in plasma and dialysates relied on the use of [1,2,4,19-13C4,1,1,19,19,19-2H5]cortisone and [1,2,4,19-13C4,1,1,19,19,19-2H5]cortisol as internal standards. These were provided by Dr Y. Kasuya of the Tokyo University of Pharmacy and Life Science. The chemical purity of [13C4]cortisone was ≥99% as determined by high-pressure liquid chromatography with ultraviolet detection and nuclear magnetic resonance for 13C [17].
Procedures in the single-dose study
In the single-dose study, there were two alternating panels (panels A and B; 16 subjects in total) and four study periods in which doses were given to fasted subjects. In each panel of eight subjects, six subjects in each treatment period received oral MK-0916 with at least 250 ml water and two received matching placebo. Treatment allocation was randomized independently in each study period, but constrained such that each subject received placebo in one of the four periods. Doses given to any individual subject were separated in time by at least 7 days. Subjects in panel A received doses of 0.4, 3, 12 and 50 mg MK-0916 or placebo, and subjects in panel B received doses of 1.2, 6, 25 and 100 mg or placebo.
For subjects in panel A, there was a study period 5, in which an oral dose of 3 mg MK-0916 was given following consumption of a high-fat breakfast composed of fried eggs, bacon, bread, butter, hash brown potato and whole milk. This meal contained approximately 845 calories, with approximately 500 of these in fat, 220 in carbohydrates and 125 in protein. The meal was consumed within a 20 min interval beginning approximately 25 min prior to dosing. For 1 h prior to dosing until 1 h after, water intake was restricted to 250 ml taken with the MK-0916 dose. The treatment allocation in period 5 was aligned with period 2 so that comparisons between fed and fasted responses were made in the same six subjects.
Plasma MK-0916 was measured in all study periods predose (time 0) and at postdose times from 0.5 to 48 h. At the higher doses, additional measurements were made up to 240 h postdose. Urine was collected at time 0 (predose) and over the intervals 0–4, 4–8, 8–12 and 12–24 h postdose for measurement of concentrations of cortisol, cortisone, the cortisol metabolites tetrahydrocortisol (THF) and allo-tetrahydrocortisol (allo-THF), and the cortisone metabolite tetrahydrocortisone (THE). The ratio ([THF] + [allo-THF])/[THE] was analysed as an exploratory pharmacodynamic end-point.
Procedures in the multiple-dose study
In the multiple-dose study, there were 10 panels (Table 1). In five of these panels, subjects received MK-0916 or placebo daily on days 1–14. In four others, subjects received a single dose of MK-0916 or placebo on day 1 and daily doses on days 15–28. In one panel, subjects received a single dose only of MK-0916 or placebo. All doses were administered in the morning following an overnight fast (≥8 h).
Table 1.
The dosing schedule in the multiple-dose study
| MK-0916 dose (mg kg−1) | |||
|---|---|---|---|
| Panel | Day 1 | Days 2–14 | Days 15–28 |
| A | 1.58 | 1.58 | – |
| B | 3.16 | – | 3.16 |
| C | 6.00 | – | 6.00 |
| D | 12.0 | – | 12.0 |
| E | 0.20 | 0.20 | – |
| F | 0.58 | 0.58 | – |
| G | 25.0 | 25.0 | – |
| H | 150 | – | – |
| I | 50.0 | 50.0 | – |
| J | 225 | – | 100 |
The indicated values are expressed as milligrams per dose of MK-0916. In each panel, six subjects were randomly allocated to receive MK-0916 throughout the study and two were administered placebo.
Most subjects in the multiple-dose study (all except those in panels H and J) were included in the primary pharmacodynamic assessment (evaluation of 11β-HSD1 inhibition in the liver) and thus received oral doses of the metabolic tracer [13C4]cortisone acetate. Subjects fasted for at least 4 h before and 2 h after these doses (5 mg followed immediately by 240 ml of water). All doses of [13C4]cortisone acetate were given approximately 9 h after doses of MK-0916 and at approximately the same (±30 min) time of day within any given subject. Plasma samples were collected at times 0 (predose), 15, 30, 45, 60, 90, 120, 180 and 240 min postdose for determination of plasma concentrations of [13C4]cortisone and [13C4]cortisol.
These pharmacodynamic evaluations were performed on day −1 (within 72 h prior to the first dose of MK-0916) and three subsequent days, namely days 1, 14 and 20 for subjects in panels A, E, F, G and I, and days 1, 28 and 34 for subjects in panels B, C, D and J (because these subjects received MK-0916 daily on days 15–28). This yielded assessments at baseline, on the first and 14th days during multiple dosing, and 6 days after the last dose. The primary end-point was the ratio between the area under the curve (AUC) from 0–4 h (AUC0–4h) for plasma [13C4]cortisol on the 14th day of continuous MK-0916 dosing (day 14 in panels A, E, F, G and I, and day 28 in panels B, C and D) and the corresponding AUC0–4h at baseline (on day −1).
On the first and last days of dosing, plasma and urine were collected at intervals similar to those described for the single-dose study for pharmacokinetic analysis. Following last days of dosing, plasma MK-0916 was also measured 30, 48, 72, 120, 154, 168, 240 and 336 h postdose.
Safety assessment
Safety and tolerability were assessed by physical examination, review, evaluation and follow-up of clinical and laboratory adverse events/experiences (AEs), laboratory values, vital signs and 12-lead electrocardiography. Given that cortisol can act as a negative feedback inhibitor on the hypothalamic–pituitary–adrenal axis, blood concentrations of the adrenal androgens androstenedione, dehydroepiandrosterone (DHEA) and dehydroepiandrosterone sulfate (DHEA-S) were measured in all patients in the single-dose and multiple-dose studies.
Bioanalytical methods
For evaluation of plasma MK-0916 levels, blood was collected into sodium heparin-containing tubes at predefined time points after the administration of MK-0916. Blood samples were placed on ice and centrifuged immediately at 2400 g for 10 min at 4°C. The plasma fraction was transferred to polypropylene tubes and stored at −20°C until shipped on dry ice for assay. The samples were analysed by 96-well solid-phase extraction using Waters Oasis HLB μElution 96-well plates, followed by high-pressure liquid chromatography/tandem mass spectrometry detection using [2H4,15N2]MK-0916 as an internal standard. The column was a Luna 5 μm C18 (2), 50 mm × 2 mm (Phenomenex, Inc., Torrance, CA, USA). The mobile phases were 0.1% formic acid and methanol (30:70). The mass transition was m/z 332.3 to 286.3. This assay was linear to 500 nm and had a lower limit of quantification of 0.1 nm. For the quality-control samples analysed during the study period, the interassay precision, expressed as percentage coefficient of variation, ranged from 4.05 to 7.64%. The interassay accuracy ranged from −8.0 to −4.0% difference from theoretical. The recovery of MK-0916 was 80.7%.
Plasma and dialysate samples for the pharmacodynamic assessment were stored at −70°C and were analysed for [13C4]cortisone and [13C4]cortisol content as previously described [17–19]. Androstenedione, DHEA and DHEA-S concentrations were analysed by Bioanalytical Research Corporation (Gent, Belgium).
Pharmacokinetic methods
MK-0916 pharmacokinetic parameters were assessed using noncompartmental and compartmental modeling. The parameters included AUC0–168h, maximum plasma concentration (Cmax), time of Cmax (Tmax) and plasma concentration at 24 h postdose (C24h) for the single-dose study and AUC0–24h, Cmax, Tmax and C24h for the first and last days of dosing in the multiple-dose study. Noncompartmental analysis was performed using WinNonLin® (version 5.0.1; Pharsight, Mountain View, CA, USA). In periods 2–5 of the single-dose study, nonzero predose concentrations were obtained, reflecting carryover from the prior period dosing. These predose concentrations were used as 168 h concentration values in the pharmacokinetic analysis from the preceding period, and for subjects randomized to placebo treatment all concentration data from that period were used in the preceding period's pharmacokinetic analysis to provide greater understanding of the washout kinetics. No corrections for carryover were made in the pharmacokinetic parameter estimates from the fasted treatments, because the predose concentrations in all cases were <2% of subsequent Cmax and therefore considered negligible. For the 3 mg food effect arm, predose values approached 10% of Cmax, and a correction based on subtraction of the extrapolated profile tail of the preceding dose using the apparent terminal half-life in the preceding period was applied to the data prior to conducting the noncompartmental analysis. In the multiple-dose study, accumulation ratios (ARs) were calculated by dividing AUC0–24h for plasma MK-0916 measured on the last day of multiple dosing (day 14 or 28) by AUC0–24h measured on day 1.
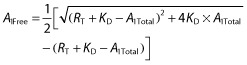
A compartmental pharmacokinetic model was developed to provide better characterization of the apparent nonlinearities and dose- and time-dependent pharmacokinetic behaviour observed. The single- and multiple-dose data were well represented by a two-compartment model, with linear elimination from the central compartment and a saturable binding component of distribution in the central compartment (Figure 4A provides a schematic diagram of the model used). Elimination and intercompartment distribution processes in the model were scaled by the amount of MK-0916 not bound to saturable binding sites (‘free’), which was calculated from the total amount in the central compartment by use of equilibrium binding relationships. The equations describing this model are as follows:
Figure 4.

The pharmacokinetic data were fitted to the two-compartment saturable-distribution model. (A) A diagram of the model and its parameters, which include bioavailability (F), oral absorption rate (kA), the total number of binding sites (RT), the dissociation constant for MK-0916 binding to these sites (KD), the central distribution volume (VolC), the elimination rate (k0) and the microconstant rates for intercompartmental distribution (k12 and k21). The point-estimates for these parameters in Table 5 were derived by fitting the data from the single-dose study. (B) Simulations (curves) based on this best-fit model of the single-dose data superimposed upon values for AUC0–24h on the first and 14th days of dosing, and accumulation ratios (14th day AUC0–24h/first day AUC0–24h) observed in the multiple-dose study. (C,D) Simulations (predicted curves) based on the best-fit model to the single dose superimposed upon values for mean plasma MK-0916 observed in the multiple-dose study. (E) Variation in the mean fit elimination rate (k0) by dose in the multiple-dose study.  , 12 mg; □, 6.00 mg;
  , 3.16 mg; ▿, 1.58 mg;
  , 0.58 mg; ○, 0.20 mg
| (1) |
| (2) |
| (3) |
 |
(4) |
where kA is the absorption rate, A0 is the amount in the gut, A1Total is the total amount (bound and unbound) in the central compartment, A1Free is the amount of unbound drug in the central compartment, k12 and k21 are the intercompartmental transport rates, A2 is the amount in the peripheral compartment, RT is the total amount of binding sites and KD is the dissociation constant characterizing binding affinity. Other parameters are defined by the schematic diagram in Figure 4A. Plasma concentration is derived from A1Free/VolC (the central volume of distribution). Although this model was derived from first principles of equilibrium binding relationships, it shares some common features with previously published saturable distribution models [20, 21]. Note that the bioavailability was set to 100% during parameter estimation due to lack of intravenous data and parameters are therefore apparent values. The model was fitted separately for each individual subject in the single-dose study, and mean estimates were derived for the model parameters and their intersubject variability (SD). These estimates from the single-dose study were then used to perform simulations that predicted pharmacokinetic behaviour during multiple dosing, and the results of these simulations were plotted together with data from the multiple-dose study to assess the adequacy of the saturable-distribution model. This modelling was performed using the software package ACSL™ (ACSLtox version 11.8; Aegis Software, Huntsville, AL, USA). The model parameters were fitted to weighted (1/y2) MK-0916 plasma data by maximization of the log-likelihood function using a generalized reduced gradient search algorithm. Note that due to a high degree of correlation between k12, VolC and KD, the value of k12 was fixed to 0.72 (from the initial naïve pool parameter estimates) for the individual subject fits to allow for more precision and consistency in the estimates for the other parameters.
Pharmacodynamic analysis
Orally administered cortisone undergoes essentially complete first-pass conversion in the liver to cortisol (mediated by hepatic 11β-HSD1; Figure 1) and metabolites that are subsequently cleared [14]. Systemically available cortisol is then subject to reversible metabolism through back-conversion to cortisone (by 11β-hydroxysteroid dehydrogenase type 2) and subsequent reconversion to cortisol by 11β-HSD1 (in the liver and elsewhere). In this study, exposure to [13C4]cortisol following oral administration of [13C4]cortisone (the AUC0–4h for plasma [13C4]cortisol) was assessed to provide an index of the extent to which first-pass conversion of orally administered [13C4]cortisone to [13C4]cortisol was prevented due to inhibition of 11β-HSD1 by MK-0916. The AUC0–4h for plasma [13C4]cortisol was assessed using noncompartmental analysis routines in WinNonLin® (version 5.0.1).
This method of estimating 11β-HSD1 inhibition is more sensitive than assessments based on concentrations of endogenous markers, such as plasma cortisol or urinary cortisol metabolites. Acute or chronic inhibition of 11β-HSD1 is expected to result in only small changes in plasma cortisol due to the compensatory effect of activation of the hypothalamic–pituitary–adrenal axis. Consistent with this, it has been shown that mice with targeted disruption of the 11β-HSD1 gene have only modest elevations of plasma corticosterone (which is, in the mouse, analogous to cortisone in the human) compared with wild-type mice [22].
The present approach assessed hepatic 11β-HSD1 activity primarily. It should be noted, however, that oral dosing with MK-0916 is expected to inhibit nonhepatic 11β-HSD1 as well; the inhibitory activity of MK-0916 is not selective for hepatic 11β-HSD1.
In a PK-PD analysis, individual levels of 11β-HSD1 inhibition were measured by calculating ratios of [13C4]cortisol AUC0–4h observed after dosing with MK-0916 to baseline AUC0–4h values. These were then paired with the MK-0916 concentrations at 9 h postdose, the time at which oral doses of [13C4]cortisone were administered. Individual PK-PD data from all doses and all study days (first and 14th days of multiple dosing and sixth day postdose) were pooled to create the PK-PD analysis data set. These data were fitted to a simple Emax model, E = 1 − C/(C + IC50), where E is the ratio of observed [13C4]cortisol AUC0–4h to baseline [13C4]cortisol AUC0–4h, C is the plasma concentration of MK-0916 and IC50 is the plasma concentration of MK-0916 at which there is half-maximal inhibition.
Metabolites of cortisol (THF and allo-THF) and cortisone (THE) were monitored in the urine with the expectation that the ratio ([THF] + [allo-THF])/[THE] would be reduced when 11β-HSD1 activity in the body was inhibited.
Statistical analyses
The primary means of evaluating the safety and tolerability of MK-0916 was clinical assessment of AEs. Summary statistics were generated for the change from baseline in clinically appropriate safety laboratory parameters (including plasma DHEA and DHEA-S), vital signs and ECG parameters, and for the pharmacokinetic parameters AUC0–24h, AUC0–168h, Cmax, Tmax and C24h. All AUC calculations used the linear trapezoidal method for ascending concentrations and the log trapezoidal method for descending concentrations. In the multiple-dose study, ARs were estimated for AUC0–24h, Cmax and C24h from individual subject values on day 14 or 28 (depending on the panel) compared with day 1. Individual ARs were determined, and group geometric mean ratios (GMRs) calculated. The primary pharmacodynamic end-point in the multiple-dose study was fractional reduction from baseline in plasma [13C4]cortisol AUC0–4h. This was calculated on an individual basis, and GMRs were determined for each dose level. In the exploratory evaluation of potential effects of MK-0916 treatment on ([THF] + [allo-THF])/[THE] ratios, the data were log-transformed and analysed using the mixed-effect model mentioned previously to generate GMRs and 90% confidence intervals (CIs). In this analysis, data from placebo-treated subjects were combined across all study periods. Normality assumptions of the ANOVA model were tested using the Shapiro–Wilk test.
Results
Baseline demographic and morphometric characteristics of subjects were similar in the two studies (Table 2). A total of 96 subjects were enrolled, and there were two discontinuations. One discontinuation was due to a laboratory AE (see details in the ‘Safety and tolerability’ section) and the other was due to withdrawal of consent (n = 1).
Table 2.
Subject baseline characteristics
| Characteristic | Single–dose study | Multiple-dose study |
|---|---|---|
| n | 16 | 80 |
| Age [years; mean (range)] | 33.8 (21–44) | 36.0 (18–50) |
| Gender, male/female (n) | 16/0 | 80/0 |
| Height [cm; mean (range)] | 183.0 (172.0–194.0) | 177.6 (160.0–191.5) |
| Weight [kg; mean (range)] | 77.7 (64.2–94.1) | 78.8 (58.52–97.7) |
| Body mass index [kg m−2; mean (range)] | 23.2 (18.0–28.1) | 25.0 (19.5–30.3) |
| Racial/ethnic composition (n) | ||
| White | 14 | 80 |
| Black | 1 | 0 |
| Hispanic | 1 | 0 |
Pharmacokinetics
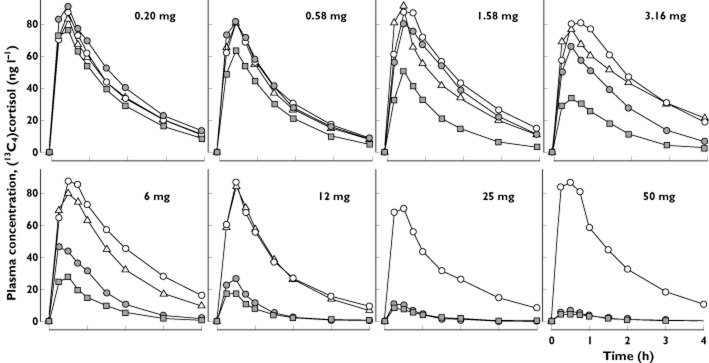
In fasted subjects, all doses ≥3 mg were rapidly absorbed (Figure 2A), having median values for Tmax in the range 1.1–1.8 h (Table 3). At the two lowest doses (0.4 and 1.2 mg), absorption appeared to be slower, and median Tmax values were considerably longer. Exposure (measured as AUC0–168h) increased approximately in proportion to dose over the entire range studied. Values for Cmax and C24h appeared to increase in excess of dose proportionality at doses <6 mg and roughly in proportion to dose at doses >6 mg. Declines in plasma MK-0916 followed complex dose-dependent kinetics (Figure 2B; also, see below).
Figure 2.

Plasma concentration–time profiles following single doses of 0.4–100 mg MK-0916 (data from the single-dose study). (A) Mean plasma MK-0916 in fasted (continuous lines) and fed subjects (dotted line) from 0 to 24 h postdose. (B) Plotted on a logarithmic scale, values are shown for mean plasma MK-0916 observed over 7 days, with curves superimposed indicating the best fit obtained with the two-compartment model described in Figure 4. All points are group means (n = 5 or 6).  , 100 mg;
  , 50 mg;
  , 25 mg;
  , 12 mg;
  , 6 mg;
  , 3 mg;
  , 3 mg (fed);
  , 1.2 mg;
  , 0.4 mg
Table 3.
Mean (SD) pharmacokinetic parameters for plasma MK-0916 in healthy male subjects given single oral doses (the single-dose study; all n = 6)
| Dose (mg) | AUC0–168h (μm h) | Cmax (nm) | Tmax (h)* | C24h (nm) |
|---|---|---|---|---|
| 0.4 | 0.28 (0.04) | 2.5 (0.6) | 22 (15) | 2.4 (0.5) |
| 1.2 | 0.96 (0.27) | 9.4 (2.6) | 15 (18) | 8.2 (2.3) |
| 3 | 3.8 (0.4) | 73 (20) | 1.3 (0.3) | 37 (9) |
| 6 | 9.2 (3.1) | 276 (65) | 1.3 (0.3) | 97 (32) |
| 12 | 16.8 (3.3) | 744 (108) | 1.1 (0.4) | 205 (48) |
| 25 | 38.5 (14.4) | 1499 (419) | 1.3 (0.3) | 549 (222) |
| 50 | 60.7 (4.2)† | 2436 (650) | 1.3 (0.4) | 795 (90) |
| 100 | 133.0 (60.6) | 4730 (845) | 1.8 (1.1) | 1924 (986) |
Arithmetic mean.
Interpolated using data collected at 144 and 672 h. Abbreviations are as follows: AUC0–168h, area under the concentration-time curve from 0 to 168 h; C24h, plasma concentration at 24 h postdose; Cmax, maximum plasma concentration; Tmax, time of Cmax.
Consumption of a high-fat meal delayed absorption of 3 mg MK-0916 (median Tmax = 1.5 h in the fasted state vs. 6 h in the fed state) and decreased mean maximal plasma concentrations by 20% (fed/fasted GMR for Cmax = 0.80, range = 0.57–0.97). Overall exposure to MK-0916 was unchanged (fed/fasted GMR for AUC0–144h = 1.00, range = 0.67, 1.51). Trough concentrations were also unchanged (fed/fasted GMR for C24h = 1.08, range = 0.75–1.56).
Throughout the entire range of doses tested in the multiple-dose study, increases in daily dose resulted in increases in peak plasma concentration and trough concentration (Figure 3). The time course of the approach to steady state was highly dose-dependent, however. The following three general patterns were observed: (i) at the two lowest doses tested (0.58 and 0.20 mg day−1), trough concentrations of plasma MK-0916 increased continuously throughout the 14 days of dosing (steady state was never reached); (ii) at the intermediate doses of 1.58, 3.16 and 6 mg day−1, steady state was reached 4–7 days after dosing began; and (iii) at the three highest doses tested (12, 25 and 50 mg day−1), trough concentrations reached a maximum on the fourth day of dosing and declined thereafter. Accumulation ratios for MK-0916 were also strongly dose dependent (Table 4); the accumulation ratio for plasma MK-0916 AUC0–24h decreased from 12.0 in subjects receiving 0.20 mg day−1 to 1.3 in subjects dosed with 50 mg day−1. On the 14th day of dosing, AUC0–24h values increased roughly in proportion with dose over the dose range 0.58–6 mg, but increased less than dose proportionally at higher doses. From the plasma MK-0916 data obtained over days 0–14 in the subjects in panels B, C and D (who did not receive a second dose until day 15), single doses of 3.16, 6 and 12 mg were associated with harmonic mean terminal half-lives of 116, 124 and 97 h, respectively. The mean (SD) day 1 AUC0–∞ values for these panels were 5.40 (1.23), 12.34 (3.74) and 21.64 (6.80) μm h, respectively, and the geometric mean ratios of the day 1 AUC0–∞ relative to the steady-state AUC0–24h were 0.86, 0.69 and 0.60, respectively.
Figure 3.

Plasma MK-0916 in subjects administered once-daily doses as indicated for 14 days (data from the multiple-dose study). (A) Concentration–time profiles for mean plasma MK-0916 on the first and 14th days of dosing. (B) Mean plasma trough concentration (C24h) over time. All n = 6.  , 50 mg; ⋄, 25 mg;
  , 12 mg; □, 6.00 mg;
  , 3.16 mg; ▿, 1.58 mg;
  , 0.58 mg; ○, 0.20 mg
Table 4.
Mean (SD) plasma pharmacokinetic parameters for MK-0916 in healthy male subjects given once-daily doses for 14 days (the multiple-dose study; all n = 6)
| Dose (mg day−1) | AUC0–24h (μm h) | Cmax (μm) | C24h (μm) | ||||||
|---|---|---|---|---|---|---|---|---|---|
| Day 1 | Day 14 or 28* | AR† | Day 1 | Day 14 or 28* | AR† | Day 1 | Day 14 or 28* | AR† | |
| 0.20 | 0.02 (0.003) | 0.27 (0.06) | 12.0 | 0.001 (0.0002) | 0.01 (0.003) | 10.5 | 0.001 (0.0001) | 0.01 (0.002) | 9.6 |
| 0.58 | 0.08 (0.02) | 1.01 (0.40) | 12.6 | 0.005 (0.002) | 0.05 (0.02) | 11.3 | 0.004 (0.001) | 0.04 (0.02) | 9.6 |
| 1.58 | 0.32 (0.08) | 3.11 (0.40) | 9.8 | 0.02 (0.004) | 0.20 (0.03) | 11.9 | 0.01 (0.004) | 0.10 (0.02) | 7.8 |
| 3.16 | 1.06 (0.24) | 4.79 (1.76) | 4.4 | 0.09 (0.03) | 0.35 (0.09) | 3.7 | 0.04 (0.01) | 0.14 (0.07) | 3.7 |
| 6 | 3.41 (0.92) | 8.46 (2.29) | 2.5 | 0.39 (0.18) | 0.74 (0.22) | 2.0 | 0.10 (0.03) | 0.24 (0.06) | 2.4 |
| 12 | 6.76 (0.65) | 12.9 (3.6) | 1.9 | 0.75 (0.11) | 1.18 (0.27) | 1.6 | 0.17 (0.04) | 0.32 (0.12) | 1.8 |
| 25 | 17.4 (1.5) | 29.3 (7.6) | 1.7 | 1.72 (0.16) | 2.39 (0.47) | 1.4 | 0.54 (0.06) | 0.82 (0.21) | 1.5 |
| 50 | 35.1 (5.7) | 46.1 (15.5) | 1.3 | 3.06 (1.10) | 3.65 (0.84) | 1.2 | 1.06 (0.26) | 1.27 (0.68) | 1.1 |
Day 14 in panels A, E, F, G and I, and day 28 in panels B, C, D and J.
Geometric mean accumulation ratio, (day 14 or 28)/day 1.
Fit of the pharmacokinetic data to a two-compartment saturable-distribution model
A saturable-distribution pharmacokinetic model was developed to test whether the presence of high-affinity, low-capacity binding sites could account for the nonlinear pharmacokinetic behaviour observed. The single-dose plasma MK-0916 data were well represented by a two-compartment model, with linear elimination from the central compartment and a saturable component of distribution in the central compartment (Figure 4A). The model and parameter estimates from the single-dose data (Table 5) were then used to simulate results expected with multiple dosing, and these simulations were compared with data from the multiple-dose study as a test of the model's robustness (Figure 4C,D). The parameter estimates from the single- and multiple-dose data sets were similar. The single-dose model-based simulations reasonably represented the multiple-dose plasma MK-0941 data for doses up to 6 mg, including successful prediction that steady-state values for AUC0–24h would increase dose proportionally, even though AUC0–24h on the first day of dosing did not (Figure 4B). The multiple-dose data for doses >6 mg could be represented reasonably well by the model, with the elimination rate value being increased over that obtained at lower doses (Figure 4E).
Table 5.
Mean (SD) parameter estimates from fitting of the two-compartment, linear elimination model with saturable distribution (Figure 4A) to plasma concentration data from the MK-0916 single-dose study (all doses) and multiple-dose study (1.6, 3.2 and 6 mg)
| Parameter | Single-dose estimates | Multiple-dose estimates | ||
|---|---|---|---|---|
| Mean | SD | Mean | SD | |
| k0 (h−1) | 0.086 | 0.044 | 0.077 | 0.025 |
| VolC (l) | 26.0 | 5.0 | 24.9 | 6.5 |
| k12 (h−1) | 0.72* | – | 0.72* | – |
| K2 | 0.541 | 0.267 | 0.591 | 0.506 |
| kA (h−1) | 1.533 | 1.490 | 2.659 | 3.519 |
| RT (μmol) | 7.09 | 2.21 | 7.796 | 2.256 |
| KD (μmol) | 0.333 | 0.188 | 0.487 | 0.205 |
The parameters are defined in the legend to Figure 4. Bioavailability (F) is set to 1.0. K2 = k21/k12.
k12 is set to 0.72 for individual fits.
Pharmacodynamic findings in the single- and multiple-dose studies
At baseline, prior to administration of MK-0916, [13C4]cortisol appeared rapidly in the plasma following oral dosing with [13C4]cortisone acetate (Figure 5) and plasma concentrations of [13C4]cortisol far exceeded those of [13C4]cortisone (data not shown). These observations were entirely consistent with those previously reported by Kasuya et al. [14]. Treatment of subjects with MK-0916 lowered concentrations of plasma [13C4]cortisol in a dose-dependent manner without any apparent effect on the relative time course over which plasma [13C4]cortisol appeared following oral [13C4]cortisone acetate (Figure 5).
Figure 5.
Mean [13C4]cortisol plasma concentration–time profiles (0–4 h) in healthy male subjects administered single oral doses of 5 mg [13C4]cortisone acetate before the first dose of MK-0916 (baseline), ∼8 h after the first dose, on the 14th day of dosing, and 6 days after the last dose of MK-0916 or placebo once daily for 14 days. The daily doses are indicated in the upper right of each panel.  , baseline (within 72 h prior to the first dose);
  , ∼8 h after the first dose;
  , 14th day of dosing;
  , 6 days after last dose
At the highest dose tested (50 mg), the first administration of MK-0916 reduced the AUC0–4h for [13C4]cortisol to 3.5% of baseline, and daily dosing with 50 mg MK-0916 for 14 days reduced this end-point to 2.9% of baseline (Table 6). This end-point was reduced to <20% of baseline by all doses ≥6 mg, when given once daily for 14 days. Concentrations of plasma [13C4]cortisol following oral [13C4]cortisone returned to near-baseline levels by the sixth day postdose (day 20 or 36, depending on the panel) at all doses for which testing was done at this time point (0.2–12 mg day−1).
Table 6.
Geometric mean AUC0–4h for [13C4]cortisol in male subjects administered oral [13C4]cortisone acetate before, during and 6 days after 14 days of once-daily MK-0916 or placebo
| Dose of MK-0916 (mg day−1) | n | Day −1* | Day 1 | 14th day of dosing† | Postdose day 6 | |||
|---|---|---|---|---|---|---|---|---|
| AUC0–4h (ng h ml−1) | AUC0–4h (ng h ml−1) | Ratio‡ | AUC0–4h (ng h ml−1) | Ratio‡ | AUC0–4h (ng h ml−1) | Ratio‡ | ||
| Placebo | 16§ | 165.4 | 189.7 | 1.15 | 188.5 | 1.14 | 179.3 | 1.06 |
| 0.20 | 6 | 166.8 | 187.7 | 1.12 | 139.9 | 0.84 | 157.6 | 0.94 |
| 0.58 | 6 | 146.7 | 146.1 | 1.00 | 102.7 | 0.70 | 136.9 | 0.93 |
| 1.58 | 6 | 198.0 | 170.8 | 0.86 | 73.0 | 0.37 | 159.9 | 0.81 |
| 3.16 | 6 | 222.8 | 122.4 | 0.55 | 53.9 | 0.24 | 213.2 | 0.93 |
| 6 | 6 | 211.1 | 63.2 | 0.30 | 33.3 | 0.16 | 159.5 | 0.76 |
| 12 | 6 | 150.8 | 24.8 | 0.16 | 20.0 | 0.13 | 138.3 | 0.92 |
| 25 | 6¶ | 119.8 | 8.6 | 0.07 | 8.7 | 0.07 | – | – |
| 50 | 6 | 166.6 | 5.9 | 0.04 | 4.9 | 0.03 | – | – |
Within 72 h prior to the first dose of MK-0916 on day 1.
Day 14 in panels A, E, F, G and I, and day 28 in panels B, C, D and J.
AUC on day of interest/AUC on day −1.
n = 12 for postdose day 6.
n = 5 for postdose day 6.
In both the single-dose and multiple-dose studies, significant reductions in ([THF] + [allo-THF])/[THE] (the ratio of urinary cortisol metabolites to cortisone metabolites) were observed in subjects dosed with MK-0916. In the multiple-dose study, after 14 days of continuous once-daily dosing this ratio was reduced by 31–42% in subjects who received doses of 1.58 mg day−1 and higher (Table 7).
Table 7.
Dose-dependent reduction of the ratio between cortisol metabolite concentrations ([THF] + [allo-THF]) and cortisone metabolite concentrations [THE] in the urine in subjects administered MK-0916 daily for 14 days
| Dose (mg day−1) | Placebo-adjusted percentage change from baseline* in ([THF] + [allo − THF])/[THE] | |
|---|---|---|
| GMR | SEM | |
| 0.20 | −12.2 | 6.40 |
| 0.58 | −24.8 | 5.49 |
| 1.58 | −36.6 | 4.63 |
| 3.16 | −37.0 | 4.60 |
| 6 | −41.6 | 4.26 |
| 12 | −33.6 | 4.84 |
| 25 | −31.3 | 5.01 |
Baseline concentrations were determined within 72 h prior to the first dose of MK-0916. On-treatment concentrations were determined 12–24 h after administering the last of the 14 doses; all n = 6. Abbreviations are as follows: allo-THF, allo-tetrahydrocortisol; GMR, geometric mean ratio; THE, tetrahydrocortisone; THF, tetrahydrocortisol.
Pharmacokinetic–pharmacodynamic analysis
The relationship between inhibition of hepatic 11β-HSD1 (as assessed by lowering of AUC0–4h for plasma [13C4]cortisol) and plasma MK-0916 concentration at the time of [13C4]cortisone acetate administration was closely approximated by a simple Emax model (Figure 6). Based on this model, it appeared that complete inhibition of conversion of [13C4]cortisone to [13C4]cortisol was approached at the highest doses of MK-0916 tested. The best-fit estimate (±SD) for the plasma concentration of MK-0916 that correlated with 50% reduction in the AUC0–4h for plasma [13C4]cortisol was 70.4 ± 2.4 nm.
Figure 6.
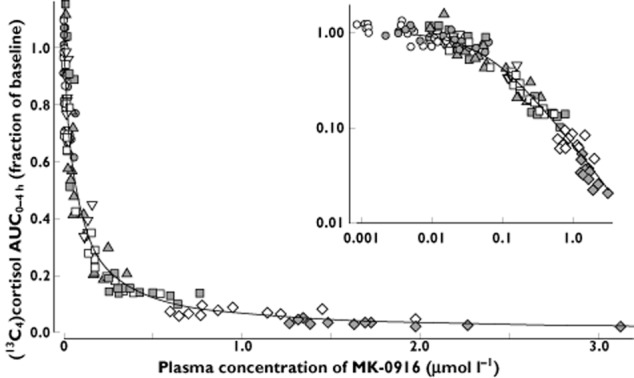
Analysis of the pharmacokinetic–pharmacodynamic relationship observed for plasma concentration of MK-0916 and inhibition of 11β-HSD1, as indicated by AUC0–∞ values for [13C4]cortisol following oral administration of [13C4]cortisone acetate. The data are from subjects dosed with 0.20–50 mg MK-0916 once daily for 14 days. Inhibition of 11β-HSD1 was assessed on the first and 14th days of dosing, and 6 days after the last dose. The superimposed curve indicates the best fit to a simple Emax model. Inset: the same data plotted on a log–log scale. ○, 0.20 mg;  , 0.58 mg; ▿, 1.58 mg;
  , 3.16 mg; □, 6 mg;
  , 12 mg; ⋄, 25 mg;
  , 50 mg;
  , simple Emax
Safety and tolerability
Oral administration of MK-0916 appeared to be well tolerated in both studies. There were no serious AEs. One subject discontinued the study because of a laboratory AE of increased alanine and aspartate aminotransferase concentrations. This was reported on day 25 of the multiple-dose study in a subject who had received 225 mg of MK-0916 on day 1 and 100 mg day−1 on days 15–25. This elevation in liver enzymes was transient; normal values were restored within 7 days of discontinuation.
Clinical AEs regarded by investigators as possibly being drug related were reported in five subjects. These AEs included drowsiness and fatigue reported in a subject administered placebo, and disorientation and hypogeusia (both in one subject), nightmare and abdominal pain (lasting for 1.5 h) in a subject administered MK-0916. All were reported as mild to moderate in intensity.
No significant or meaningful effects on adrenal androgens were observed in the single-dose study (data not shown). In the multiple-dose study, doses of 3–25 mg day−1 MK-0916 were generally associated with 40–80% increases from baseline in placebo-adjusted mean serum DHEA, although there was considerable variability (Figure 7). Similar levels of increase were observed after 7 and 14 days of consecutive daily dosing. Changes in serum concentrations of DHEA-S and androstenedione were smaller and did not appear to be dose dependent.
Figure 7.
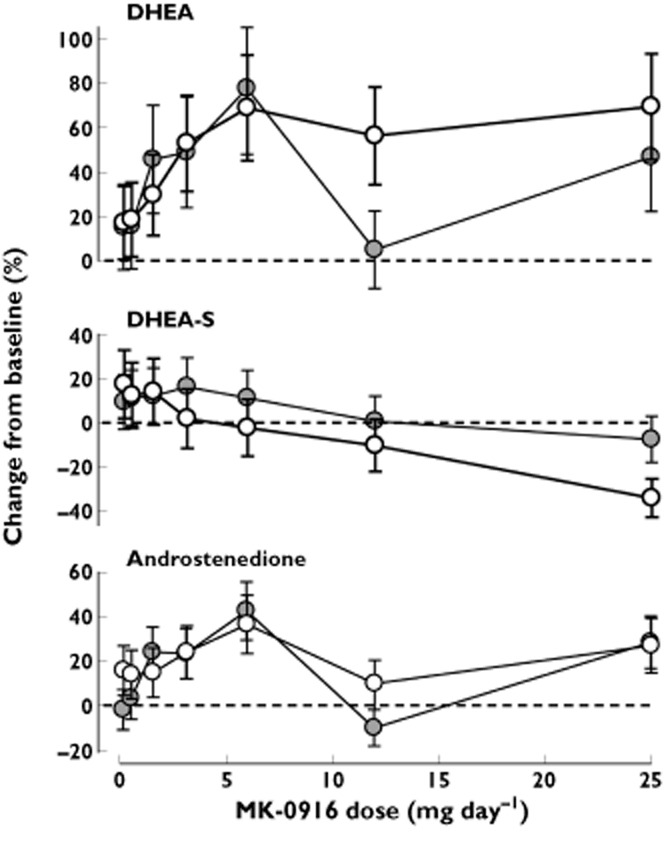
Placebo-adjusted change from baseline in serum concentrations of the adrenal androgens dehydroepiandrosterone (DHEA), dehydroepiandrosterone sulfate (DHEA-S) and androstenedione in subjects administered MK-0916 once daily for 14 days. The ‘eighth day’ data are means ± SEM from study day 8 in panels A, E, F, G and I, and study day 22 in panels B, C, D and J; the ‘15th’ day data are from study days 15 and 29, respectively. All n = 6. ○, eighth day;  , 15th day
Discussion
The data from these two phase I trials show that single oral doses of MK-0916 up to 225 mg and daily oral doses of up 100 mg day−1 for 14 days are generally well tolerated in healthy subjects. Based on the pharmacodynamic findings in these studies, as well as on data from drug interaction studies that demonstrated modest CYP3A4 inducer activity with a 6 mg dose (L. Wenning and E. Lai unpublished observations), 6 mg day−1 was chosen as the dose to be carried forward into phase II clinical trials. The relationship between plasma MK-0916 concentration and hepatic 11β-HSD1 inhibition was adequately represented by a simple Emax model with an IC50 = 70.4 nm. Here, it was observed that multiple-dose administration of 6 mg day−1 MK-0916 to lean male subjects provided mean plasma concentrations >200 nm at all times, corresponding to 84% inhibition of hepatic 11β-HSD1.
Plasma concentrations of MK-0916 declined relatively slowly, and the disposition kinetics were dose dependent and time dependent. During daily dosing, increases in dose were accompanied by reduced accumulation ratios. The complex, nonlinear pharmacokinetics following single doses and multiple daily doses up to 6 mg day−1 were well described by a two-compartment pharmacokinetic model with linear elimination, but saturable distribution. This model predicts that when low doses are given, and during the final phase of MK-0916 elimination following higher doses, the drug will be distributed primarily to high-affinity saturable binding sites, resulting in a large effective volume of distribution and a long apparent half-life. In the initial response to higher doses, however, these saturable binding sites will be saturated, resulting in a much smaller effective volume of distribution and shorter half-life. Likwise, for multiple dosing, low doses will require multiple administrations to saturate the binding sites, creating a slow approach to the steady state and extensive accumulation, while high doses will saturate the binding sites with the first few doses, thus reaching the steady state sooner and with a lesser degree of accumulation than lower doses.
In the multiple-dose study, there may have been induction of clearance at doses >6 mg. Such induction would account for the observed deviation of pharmacokinetic data from the model at these doses, including the decline in trough concentrations over time and values for steady-state AUC that were lower in the multiple-dose study than would be expected based on the findings in the single-dose study.
Demonstration of target engagement is an important methodological link in the rational development of new forms of pharmacotherapy. In prior studies, activity of 11β-HSD1 has been characterized in liver microsomes from dogs, monkeys and humans by microdialysis coupled with stable-isotope methodology [19]. It has also been studied in vivo in the serum and ex vivo in specific organs of interest using stable-isotope methodology in mice [23], by in vivo microdialysis in superficial adipose tissue in the monkey [17], and by ex vivo assay in a clinical trial of the 11β-HSD1 inhibitor AMG 221 [9]. The present study demonstrates implementation of a valuable new method for evaluation of 11β-HSD1 inhibition in vivo in human subjects participating in clinical trials. Hepatic 11β-HSD1 is a key target in the development of new therapies to improve components of the metabolic syndrome (such as insulin resistance and dyslipidaemia). Substantial reduction of the concentration of labelled cortisol in the plasma following oral administration of labelled cortisone provides strong evidence that this target has been engaged.
Release of cortisol by the adrenal cortex is under the control of the hypothalamic–pituitary–adrenal axis, and this axis is in turn subject to negative feedback control by cortisol. Hence, there is concern that inhibition of 11β-HSD1 may produce local or global reductions in cortisol activity that trigger increased release of adrenocorticotrophin, leading in turn to hypertrophy of the adrenal cortex and elevation of circulating concentrations of adrenal androgens [24]. Increases in adrenal androgens have been reported in other clinical studies of 11β-HSD1 inhibitors [10–12], and the present data are also suggestive of increased concentrations (especially of DHEA). These increases may not be clinically meaningful, however. In a prior placebo-controlled clinical study in which male and female patients with hypertension were treated for 12 weeks with MK-0916 or the 11β-HSD1 inhibitor MK-0736, such treatment had no significant effect on female testosterone concentrations or measures of masculinization [12].
Recent clinical trials with 11β-HSD1 inhibitors have produced mixed results. The 11β-HSD1 inhibitor INCB13739 has been tested in patients with type 2 diabetes, as an add-on to therapy with metformin. Compared with placebo plus metformin, treatment with INCB13739 plus metformin for 12 weeks produced significant reductions in plasma glycated haemoglobin, fasting plasma glucose, homeostasis model assessment of insulin resistance, and improvements in other end-points [10]. There was no assessment of the level of 11β-HSD1 inhibition realized in the previous study. In a study of MK-0916 in patients with type 2 diabetes and other components of the metabolic syndrome, treatment with 6 mg day−1 for 12 weeks failed to produce a significant lowering of fasting plasma glucose (the primary end-point) at study end [11]. Patients who received this treatment did, however, show modest reductions in glycated haemoglobin, bodyweight and blood pressure. The blood pressure result was followed up in a study of MK-0916 and another 11β-HSD1 inhibitor, MK-0736, in normoglycaemic patients with hypertension [12]. In that study also, treatment failed to have a significant effect on the primary end-point (placebo-adjusted reduction from baseline in sitting diastolic blood pressure by treatment with 7 mg day−1 MK-0736 for 12 weeks). There were, nonetheless, modest improvements in other blood pressure end-points, plasma low-density lipoprotein cholesterol and bodyweight.
The findings reported herein clearly demonstrate that daily oral dosing with 6 mg MK-0916 produces substantial inhibition of liver 11β-HSD1 and 11β-HSD1 in subcutaneous adipose tissue. Such treatment is also generally well tolerated. It remains to be seen whether such inhibition, either by MK-0916 or by other agents, will turn out to be clinically useful.
Acknowledgments
The authors thank the many subjects who participated in these studies and Sheila Erespe of Merck Sharp & Dohme for her editorial assistance.
Competing Interests
This research was sponsored by Merck Sharp & Dohme Corp., a subsidiary of Merck & Co., Inc., Whitehouse Station, NJ, USA. Tami Crumley, Wei Zheng, Kerri Yan, Amy Yang, Caroline Cilissen, Drs Wright, Stone, Wenning, Sun, Langdon, Gottesdiener, Wagner and Lai are present or former employees of Merck Sharp & Dohme Corp., or MSD Europe. Dr Ramael is an employee of SGS Life Science Services, a contract research organization that has received payment from Merck & Co., Inc. for performing clinical studies.
References
- 1.Wamil M, Seckl JR. Inhibition of 11β-hydroxysteroid dehydrogenase type 1 as a promising therapeutic target. Drug Discov Today. 2007;12:504–520. doi: 10.1016/j.drudis.2007.06.001. [DOI] [PubMed] [Google Scholar]
- 2.Cooper MS, Stewart PM. 11β-hydroxysteroid dehydrogenase type 1 and its role in the hypothalamus-pituitary-adrenal axis, metabolic syndrome, and inflammation. J Clin Endocrinol Metab. 2009;94:4645–4654. doi: 10.1210/jc.2009-1412. [DOI] [PubMed] [Google Scholar]
- 3.Morton NM. Obesity and corticosteroids: 11beta-hydroxysteroid type 1 as a cause and therapeutic target in metabolic disease. Mol Cell Endocrinol. 2010;316:154–164. doi: 10.1016/j.mce.2009.09.024. [DOI] [PubMed] [Google Scholar]
- 4.Expert Panel on Detection, Evaluation, and Treatment of High Blood Cholesterol in Adults. Executive summary of the third report of the national cholesterol education program (NCEP) expert panel on detection, evaluation, and treatment of high blood cholesterol in adults (Adult Treatment Panel III) JAMA. 2001;285:2486–2497. doi: 10.1001/jama.285.19.2486. [DOI] [PubMed] [Google Scholar]
- 5.Seckl JR, Walker BR. Minireview: 11β-hydroxysteroid dehydrogenase type 1— a tissue-specific amplifier of glucocorticoid action. Endocrinology. 2001;142:1371–1376. doi: 10.1210/endo.142.4.8114. [DOI] [PubMed] [Google Scholar]
- 6.Tomlinson JW, Walker EA, Bujalska IJ, Draper N, Lavery GG, Cooper MS, Hewison M, Stewart PM. 11β-hydroxysteroid dehydrogenase type 1: a tissue-specific regulator of glucocorticoid response. Endocr Rev. 2004;25:831–866. doi: 10.1210/er.2003-0031. [DOI] [PubMed] [Google Scholar]
- 7.Chrousos GP. Is 11 β -hydroxysteroid dehydrogenase type 1 a good therapeutic target for blockade of glucocorticoid actions? Proc Natl Acad Sci U S A. 2004;101:6329–6330. doi: 10.1073/pnas.0401671101. [DOI] [PMC free article] [PubMed] [Google Scholar]
- 8.Thieringer R, Hermanowski-Vosatka A. Inhibition of 11β-HSD1 as a novel treatment for the metabolic syndrome: do glucocorticoids play a role? Expert Rev Cardiovasc Ther. 2005;3:911–924. doi: 10.1586/14779072.3.5.911. [DOI] [PubMed] [Google Scholar]
- 9.Gibbs JP, Emery MG, McCaffery I, Smith B, Gibbs MA, Akrami A, Rossi J, Paweletz K, Gastonguay MR, Bautista E, Wang M, Perfetti R, Daniels O. Population pharmacokinetic/pharmacodynamic model of subcutaneous adipose 11β-hydroxysteroid dehydrogenase type 1 (11β-HSD1) activity after oral administration of AMG 221, a selective 11{beta}-HSD1 inhibitor. J Clin Pharmacol. 2011;51:830–841. doi: 10.1177/0091270010374470. [DOI] [PubMed] [Google Scholar]
- 10.Rosenstock J, Banarer S, Fonseca VA, Inzucchi SE, Sun W, Yao W, Hollis G, Flores R, Levy R, Williams WV, Seckl JR, Huber R INCB13739-202 Principal Investigators. The 11-β-hydroxysteroid dehydrogenase type 1 inhibitor INCB13739 improves hyperglycemia in patients with type 2 diabetes inadequately controlled by metformin monotherapy. Diabetes Care. 2010;33:1516–1522. doi: 10.2337/dc09-2315. [DOI] [PMC free article] [PubMed] [Google Scholar]
- 11.Feig PU, Shah S, Hermanowski-Vosatka A, Plotkin D, Springer MS, Donahue S, Thach C, Klein EJ, Lai E, Kaufman KD. Effects of an 11β-hydroxysteroid dehydrogenase type 1 (HSD1) inhibitor, MK-0916, in patients with type 2 diabetes mellitus and metabolic syndrome. Diabetes Obes Metab. 2011;13:498–504. doi: 10.1111/j.1463-1326.2011.01375.x. [DOI] [PubMed] [Google Scholar]
- 12.Shah S, Hermanowski-Vosatka A, Gibson K, Ruck RA, Jia G, Zhang J, Hwang PM, Ryan NW, Langdon RB, Feig PU. Efficacy and safety of the selective 11β-HSD-1 inhibitors MK-0736 and MK-0916 in overweight and obese patients with hypertension. J Am Soc Hyperten. 2011;5:166–176. doi: 10.1016/j.jash.2011.01.009. [DOI] [PubMed] [Google Scholar]
- 13.Zhu Y, Olson SH, Graham D, Patel G, Hermanowski-Vosatka A, Mundt S, Shah K, Springer M, Thieringer R, Wright S, Xiao J, Zokian H, Dragovic J, Balkovec JM. Phenylcyclobutyl triazoles as selective inhibitors of 11β-hydroxysteroid dehydrogenase type I. Bioorg Med Chem Lett. 2008;18:3412–3416. doi: 10.1016/j.bmcl.2008.04.014. [DOI] [PubMed] [Google Scholar]
- 14.Kasuya Y, Ishimaru H, Shibasaki H, Furuta T. Stable isotope methodology for kinetic studies of interconversion of cortisol and cortisone in a human subject. Steroids. 1998;63:122–129. doi: 10.1016/s0039-128x(97)00102-5. [DOI] [PubMed] [Google Scholar]
- 15.Kasuya Y, Yokokawa A, Takayama S, Shibasaki H, Furuta T. Evaluation of 11β-HSD activities in vivo following oral administration of cortisol-13C4,2H1 to a human subject. Steroids. 2003;68:167–176. doi: 10.1016/s0039-128x(02)00169-1. [DOI] [PubMed] [Google Scholar]
- 16.Metropolitan Life Insurance Company. Metropolitan height and weight tables. Stat Bull. 1983;64:2–9. [PubMed] [Google Scholar]
- 17.Sun L, Stenken JA, Brunner JE, Michel KB, Adelsberger JK, Yang AY, Zhao JJ, Musson DG. An in vivo microdialysis coupled with liquid chromatography/tandem mass spectrometry study of cortisol metabolism in monkey adipose tissue. Anal Biochem. 2008;381:214–223. doi: 10.1016/j.ab.2008.06.036. [DOI] [PubMed] [Google Scholar]
- 18.Yang AY, Sun L, Musson DG, Zhao JJ. Determination of M+4 stable isotope labeled cortisone and cortisol in human plasma by microElution solid-phase extraction and liquid chromatography/tandem mass spectrometry. Rapid Commun Mass Spectrom. 2006;20:233–240. doi: 10.1002/rcm.2303. [DOI] [PubMed] [Google Scholar]
- 19.Sun L, Stenken JA, Yang AY, Zhao JJ, Musson DG. An in vitro microdialysis methodology to study 11β-hydroxysteroid dehydrogenase type 1 enzyme activity in liver microsomes. Anal Biochem. 2007;370:26–37. doi: 10.1016/j.ab.2007.06.038. [DOI] [PubMed] [Google Scholar]
- 20.Brazzell RK, Mayer PR, Dobbs R, McNamara PJ, Teng RL, Slattery JT. Dose-dependent pharmacokinetics of the aldose reductase inhibitor imirestat in man. Pharm Res. 1991;8:112–118. doi: 10.1023/a:1015850911382. [DOI] [PubMed] [Google Scholar]
- 21.Mager DE, Jusko WJ. General pharmacokinetic model for drugs exhibiting target-mediated drug disposition. J Pharmacokinet Pharmacodyn. 2001;28:507–532. doi: 10.1023/a:1014414520282. [DOI] [PubMed] [Google Scholar]
- 22.Harris HJ, Kotelevtsev Y, Mullins JJ, Seckl JR, Holmes MC. Intracellular regeneration of glucocorticoids by 11beta-hydroxysteroid dehydrogenase (11beta-HSD)-1 plays a key role in regulation of the hypothalamic-pituitary-adrenal axis: analysis of 11beta-HSD-1-deficient mice. Endocrinology. 2001;142:114–120. doi: 10.1210/endo.142.1.7887. [DOI] [PubMed] [Google Scholar]
- 23.Hermanowski-Vosatka A, Balkovec JM, Cheng K, Chen HY, Hernandez M, Koo GC, Le Grand CB, Li Z, Metzger JM, MUndt SS, Noonan H, Nunes CN, Olson SH, Pikounis B, Ren N, Robertson N, Schaeffer JM, Shah K, Springer MS, Strack AM, Stowski M, Wu K, Wu T, Xiao J, Zhang BB, Wright SD, Thieringer R. 11β-HSD1 inhibition ameliorates metabolic syndrome and prevents progression of atherosclerosis in mice. J Exp Med. 2005;202:517–527. doi: 10.1084/jem.20050119. [DOI] [PMC free article] [PubMed] [Google Scholar]
- 24.Harno E, White A. Will treating diabetes with 11β-HSD1 inhibitors affect the HPA axis? Trends Endocrinol Metab. 2010;21:619–627. doi: 10.1016/j.tem.2010.06.004. [DOI] [PubMed] [Google Scholar]