

Abstract
Background
Pedestrian-vehicle crashes are a significant problem in public health. Understanding contributing factors within a specific community helps recognize and target key intervention points.
Methods
Trauma registry analysis included all of the patients treated at a Level I trauma center following pedestrian-motor vehicle collisions from January 1, 2000 to December 31, 2010. Variables examined included patient demographics, timing of collision, abbreviated injury scale score, injury severity score (ISS), hospital and intensive care unit (ICU) length of stay (LOS), and emergency department and hospital disposition.
Results
A total of 945 pedestrians were reviewed within the study period. Average age was 46.4 ± 19.4 years. One hundred seventy-seven (18.7%) patients were elderly and of the elderly group, 69 (39%) were 80 years of age or greater. The median ISS score was 12, average hospital LOS was 10.8 days and average ICU length of stay was 6.0 ± 7.5 days. More elderly patients required admission to the ICU than the nonelderly (61.6% vs 40.2%; P < 0.001), and more elderly patients required admission to a skilled nursing facility than nonelderly (42.1% vs. 9%; P < 0.001). The mortality rate for elderly patients was more than double that of nonelderly patients (20.9% vs 9.1%; P < 0.001). Pedestrian-motor vehicle collisions occurred disproportionately between the hours of 6 PM and midnight (P < 0.0001).
Conclusion
Elderly patients struck by a motor vehicle have a mortality rate twice that of the non-elderly and a higher rate of discharge to a skilled nursing facility, despite having a similar injury severity score on admission. This highlights the need for aggressive prevention efforts targeted at the elderly population.
INTRODUCTION
Pedestrian-vehicle crashes are a significant problem in public health. Although the overall risk to pedestrians has not significantly changed over the past decade, the risk of fatality after being struck by a motor vehicle has increased by more than one-third over the past 5 years. Deaths from pedestrian-vehicle crashes rank 3rd behind motorcycle riders and vehicle occupants, and constitute 11% of total crash fatalities nationally.1
Locoregional analysis is important to augment national analysis of pedestrian-vehicle crashes. Understanding contributing factors within a specific community helps determine the appropriate effectiveness measures, recognize key intervention points, and target interventions. Local analysis also reveals unique situations not seen at the national level that are subsequently addressed with community-level interventions.
The number of pedestrian fatalities varies significantly from state to state. In 2009, California, Florida, Texas, and New York accounted for 41% of the nation’s pedestrian fatalities, while the 25 states with the fewest pedestrian fatalities accounted for only 12%. In Wisconsin, pedestrian fatalities make up approximately 8% of all traffic-related deaths.2 Although Wisconsin has a low incidence of pedestrian crashes relative to national rates, improvement of pedestrian safety remains an active state policy goal.
Previous studies examining patterns in pedestrian-vehicle crashes have been largely single-center series examining smaller sample populations and have focused primarily on injury types,3–8 geographic foci,9–18 and environmental factors.19–23 Over 10 years ago, Peng and Bongard conducted the largest study to date examining pedestrian motor vehicle collisions in Los Angeles County. They found that hospital length of stay, injury severity score, revised trauma score, Glasgow coma scale and mortality all increased with age.24 Demetriades and colleagues added to this foundation in 2004 with their subsequent analysis of the LA County database, showing a higher incidence of severe trauma and higher mortality in patients older than 65.25
The purpose of our study was to examine pedestrian-vehicle crashes in Southeast Wisconsin attempting to characterize the populations, injury pattern, and timing of pedestrian-vehicle trauma. We also compared our findings to prior studies to see if the injury patterns in our region were different or similar.
METHODS
Froedtert Memorial Lutheran Hospital (FMLH) is an American College of Surgeons designated Level I adult trauma center providing care to trauma victims in the Milwaukee metropolitan area. It also is a referral trauma center for the state, receiving patients from the southeast region of Wisconsin, northern Illinois, and the Upper Peninsula of Michigan. We reviewed the FMLH trauma registry for pedestrian-vehicle crashes from January 1, 2000 to December 31, 2010. All entrants in the trauma registry are patients who have been admitted to the hospital because of their injury; ie, patients seen in the emergency department (ED) and discharged home will not appear in the trauma registry. Variables examined included patient age and gender; day, month, and time of the crash; abbreviated injury scale (AIS) score, injury severity score (ISS) score on admission, hospital and intensive care unit (ICU) length of stay (LOS), and ED and hospital disposition. The AIS is a whole number assigned by a trauma registrar to each injury and ranges from 1 (superficial) to 6 (nonsurvivable). ISS divides the body into 6 regions: head or neck, face, abdominal, chest, extremities, and external. ISS is computed by taking the top 3 largest AIS scores from each of the 3 most severely injured regions of the body and summing their squares. A patient with any AIS score of 6 is automatically given an ISS of 75. Otherwise, the ISS score will range from 1 to 75. Although ISS has limitations, it correlates with mortality and is the most common anatomic trauma scoring system. Approval was obtained by the Medical College of Wisconsin and Froedtert Hospital Institutional Review Board prior to any data collection. The association of age group with covariate was analyzed using the t test (hospital and ICU LOS), the chi-square test (death and discharge disposition), and Wilcoxon rank-sum test (ISS). Odds ratios (OR) with 95% confidence intervals were calculated. Logistic regression analysis was used to analyze the effect of age on ICU admission, mortality, and disposition. Elderly was defined as ≥ 65 years old, nonelderly was defined as < 65 years old. Multiple regression analysis was used to analyze the effect of age on hospital LOS and ICU LOS. A P-value < 0.05 was considered statistically significant.
For purposes of analyzing the time of day that incidents occurred, a day was divided into daytime (8 AM–6 PM), evening (6 PM–midnight), and night (midnight–8 AM). These time periods were chosen because that is what was used in previous research and will allow comparison.3 The chi-square goodness-of-fit test was used to determine if crashes were equally distributed across these time categories. Specifically, we tested whether the proportion of crashes during daytime, evening, and night was in a 10:6:8 ratio corresponding to the length of these periods.
RESULTS
Over the study period, 945 pedestrians were seen at FMLH after being struck by a motor vehicle. Table 1 shows the patient demographics and age distribution. The average age was 46.4 ± 19.4 years, and males made up the majority (61.3%). One hundred seventy-seven (18.7%) patients were elderly (age ≥ 65); 87 (49.2%) elderly patients were male and 69 (39%) were 80 years of age or greater.
Table 1.
Demographics of Patients Seen at Froedtert Memorial Lutheran Hospital Following Pedestrian-Vehicle Crash.
| Characteristic | n | % |
|---|---|---|
| Average age (±SD) (y) | 46.4 (19.4) | — |
| Gender | ||
| Male | 579 | 61.3 |
| Female | 366 | 38.7 |
| Age Group | ||
| 18–24 | 167 | 17.7 |
| 25–34 | 140 | 14.8 |
| 35–44 | 172 | 18.2 |
| 45–54 | 170 | 18.0 |
| 55–64 | 119 | 12.6 |
| 65–79 | 108 | 11.4 |
| ≥80 | 69 | 7.3 |
| Age Subgroups | ||
| Nonelderly (18–65 years old) | 768 | 81.3 |
| Elderly (≥65 years old) | 177 | 18.7 |
Table 2 shows the injury severity of patients treated after pedestrian-vehicle crashes. The overall median ISS score was 12, with no significant difference between elderly and nonelderly. Average hospital LOS was 10.8 (± 16.7) days and average ICU LOS was 6.0 ± 7.5 days, with no significant difference between elderly and nonelderly. However, more elderly patients required admission to the ICU than the nonelderly (61.6% vs 40.2%; P < 0.001). At the time of discharge, more elderly patients required admission to a skilled nursing facility than the nonelderly (42.1% vs 9%; P < 0.001). The overall mortality rate was 11.3%. These patients had an average ISS of 25.0 (± 18.0). Elderly patients had a significantly greater mortality rate than nonelderly patients (20.9% vs 9.1%; P < 0.001).
Table 2.
Injury Severity of Patients Treated at Froedtert Memorial Lutheran Hospital After Pedestrian-Vehicle Crashes.
| Measure | Total | Nonelderly (<65 years old) | Elderly (≥65 years old) | P-value |
|---|---|---|---|---|
| Median ISS (q25–q75a) | 12 (6–21) | 11 (6–20) | 13 (6–24) | 0.136b |
| Hospital length of stay (LOS) | 10.8 ± 16.7 | 10.7 ± 17.3 | 11.8 ± 13.1 | 0.470c |
| Intensive care unit (ICU) | ||||
| Percent ICU admission | 44.2% | 40.2% | 61.6% | <.001d |
| ICU LOS | 6.0 ± 7.5 | 6.0 ± 8.0 | 6.0 ± 5.9 | 0.949c |
| Discharge to skilled nursing facility | 14.6% | 9.0% | 42.1% | <.001d |
| Mortality | 11.3% | 9.1% | 20.9% | <.001d |
Abbreviations: ISS, injury severity score.
25th percentile – 75th percentile
Wilcoxon rank-sum test
t test
Chi-square test
The most common injury was to the extremities in both elderly and nonelderly patients (Table 3). There was little difference between groups for the next most common injury category: external (skin and soft tissue) and head/neck.
Table 3.
Injury Distribution in Pedestrian-Vehicle Crashes.
| Location | Nonelderly (<65 years old)
|
Elderly (≥65 years old)
|
Total
|
|||
|---|---|---|---|---|---|---|
| n | % | n | % | n | % | |
| Head and neck | 501 | 17.3 | 164 | 18.1 | 665 | 17.5 |
| Abdomen | 324 | 11.2 | 98 | 10.8 | 422 | 11.1 |
| Chest | 446 | 15.4 | 156 | 17.3 | 602 | 15.9 |
| Extremity | 921 | 31.8 | 254 | 28.1 | 1175 | 31.0 |
| Face | 204 | 7.05 | 44 | 4.87 | 248 | 6.53 |
| External | 496 | 17.2 | 188 | 20.8 | 684 | 18.0 |
| Total | 2892 | 100 | 354 | 100 | 3796 | 100 |
Logistic regression analysis was used to examine if age predicted hospital mortality and disposition. Controlling for ISS score and gender, we found that elderly patients were 3 times more likely to die in the hospital (OR 2.91; 95% CI = 1.72–4.90; P < 0.0001) and 7 times more likely to be transferred to a skilled nursing facility after hospital discharge (OR 7.40; 95% CI = 4.78–11.44; P < 0.0001) than non-elderly patients (Table 4). Controlling for age and gender, for 10 units increase in ISS, we observed a 250% increase in the odds of death in hospital (P < 0.0001) and 50% increase in the odds of being transferred to SNF (P = 0.0001) (Table 4).
Table 4.
Predictors of Injury Severity in Pedestrian-Vehicle Crashes.
| Parameter estimates (95% CI) | P-value | |
|---|---|---|
| Hospital Length of Stay (LOS) (≥ 65 vs < 65) | Δ=1.15 days (−1.75,4.05) | 0.446a |
| Intensive care unit (ICU) LOS (≥ 65 vs < 65) | Δ=1.13 days (−0.63,2.90) | 0.209a |
| ICU admission (≥ 65 vs < 65) | Δ=3.70 days (2.29–5.98) | <.0001a |
| Discharge to skilled nursing facility (SNF) (≥ 65 vs < 65) | OR=7.40 (4.78–11.44) | <.0001b |
| Mortality (≥ 65 vs < 65) | OR=2.91 (1.72–4.90) | <.0001b |
| Hospital Mortality | ||
| Injury severity score (ISS) (10 units increase) | OR=3.48 (2.80–4.32) | <0.0001b |
| Sex (m vs f) | OR=0.84 (0.52–1.37) | 0.49b |
| Discharge to SNF | ||
| ISS (10 units increase) | OR=1.53 (1.24–1.89) | <0.0001b |
| Sex (m vs f) | OR=0.71 (0.47–1.09) | 0.11b |
| ICU Admission | ||
| ISS (10 units increase) | OR=8.54 (6.31–11.55) | <0.0001 |
| Sex (m vs f) | OR=1.29 (0.88–1.87) | 0.19 |
| Hospital LOS | ||
| ISS (10 units increase) | Δ=5.97 (4.77,7.18) | <0.0001a |
| Sex (m vs f) | Δ=−0.13 (−2.37,2.10) | 0.907a |
| ICU LOS | ||
| ISS (10 units increase) | Δ=3.16 (2.37,3.94) | <0.0001a |
| Sex (m vs f) | Δ=−1.38 (−2.94,0.18) | 0.084a |
Abbreviations: OR is odds ratio.
Δ is mean difference
multiple regression
logistic regression
Figure 1 shows the distribution of pedestrian-vehicle crashes by time of day. Incidents were not distributed evenly (P < 0.0001) throughout the day, with more incidents in the evening (36.7% from 6 PM to midnight) and fewer during the night (39.5% from midnight to 8 AM) (Table 5). Incidents were spread throughout the week (Figure 2) and the year (Figure 3).
Figure 1.
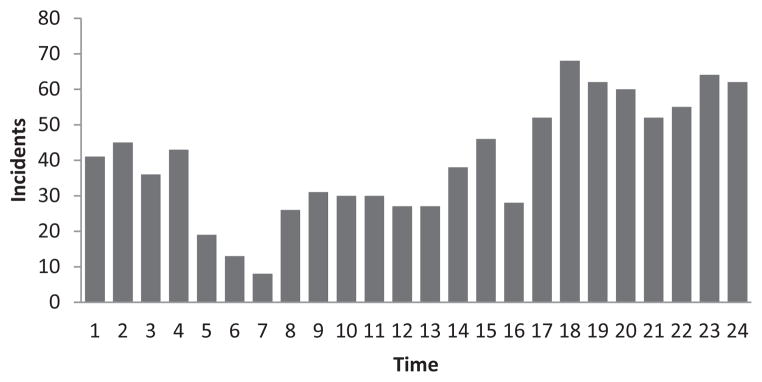
Time of Pedestrian-Vehicle Crashes.
Table 5.
Incidents of Pedestrian-Vehicle Crashes by Time of Day.
| Time | Frequency | Percent (%) | Expected Ratio (%) |
|---|---|---|---|
| Daytime (8 AM to 6 PM) | 373 | 39.5 | 10/24 (41.7%) |
| Evening (6 PM to midnight) | 347 | 36.7 | 6/24 (25%) |
| Night (midnight to 8 AM) | 225 | 23.8 | 8/24 (33.3%)a |
P < 0.0001; ie, more than expected incidents in the evening and fewer than expected during the night.
Figure 2.
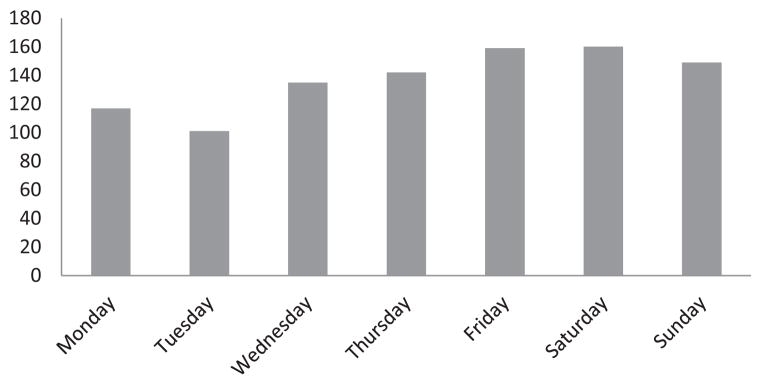
Day of Pedestrian-Vehicle Crashes
Figure 3.
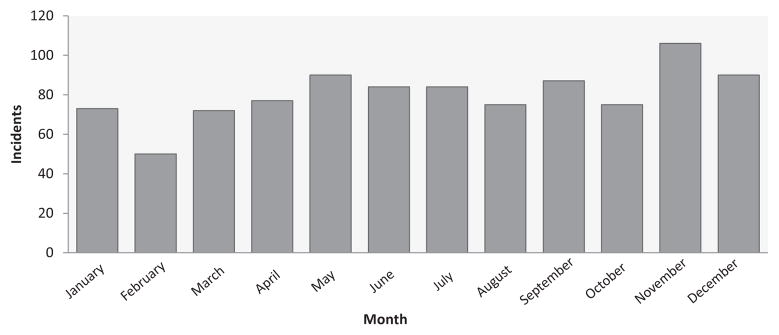
Month of Pedestrian-Vehicle Crashes.
Disposition out of the ED was divided between floor (39%), ICU (38%), and operating room (21%), with a 2% mortality rate in the ED (Figure 4). Fifty-one percent of patients were discharged home from the hospital, 16% went to a rehabilitation hospital, 13% went to a skilled nursing facility, 11% died, and 6% went home with visiting nurse assistance (Figure 5).
Figure 4.

Emergency Department Disposition Following Pedestrian-Vehicle Crashes.
Figure 5.

Hospital Disposition Following Pedestrian-Vehicle Crashes.
Multiple regression analysis was applied to see among those who were discharged alive if age, ISS, and gender affect length of stay in hospital and in ICU. The result shows that for 10 units increase in ISS, the hospital LOS increased 6 days (P value < 0.0001) and the ICU LOS increased about 3 days (P value < 0.0001) (Table 4).
DISCUSSION
Pedestrian injuries represent an important aspect of travel and road safety. Analyzing patterns in pedestrian-vehicle crashes allows for development of interventions aimed at protecting pedestrians and reducing their risk on roadways; this is one of the main goals of transportation safety. However, the problem is multifactorial. No single cause of pedestrian-vehicle crashes has been identified, and no definitive countermeasure will definitively solve the problem. States with significant numbers of fatalities as a result of pedestrian-vehicle crashes have used environmental, educational, and enforcement measures to improve pedestrian safety.26–28 Proximity to bars9,10 and crosswalk markings in absence of a traffic signal have both been associated with increased pedestrian injury.29 Interventions that have proven to be the most effective include single-lane roundabouts, sidewalks, exclusive pedestrian signal phasing, pedestrian refuge islands, and increased intensity roadway lighting.27 How these interventions will lower the rate or alter the severity of injury, especially among elderly patients, is not clear. What is clear is that a better understanding of the reasons pedestrians are struck is sorely needed.
Pedestrian motor vehicle crashes contribute significantly to the Milwaukee area trauma system. In 2001, the Wisconsin Department of Transportation released the Wisconsin Pedestrian Policy Plan 2020. One of the 3 primary goals outlined in the plan was to reduce the number of pedestrian crashes and fatalities.30 Strategies for achieving this include education, improved enforcement of existing laws, and planning that accommodates pedestrians better. One example is making changes to the areas along busy state trunk highways as they come into small and medium-sized towns. The plan proposes the use of wider median islands, longer pedestrian signals at traffic lights, and pedestrian overpasses. Our study characterizes the populations affected by pedestrian-vehicle crashes, as well as the timing with which they occur, and the outcomes of hospitalization.
The median ISS of 12 and observed overall mortality rate of 20.9% reflects the substantial force imparted on pedestrians when struck by vehicles. This is consistent with prior major studies, where overall ISS for patients ranged from 8.9 to 20 and overall mortality rates ranged from 8 to 22%.3,25,31 The ICU and hospital LOS, as well as hospital disposition, reinforce what we already know about severity of the pedestrian trauma. We found no difference between the elderly and nonelderly patients in regards to ISS, hospital LOS and ICU LOS. This may be due to an increased rate of deaths in elderly patients before even getting to the hospital. Despite the nonsignificant difference in ISS, elderly patients suffered higher rates of ICU admission, mortality, and discharge to a skilled nursing facility. Disposition out of the hospital in particular shows the toll that is taken on pedestrians who are struck by motorized vehicles, with only 51% of patients able to return home. This is consistent with results seen in prior studies and highlights the increased burden of illness and mortality suffered by elderly patients after sustaining pedestrian trauma.12,24,30,32–35
Our injury distribution was similar to previous reports in that injury to the extremities was number 1 for both nonelderly and elderly.3,4,24,31 Our study does not include pediatric patients, where head and neck injuries are more common.24 Our study confirms previous findings that pedestrian-vehicle crashes occur disproportionately between 6 PM and midnight.3,31 The June 2008 National Highway Traffic Safety Administration report showed that more than one-third of pedestrian crash deaths occurred on Fridays and Saturdays, and our data confirm that weekend days are high risk for pedestrian-vehicle incidents.1,19
Implications of our research are two-fold. First, pedestrian-vehicle crashes remain a significant source of morbidity and mortality in Wisconsin, particularly for elderly patients. Future interventions that aim to reduce the incidence and severity of pedestrian-vehicle crashes should be targeted toward this population. Further research is needed to explore the environmental factors contributing to the disproportional occurrence of pedestrian injury in the evening hours. Second, the data shows that for a given ISS score, the elderly patient has a higher mortality rate than the nonelderly patient. This highlights the need for a nontrauma hospital to transfer a patient to a trauma center even for injuries that do not seem life-threatening. A practical example is an elderly patient struck by a motor vehicle resulting in 4 rib fractures. Optimum care for this patient may require thoracic epidural placement and aggressive pulmonary toilet with the help of respiratory therapists. A nontrauma hospital may not be able to provide these interventions, and the patients like this who remain at a nontrauma center may suffer higher mortality rates than those who are transferred to a trauma center. It is important to anticipate poor outcomes and transfer patients early instead of transferring when the patient is doing poorly and may be in an irreversible downward spiral.
Limitations of our study include a relatively small patient number and an inability to capture all pedestrian-vehicle crashes because we used data from our own trauma database and not from government (ie, police, department of motor vehicles) or insurance sources. Our analysis also included only pedestrians struck by motor vehicles that were admitted to FMLH. It does not include those who died at the scene, died at other hospitals prior to transport, were treated at other hospitals, or did not report for medical treatment. However, with FMLH being the only Level I trauma center in southeastern Wisconsin there is an assumption that a patient with any type of a serious injury would be transported to FMLH either immediately or after initial care at another hospital.
CONCLUSION
Pedestrian-vehicle collisions have a high rate of morbidity and mortality and occur disproportionately between the hours of 6 PM and midnight. Elderly patients have a mortality rate that is twice that of the nonelderly and have a higher rate of discharge to a SNF, despite having the same ISS. This highlights the need for aggressive prevention efforts to mitigate the number of factors that contribute to the problem of pedestrian vehicle crashes.
Acknowledgments
Funding/Support: Funded in part by Clinical and Translational Science Award 1UL1RR031973 from the National Institutes of Health (Szabo, Xiang).
Footnotes
Financial Disclosures: None declared.
Planners/Reviewers: The planners and reviewers for this journal CME activity have no relevant financial relationships to disclose.
References
- 1.National Highway Traffic Safety Administration. National Pedestrian Crash Report. Washington, DC: National Highway Traffic Safety Administration; [Accessed April 29, 2013]. http://www-nrd.nhtsa.dot.gov/Pubs/810968.pdf. DOT HS 810 968. Published June 2008. [Google Scholar]
- 2.National Highway Traffic Safety Administration. A Compilation of Motor Vehicle Crash Data from the Fatality Analysis Reporting System and the General Estimates System. Washington, DC: National Highway Traffic Safety Administration; [Accessed April 29, 2013.]. Traffic Safety Facts 2008. http://www-nrd.nhtsa.dot.gov/Pubs/811170.pdf. DOT HS 811 170. Published 2009. [Google Scholar]
- 3.Brainard BJ, Slauterbeck J, Benjamin JB, Hagaman RM, Higie S. Injury profiles in pedestrian motor vehicle trauma. Ann Emerg Med. 1989;18(8):881–883. doi: 10.1016/s0196-0644(89)80218-5. [DOI] [PubMed] [Google Scholar]
- 4.Derlet RW, Silva J, Jr, Holcroft J. Pedestrian accidents: adult and pediatric injuries. J Emerg Med. 1989;7(1):5–8. doi: 10.1016/0736-4679(89)90401-0. [DOI] [PubMed] [Google Scholar]
- 5.Ifesanya AO, Afuwape D, Okoje VN, et al. Unintentional injury outcomes secondary to pedestrian traffic crashes: a descriptive analysis from a major medical center. Prehosp Disaster Med. 2009;24(5):443–446. doi: 10.1017/s1049023x00007299. [DOI] [PubMed] [Google Scholar]
- 6.Hannon M, Hadjizacharia P, Chan L, Plurad D, Demetriades D. Prognostic significance of lower extremity long bone fractures after automobile versus pedestrian injuries. J Trauma. 2009;67(6):1384–1388. doi: 10.1097/TA.0b013e31819ea3e0. [DOI] [PubMed] [Google Scholar]
- 7.MacLeod KE, Griswold JB, Arnold LS, Ragland DR. Factors associated with hit-and-run pedestrian fatalities and driver identification. Accid Anal Prev. 2012;45:366–372. doi: 10.1016/j.aap.2011.08.001. [DOI] [PubMed] [Google Scholar]
- 8.Helmer T, Ebner A, Samaha RR, Scullion P, Kates R. Injury risk to specific body regions of pedestrians in frontal vehicle crashes modeled by empirical, in-depth accident data. Stapp Car Crash J. 2010;54:93–117. doi: 10.4271/2010-22-0006. [DOI] [PubMed] [Google Scholar]
- 9.Schurman N, Cinnamon J, Crooks VA, Hameed SM. Pedestrian injury and the built environment: an environmental scan of hotspots. BMC Public Health. 2009;9:233. doi: 10.1186/1471-2458-9-233. [DOI] [PMC free article] [PubMed] [Google Scholar]
- 10.LaScala EA. Demographic and environmental correlates of pedestrian injury collisions: a spatial analysis. Accid Anal Prev. 2000;32(5):651–658. doi: 10.1016/s0001-4575(99)00100-1. [DOI] [PubMed] [Google Scholar]
- 11.Lee C, Abdel-Aty M. Comprehensive analysis of vehicle-pedestrian crashes at intersections in Florida. Accid Anal Prev. 2005;37(4):775–786. doi: 10.1016/j.aap.2005.03.019. [DOI] [PubMed] [Google Scholar]
- 12.Nicaj L, Wilt S, Henning K. Motor vehicle crash pedestrian deaths in New York City: the plight of the older pedestrian. Inj Prev. 2006;12(6):414–416. doi: 10.1136/ip.2005.010082. [DOI] [PMC free article] [PubMed] [Google Scholar]
- 13.Dai D, Taquechel E, Steward J, Strasser S. The impact of built environment on pedestrian crashes and the identification of crash clusters on an urban university campus. West J Emerg Med. 2010;11(3):294–301. [PMC free article] [PubMed] [Google Scholar]
- 14.Chakravarthy B, Anderson CL, Ludlow J, Lotfipour S, Vaca FE. The relationship of pedestrian injuries to socioeconomic characteristics in a large Southern California County. Traffic Inj Prev. 2010;11(5):508–513. doi: 10.1080/15389588.2010.497546. [DOI] [PubMed] [Google Scholar]
- 15.Cottrill CD, Thakuriah PV. Evaluating pedestrian crashes in areas with high low-income or minority populations. Accid Anal Prev. 2010;42(6):1718–1728. doi: 10.1016/j.aap.2010.04.012. [DOI] [PubMed] [Google Scholar]
- 16.Pulugurtha SS, Sambhara VR. Pedestrian crash estimation models for signalized intersections. Accid Anal Prev. 2011;43(1):439–446. doi: 10.1016/j.aap.2010.09.014. [DOI] [PubMed] [Google Scholar]
- 17.Gårder PE. The impact of speed and other variables on pedestrian safety in Maine. Accid Anal Prev. 2004;36(4):533–542. doi: 10.1016/S0001-4575(03)00059-9. [DOI] [PubMed] [Google Scholar]
- 18.Campos-Outcalt D, Bay C, Dellapena A, Cota MK. Motor vehicle crash fatalities by race/ethnicity in Arizona, 1990–96. Inj Prev. 2003;9(3):251–256. doi: 10.1136/ip.9.3.251. [DOI] [PMC free article] [PubMed] [Google Scholar]
- 19.Griswold J, Fishbain B, Washington S, Ragland DR. Visual assessment of pedestrian crashes. Accid Anal Prev. 2011;43(1):301–306. doi: 10.1016/j.aap.2010.08.028. [DOI] [PubMed] [Google Scholar]
- 20.Sullivan JM, Flannagan MJ. Differences in geometry of pedestrian crashes in daylight and darkness. J Safety Res. 2011;42(1):33–37. doi: 10.1016/j.jsr.2010.11.005. [DOI] [PubMed] [Google Scholar]
- 21.Lichenstein R, Smith DC, Ambrose JL, Moody LA. Headphone use and pedestrian injury and death in the United States: 2004–2011. Inj Prev. 2012;18(5):287–90. doi: 10.1136/injuryprev-2011-040161. [DOI] [PubMed] [Google Scholar]
- 22.Statter M, Schuble T, Harris-Rosado M, Liu D, Quinlan K. Targeting pediatric pedestrian injury prevention efforts: teasing the information through spatial analysis. J Trauma. 2011;71(5 Suppl 2):S511–516. doi: 10.1097/TA.0b013e31823a4b70. [DOI] [PubMed] [Google Scholar]
- 23.Roudsari B, Kaufman R, Koepsell T. Turning at intersections and pedestrian injuries. Traffic Inj Prev. 2006;7(3):283–289. doi: 10.1080/15389580600660153. [DOI] [PubMed] [Google Scholar]
- 24.Peng RY, Bongard FS. Pedestrian versus motor vehicle accidents: an analysis of 5,000 patients. J Am Coll Surg. 1999;189(4):343–348. doi: 10.1016/s1072-7515(99)00166-0. [DOI] [PubMed] [Google Scholar]
- 25.Demetriades D, Murray J, Martin M, et al. Pedestrians injured by automobiles: relationship of age to injury type and severity. J Am Coll Surg. 2004;199(3):382–387. doi: 10.1016/j.jamcollsurg.2004.03.027. [DOI] [PubMed] [Google Scholar]
- 26.Kwan I, Mapstone J. Interventions for increasing pedestrian and cyclist visibility for the prevention of death and injuries. Cochrane Database Syst Rev. 2006;(4):CD003438. doi: 10.1002/14651858.CD003438.pub2. [DOI] [PMC free article] [PubMed] [Google Scholar]
- 27.Retting RA, Ferguson SA, McCartt AT. A review of evidence-based traffic engineering measures designed to reduce pedestrian-motor vehicle crashes. Am J Public Health. 2003;93(9):1456–1463. doi: 10.2105/ajph.93.9.1456. [DOI] [PMC free article] [PubMed] [Google Scholar]
- 28.Duperrex O, Roberts I, Bunn F. Safety education of pedestrians for injury prevention. Cochrane Database Syst Rev. 2002;(2):CD001531. doi: 10.1002/14651858.CD001531. [DOI] [PMC free article] [PubMed] [Google Scholar]
- 29.Koepsell T, McCloskey L, Wolf M, et al. Crosswalk markings and the risk of pedestrian-motor vehicle collisions in older pedestrians. JAMA. 2002;288(17):2136–2143. doi: 10.1001/jama.288.17.2136. [DOI] [PubMed] [Google Scholar]
- 30.Wisconsin Department of Transportation. [Accessed April 29, 2013.];Wisconsin Pedestrian Policy Plan. 2020 http://www.dot.wisconsin.gov/projects/state/docs/ped2020-plan.pdf. Published March 2002.
- 31.Vestrup JA. A Profile of Urban Adult Pedestrian Trauma. J Trauma. 1989;29(6):741–745. doi: 10.1097/00005373-198906000-00007. [DOI] [PubMed] [Google Scholar]
- 32.Sklar DP, Demarest GB, McFeeley P. Increased pedestrian mortality among the elderly. Am J Emerg Med. 1989;7(4):387–390. doi: 10.1016/0735-6757(89)90044-2. [DOI] [PubMed] [Google Scholar]
- 33.Loo BP, Tsui KL. Pedestrian injuries in an ageing society: insights from hospital trauma registry. J Trauma. 2009;66(4):1196–1201. doi: 10.1097/TA.0b013e31817fdef6. [DOI] [PubMed] [Google Scholar]
- 34.Kim JK, Ulfarsson GF, Shankar VN, Kim S. Age and pedestrian injury severity in motor-vehicle crashes: a heteroskedastic logit analysis. Accid Anal Prev. 2008;40(5):1695–1702. doi: 10.1016/j.aap.2008.06.005. [DOI] [PubMed] [Google Scholar]
- 35.Henary BY, Ivarsson J, Crandall JR. The influence of age on the morbidity and mortality of pedestrian victims. Traffic Inj Prev. 2006;7(2):182–190. doi: 10.1080/15389580500516414. [DOI] [PubMed] [Google Scholar]