

Abstract
Acoustic emissions associated with cavitation and other bubble activity have previously been observed during ultrasound ablation experiments. Since detectable bubble activity may be related to temperature, tissue state, and sonication characteristics, these acoustic emissions are potentially useful for monitoring and control of ultrasound ablation. To investigate these relationships, ultrasound ablation experiments were performed with simultaneous measurements of acoustic emissions, tissue echogenicity, and tissue temperature, on fresh bovine liver. Ex vivo tissue was exposed to 0.9–3.3 s bursts of unfocused, continuous-wave, 3.10 MHz ultrasound from a miniaturized 32-element array, which performed B-scan imaging with the same piezoelectric elements during brief quiescent periods. Exposures employed pressure amplitudes of 0.8–1.4 MPa for exposure times of 6–20 min, sufficient to achieve significant thermal coagulation in all cases. Acoustic emissions received by a 1 MHz, unfocused passive cavitation detector, beamformed A-line signals acquired by the array, and tissue temperature detected by a needle thermocouple were sampled 0.3–1.1 times per second. Tissue echogenicity was quantified by the backscattered echo energy from a fixed region of interest within the treated zone. Acoustic emission levels were quantified from the spectra of signals measured by the passive cavitation detector, including subharmonic signal components at 1.55 MHz, broadband signal components within the band 0.3–1.1 MHz, and low-frequency components within the band 10–30 kHz. Tissue ablation rates, defined as the thermally ablated volumes per unit time, were assessed by quantitative analysis of digitally imaged, macroscopic tissue sections. Correlation analysis was performed among the averaged and time-dependent acoustic emissions in each band considered, B-mode tissue echogenicity, tissue temperature, and ablation rate. Ablation rate correlated significantly with broadband and low-frequency emissions, but was uncorrelated with subharmonic emissions. Subharmonic emissions were found to depend strongly on temperature in a nonlinear manner, with significant emissions occurring within different temperature ranges for each sonication amplitude. These results suggest potential roles for passive detection of acoustic emissions in guidance and control of bulk ultrasound ablation treatments.
Keywords: ultrasound ablation, therapy, acoustic emissions, passive cavitation detection
INTRODUCTION
The objective of the experiments reported here was to gain understanding of the possible role of cavitation and other bubble activity during bulk thermal ablation of tissue by continuous-wave, unfocused ultrasound. This approach to ultrasound ablation, which has recently been developed and employed by several investigators (Diederich et al. 1999; Chopra et al. 2001; Prat et al. 2002, Makin et al. 2005), has the potential to treat large tissue volumes at rates comparable to radiofrequency ablation and other minimally-invasive bulk ablation modalities. As with other thermal ablation methods, noninvasive monitoring and control of energy delivery, tissue temperature, and coagulation effects could improve the reliability of ablation, thus increasing the safety and efficacy of these minimally invasive treatments.
Cavitation and other bubble activity is known to occur during thermal treatments by therapeutic ultrasound at megahertz frequencies in vivo (ter Haar and Daniels 1981; Hynynen 1991; Fry 1995; Rabkin et al. 2005, 2006). Such activity can be exploited to visualize ablation effects (Sanghvi et al. 1995; Rabkin et al. 2005, 2006) or to enhance tissue absorption (Melodelima et al. 2001; Sokka et al. 2003; Umemura et al. 2005; Kaneko et al. 2005), but can also complicate ultrasound energy deposition and the resulting spatial pattern of tissue coagulation (Watkin et al. 1996; Chen et al. 2003; Makin et al. 2005; Mast et al. 2005). Mechanisms for interactions between cavitation activity and ultrasound-induced heating have been clarified by several detailed numerical modeling studies (Hilgenfeldt et al. 2000; Chavrier et al. 2000; Yang et al. 2004) and phantom experiments (Holt and Roy 2001; Khokhlova et al. 2006). Cavitation activity, measured by passive detection of acoustic emissions, has also been found to correlate with cellular-level bioeffects (Edmonds and Ross 1986; Hallow et al. 2006) and with ultrasound enhancement of thrombolysis (Datta et al. 2006).
Recent experimental studies have employed passive cavitation detection during high-intensity focused ultrasound (HIFU) exposures (Rabkin et al. 2005, 2006; Thomas et al. 2005; Farny et al. 2005; McLaughlan et al. 2006; Coussios et al. 2006). These studies have shown that cavitation causing both subharmonic emissions, consistent with stable bubble shape oscillations, and broadband emissions, consistent with inertial bubble collapse, can occur during HIFU treatments. Some correlation has been found between broadband acoustic emission levels and increased B-scan image brightness (Rabkin et al. 2005, 2006) as well as enhanced heating effects (Thomas et al. 2005; Coussios et al. 2006). However, it has also been shown that broadband and subharmonic emission levels do not correspond precisely with increases in tissue echogenicity (Rabkin et al. 2005; McLaughlan et al. 2006), and that broadband emissions can decrease in some cases as the tissue temperature rises (Farny et al. 2005; Coussios et al. 2006). Kilohertz-frequency emissions, consistent with tissue boiling (Osborne and Holland 1947; Ying 1973), have also been detected during HIFU exposures (McLaughlan et al. 2006; Sanghvi et al. 1995; Anand et al. 2004), and have been found to correlate with enhanced backscattering from tissue (Sanghvi et al. 1995; McLaughlan et al. 2006). These low-frequency emissions have also been used successfully to measure the onset time of tissue boiling, allowing estimation of heating rates due to the HIFU sonication (Anand et al. 2004).
However, these experimental studies of HIFU, with reported in situ ultrasound intensities of 200–2500 W/cm2 for frequencies 1–4 MHz, do not indicate how cavitation activity interacts with ultrasound-induced heating for the unfocused ultrasound exposures employed in minimally-invasive bulk thermal ablation (Diederich et al. 1999; Chopra et al. 2001; Prat et al. 2002; Makin et al. 2005; Mast et al. 2005). Ultrasound bulk ablation treatments cause tissue temperature elevation to occur more slowly, but in a larger tissue volume, than HIFU treatments. Resulting volumetric rates of tissue ablation are ~1–4 ml/min, comparable to radiofrequency ablations currently in clinical use. In these treatment regimes, e.g. 60–80 W/cm2 spatial average intensity at the probe surface for a 3.1 MHz beam (Mast et al. 2005), cavitation behavior may be substantially different than in highly focused beams. At the same time, thermal ablation performed at lower intensities may be more sensitive to heat losses caused by perfusion in vivo (Mast et al. 2005), so that potential methods for monitoring and control of ultrasound ablation are particularly important for these modalities. Thus, knowledge of cavitation dynamics during bulk ultrasound ablation is needed.
Here, acoustic emissions associated with cavitation and other bubble activity were passively detected during in vitro ultrasound ablation under exposure conditions similar to those employed by Mast et al. (2005) with a miniaturized image-ablate ultrasound array device. These measurements are intended to clarify the possible roles of cavitation and other bubble activity in this treatment regime, including the relationships between cavitation, tissue echogenicity, tissue temperature, and the progress of thermal ablation. Characterization of these phenomena is a step toward their practical application, including the possibilities of therapy monitoring and control using passive cavitation detection.
MATERIALS AND METHODS
Measurements
The experimental configuration employed is shown in Fig. 1. Whole ex vivo bovine livers were acquired from a local slaughterhouse and used less than 12 hours post mortem. Tissue was kept chilled at 0°C in a thermally insulated container until cutting for use. Liver specimens were cut to dimensions 7×3.5×3 cm3 with the liver capsule comprising one of the 7×3.5 cm2 surfaces. Immediately after cutting, the sample was placed in a latex condom (Probe Guard, Carter Products, New York, New York, USA) with a small amount of phosphate-buffered saline that had been degassed a minimum of 90 min, found sufficient to achieve about 36% dissolved oxygen saturation, and allowed to acclimate to room temperature (approximately 25°C). Care was taken to minimize gas entrainment during tissue handling. The sample was suspended in a water tank filled with deionized water, which had acclimated to room temperature and other ambient conditions for at least 12 hours.
Fig. 1.

Experiment configuration. (a) Experimental setup, showing a bovine liver sample with inserted thermocouple, image-ablate array, and passive cavitation detector (PCD). (b) Top view showing cross-sectional beam of image-ablate array (horizontal, red) (Mast et al. 2005), cross-sectional sensitivity beam pattern of detector at 1 MHz (vertical, blue) (Mast and Yu 2005), and relative positions of the transducers, thermocouple, and tissue. The image-ablate array beam and PCD sensitivity pattern are shown on linear scales with brightness proportional to amplitude. (c) B-scan of a bovine liver tissue sample from the image-treat array, showing the region of interest employed for grayscale analysis. The thermocouple tip is seen at the ROI center.
Thermal ablation and B-scan imaging were performed using a miniaturized, 32-element image-ablate array (Mast et al. 2005) (THX 3N, Guided Therapy Systems, Mesa, Arizona, USA) controlled by the Iris imaging and ablation system (Guided Therapy Systems, Mesa, Arizona, USA). The Iris system provides user-programmable control of therapeutic ultrasound exposures for image-ablate arrays, as well as B-scan imaging with capabilities comparable to clinical diagnostic scanners (Barthe 2004; Makin 2005). The image-ablate array employed has an active surface of 2.3 × 49 mm2 and individual element sizes of 2.3 mm in elevation and 1.5 mm in azimuth. The array was placed parallel to the liver capsule at a distance of 12.7±2.4 mm (mean ± standard deviation of distances measured from image-ablate array B-scans, N = 18), as illustrated in Fig. 1b. B-scan gain and time-gain compensation were adjusted to obtain signal levels appropriate for digitization, as well as uniform speckle brightness within the liver specimen image. A representative tissue B-scan from the system is shown in Fig. 1c.
Passive cavitation detection was performed using a 25 mm circular diameter, unfocused, 1 MHz broadband receiver (C302, Panametrics, Waltham, Massachusetts, USA), placed perpendicular to the image-ablate array at a similar distance from the opposing tissue surface, as illustrated in Figs. 1a and 1b. This receiver was sensitive to acoustic emissions emanating from the entire tissue region significantly heated by the image-ablate array beam, as illustrated by the sensitivity beam pattern shown in Fig. 1b. Since acoustic emissions may originate at any point within the simultaneously sonicated and heated tissue region (volume ~6 ml, based on observed ablation rates), this broad sensitivity pattern ensured that all significant emissions were recorded throughout each treatment. The resulting spatial averaging provides better characterization of overall cavitation activity for our bulk ablation experiments, compared to the highly-focused detectors appropriate for HIFU ablation (Rabkin et al. 2005, 2006; Thomas et al. 2005; Farny et al. 2005; McLaughlan et al. 2006; Coussios et al. 2006).
A 0.4 mm diameter needle thermocouple (Type B, Ella CS, Hradec Králové, Czech Republic) was inserted at a depth of 7.7 ± 2.3 mm (measured from image-ablate array B-scans, N = 18) from the tissue surface facing the array, with the needle axis parallel to the array axis, as seen in Fig. 1b. Fig. 1c shows a representative B-scan image of the liver tissue sample with the inserted needle thermocouple. The thermocouple location corresponds approximately to the point of maximum tissue heating and the center of thermal lesions formed, so that temperature measurements at this location represent overall ablation progress throughout a given treatment. Since the therapeutic ultrasound beam employed here was unfocused, temperature gradients near the center of the heated region are small, as seen from models of tissue heating from these image-ablate arrays (Mast et al. 2005). At other points throughout the heated region, the time-dependent temperature elevation is roughly proportional to the temperature elevation at the central thermocouple location. Thus, this single-point temperature measurement can be considered an indicator of the overall tissue heating throughout the treated region, consistent with our unfocused passive cavitation detector.
Ablation exposures, specified and controlled using the Iris system, were performed by firing the center 16 array elements at 3.1 MHz as an unfocused 2.3×24.5 mm2 aperture with amplitudes corresponding to calibrated acoustic power outputs of 16.2, 28.8, and 45.0 W. The resulting unfocused beam is collimated in the array direction (beam width similar to the 24.5 mm aperture width) and exhibits spreading in the elevation direction, as illustrated by the cross section shown in Fig. 1b. Acoustic power calibration was performed by the probe manufacturer using a radiation force balance method (Makin et al. 2005). Stability of array performance was verified by regular measurements of element capacitance between experiments, as well as real-time display of delivered electrical power during each exposure. The measured acoustic powers were converted to in situ acoustic pressure levels by computing the diffracted acoustic field of this sub-aperture using a Fresnel approximation for transducer arrays with rectangular elements (Freedman 1960; Mast 2007), which has previously been shown to characterize array fields accurately (Makin et al. 2005). At a distance of 15 mm from the array, the acoustic pressure amplitudes employed were thus estimated as 0.83, 1.10, and 1.38 MPa, corresponding to plane-wave acoustic intensities of 23, 41, and 64 W/cm2.
A total of six exposures were performed for each of these three amplitude conditions, for a total of 18 experiments. Total exposure times employed, found to ensure significant thermal coagulation in each case, were 20 min for the 0.8 MPa amplitude, 10 min for the 1.1 MPa amplitude, and 5 min for the 1.4 MPa amplitude. Pulse lengths, chosen so that comparable tissue heating would occur from a pulse at each sonication amplitude, were 3.3 s for the 0.8 MPa exposures, 1.7 s for the 1.1 MPa exposures, and 0.9 s for the 1.4 MPa exposures. The quiescent period between each pulse was the interval required for the Iris system to switch between therapy and imaging mode, acquire a single B-scan image frame, and resume therapy mode, or about 30 ms. The resulting duty cycles were 97–99%.
Beamformed, radiofrequency A-line signals were recorded during each quiescent period using a 14-bit, PC-based A/D card (Compuscope CS 14200, Gage Applied, Montreal, Canada) at a sampling rate of 33.3 MHz. During each quiescent period, 32 A-lines of 2048-sample length were recorded, comprising an entire B-scan frame with dimensions 49 mm in the array direction and 47 mm in the depth direction.
Signals from the passive cavitation detector (PCD) were acquired at a 10 MHz sampling rate for 100 ms intervals synchronized to begin 100 ms after each image acquisition, ensuring that these signals were recorded only during continuous-wave exposure. The rate of acquisition for these signals, corresponding to the rate of acquisition for B-scan frames, was 0.3 Hz for the 0.8 MPa amplitude, 0.6 Hz for the 1.1 MPa amplitude, and 1.1 Hz for the 1.4 MPa amplitude. PCD signals were recorded by a digital sampling oscilloscope (WaveRunner 6050A, LeCroy, Chestnut Ridge, New York, USA) after amplification by a low-noise preamplifier (SR 560, Stanford Research Systems, Sunnyvale, California, USA). The preamplifier also acted as a low-pass filter (cutoff frequency 1.4 MHz, slope −6 dB/octave) to reduce fundamental (3.1 MHz) signal components caused by diffraction and scattering of the high-amplitude incident wave. This filtering, in addition to the limited bandwidth of the PCD, reduced fundamental signal components to a level approximately 30 dB above background noise, comparable to the amplitude of subharmonic acoustic emissions in these experiments.
Temperature from the needle thermocouple probe was recorded using a digital data logger (Omegaette HH306, Omega Engineering, Stamford, Connecticut, USA) at a sampling rate of 1 Hz throughout each ablation experiment. For data analysis, recorded temperatures were temporally interpolated to correspond with the sampling times of the echo data and PCD signal acquisitions.
After each ablation treatment, tissue samples were frozen and sectioned into macroscopic slices of calibrated thickness for evaluation (Makin et al. 2005). A slice thickness of 2 mm was chosen as the smallest practical for consistent, damage-free tissue handling. Areas ablated in each tissue section were quantified by manual segmentation (ImageJ, National Institutes of Health, Bethesda, Maryland, USA) into regions of uniform discoloration associated with specific temperature or thermal dose thresholds (Mast et al. 2005). Based on pathologic analysis of in vivo thermal ablation studies, gross discoloration of tissue by thermal effects consistently indicates coagulative necrosis and tissue death (Thomsen 1999). The total volumes of tissue ablation (all coagulated tissue) were thus estimated and employed to compute volumetric ablation rates (ml/min) for each experiment. Similarly, the total volumes of overtreatment (brown cores of some thermal lesions) were determined and used to compute volumetric overtreatment rates for each experiment. These overtreated regions, which correspond to the central island in the “island and moat” description of HIFU lesions (Warwick and Pond 1968), incurred temperature elevations and thermal doses significantly higher than those required for coagulative necrosis (Mast et al. 2005). The segmentation process is illustrated in Fig. 2, which shows segmented areas of ablated and overtreated regions for a representative tissue section from a 1.4 MPa, 5 min exposure as described in Materials and Methods. Ablation rates averaged 0.14, 0.66, and 1.15 ml/min for the 0.8, 1.1, and 1.4 MPa amplitudes, while overtreatment rates averaged 9.2 · 10−4, 5.5 · 10−3, and 9.2 · 10−3 ml/min (N = 6 for each of the three amplitude conditions).
Fig. 2.
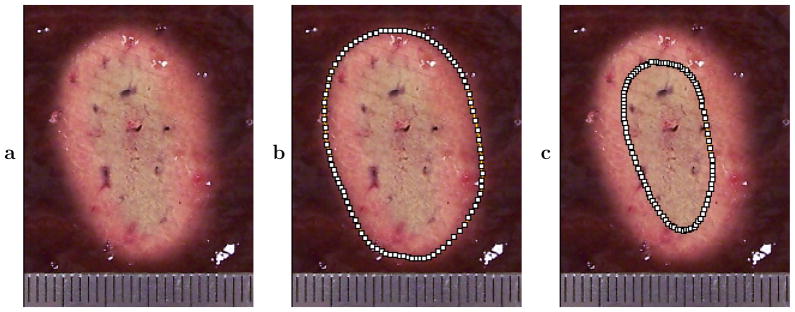
Representative cross section of treated bovine liver tissue from one of the 1.4 MPa exposures, showing segmentation of ablated regions (all coagulated tissue) and overtreated regions (brown cores of some lesions). This cross section was taken parallel to the tissue surface (perpendicular to the image plane) at a depth of 8 mm. The ruler shown is scored at 1 mm intervals. (a) Treated cross section. (b) Segmented area of complete ablated region. (c) Segmented area of inner, overtreated region.
Data processing
Acoustic emissions, intended to signify cavitation and other bubble activity, were quantified by spectral analysis of PCD signals. For each 100 ms signal sampled at 10 MHz, a power spectrum density was estimated by the periodogram method (Bartlett 1950) using 1000-sample (100 μs) rectangular windows with no overlap, so that 1000 periodograms (i.e., magnitude-squared discrete Fourier transforms) were averaged to obtain power spectra with a frequency resolution of 10 kHz. To isolate different physical mechanisms of bubble activity, spectral energy was integrated within three frequency bands. The first band considered, consisting of the single frequency bin centered at the subharmonic frequency of 1.55 MHz, is sensitive to nonlinear bubble vibrations often associated with stable cavitation activity (Leighton 1994; Yang and Church 2005). Because of the highly narrow-band nature of the subharmonic oscillations and the high frequency resolution of the spectrum measurements, this single bin was sufficient to fully characterize the subharmonic emissions. The second band, covering frequencies 0.3–1.1 MHz, was chosen to characterize broadband emissions such as those resulting from inertial bubble collapse (Leighton 1994; Yang and Church 2005). This frequency band, well within the known range for acoustic emissions from inertial cavitation (Leighton 1994), was chosen for optimal detector sensitivity and convenience of data acquisition. The third band, ranging from 10–30 kHz (the three frequency bins of lowest nonzero center frequency), characterizes low-frequency emissions associated with tissue boiling (Osborne and Holland 1947; Ying 1973). Electronic noise levels within each band were quantified by performing the same data acquisition and analysis for signals acquired during sham exposures, in which the Iris system drove a 50 Ω dummy load. The resulting spectra, which were nearly indistinguishable from spectra measured in the absence of any signal, were used as reference noise levels for scaling of the measured emissions. Instantaneous and time-average spectral energy in each band for the ablation experiments were quantified in dB relative to this measured noise energy in the same band.
The time variation of tissue echogenicity was calculated using the RF echo data recorded from the image-ablate array. For each measurement, echo energy was quantified as the mean-square value of the echo signals within a region of interest spanning 24.5 mm or 16 lines in azimuth (corresponding to the extent of the therapy beam), and from 8–32 mm in range (the region predominantly heated by the therapy beam, approximately centered on the active thermocouple element). Because the initial echogenicity varied from sample to sample depending on the tissue structure, mean grayscale values were computed in dB relative to the mean value at the onset of treatment.
Possible artifacts in the measured acoustic emissions were minimized by several methods. First, it was confirmed that the 1 MHz PCD successfully recorded broadband emissions within the frequency range 0.3–1.1 MHz during acoustic destruction of an ultrasound contrast agent (Optison, Amersham Health, Amersham, United Kingdom), in a manner similar to the passive cavitation detection performed by Giesecke and Hynynen (2003). Passive cavitation detection over a similar frequency band was also performed by Rabkin et al. (2005, 2006) to characterize inertial cavitation. To confirm that detected acoustic emissions were not caused by cavitation in the deionized tank water outside the tissue sample, exposures identical to the tissue experiment conditions were performed in the empty tank and found to result in negligible emissions.
To control for possible influence of the thermocouple surface on cavitation seeding, two complete ablation exposures were performed at each of the three amplitude conditions, with identical conditions except for absence of the needle thermocouple. Possible thermocouple self-heating artifacts (Hynynen and Edwards 1989) were not compensated and may have resulted in small positive biases in the absolute temperatures measured. Measurements of thermocouple self-heating, performed under exposure conditions identical to the present ablation experiments, indicate that any such temperature biases were no greater than 3° C.
Correlation analyses were performed among the time-averaged and instantaneous measured quantities. First, the volumetric ablation rate for each experiment, as well as the volumetric rate of overtreatment, as defined in Materials and Methods, were correlated with time-averaged subharmonic, broadband, and low-frequency acoustic emission levels for each experiment (N = 18 for each pair). Correlation coefficients and corresponding p-values were computed to assess statistical significance based on the criterion p < 0.01 (two-tailed). Since the passive cavitation detector interrogated the entire volume significantly heated by the image-ablate array beam, the signals recorded include acoustic emissions originating from locations throughout the tissue volume undergoing ablation. Thus, these correlation analyses of time-averaged quantities provide an assessment of any correspondence between temporally consistent, detectable bubble activity and treatment effectiveness for the bulk ablation conditions employed here.
In addition, to assess the temporal correspondence of detected acoustic emissions with simultaneous tissue properties, all time-dependent measured quantities were cross-correlated for all epochs recorded (N = 6179 for all data points in the 18 experiments). The time-dependent quantities measured included acoustic emissions in the three bands considered, mean B-scan grayscale value within a region of interest (ROI), and tissue temperature measured at a single point. The ROI for computation of mean grayscale value, illustrated in Fig. 1, was chosen to cover the area of the image plane incurring significant tissue heating, within the volume interrogated by the passive cavitation detector.
The temperature measurements employed in this correlation analysis were obtained at a single point near the center of the ROI at the depth of maximum tissue heating, as described above. Because of the relatively broad heating pattern of the unfocused image-ablate array (Makin et al. 2005, Mast et al. 2005), this single-point temperature measurement provides an estimate of the tissue temperature throughout the center of the heated region. The relative homogeneity of heating in this region is illustrated by Fig. 2, which shows a treated tissue cross section taken near the thermocouple position at a depth of 8.0 mm. Thus, for the purpose of correlating tissue heating with changes in tissue backscatter and acoustic emissions, this single-point measured temperature can be considered an indicator of the overall progress of a given ablation treatment.
Correlation coefficients were computed for each possible pair of temporal variables for the entire set of measured epochs across the 18 experiments (N = 6179), providing a measure of correspondence between time-dependent acoustic emissions, simultaneous tissue echogenicity, and the temporal progress of tissue ablation. Statistical significance for these correlations was assessed using the criterion p < 0.01 (two-tailed). In interpretation of these correlations, it is important to recognize that the correlated measurements of acoustic emissions, mean grayscale values, and tissue temperatures did not interrogate identical sample volumes. Thus, while these analyses provide insight about relationships between these measured quantities within the heated region, they should not be considered definitive tests of local correlation between tissue temperature, backscatter, and acoustic emissions.
RESULTS
Representative time-frequency surface plots of the measured PCD spectra for each exposure condition are shown in Fig. 3. These plots illustrate the three distinct acoustic emission phenomena considered here. Subharmonic emissions at 1.55 MHz occur sporadically in all three cases. Broadband emissions are seen within the 0.3–1.1 MHz band in all cases, with increasing amplitude at the higher sonication levels. Strong low-frequency emissions within the 10–30 kHz band, associated with tissue boiling, are seen only in the highest-amplitude case [1.4 MPa, Fig. 3c] late in the treatment cycle.
Fig. 3.

Time-frequency plots for representative passive cavitation detector (PCD) spectra at the three exposure conditions employed. Spectra are shown in dB relative to a measured noise level. All panels show narrow-band subharmonic emissions at 1.55 MHz and broadband emissions throughout the depicted frequency range. Panel (c) also shows low-frequency emissions in the kHz range for times ≥ 4 min. (a) 0.8 MPa nominal sonication amplitude. (b) 1.1 MPa. (c) 1.4 MPa.
Mean and standard deviation values for the time-averaged acoustic emission levels, based on measured spectra for all 18 experiments analyzed, are shown in Fig. 4 for the three frequency bands considered. Emissions at the subharmonic frequency are seen to vary among experiments at each amplitude, consistent with the large standard deviations shown (comparable to the mean emission level in each case). Broadband emissions were much more consistent, with time-averaged levels predictably increasing with the exposure pressure amplitude and relatively small deviations between experiments. Low-frequency emissions were generally small for the 0.8 MPa and 1.1 MPa amplitudes, but larger and more variable for the 1.4 MPa amplitude. This is consistent with the expectation that tissue boiling is more likely to occur at higher acoustic intensities. Emission levels are not directly comparable among the three frequency bands because of frequency-dependent variations in the detector sensitivity.
Fig. 4.
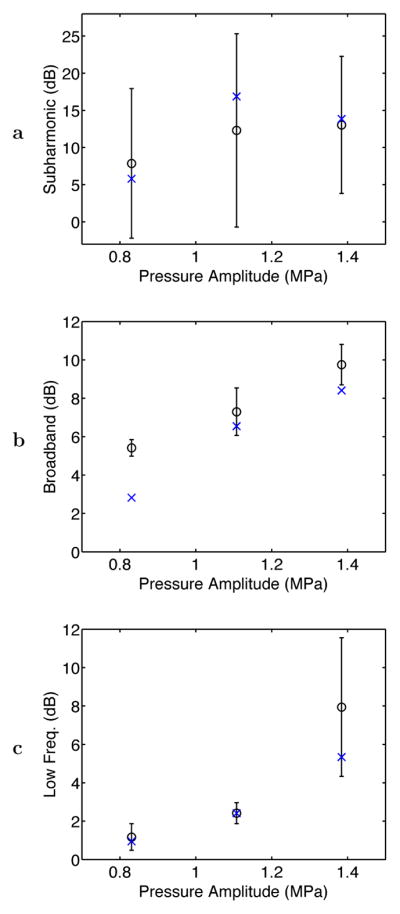
Average levels for PCD-measured acoustic emissions within subharmonic, broadband, and low-frequency intervals at the three exposure conditions employed. Plotted as circles with error bars are the mean and standard deviation of the average emission level for each pressure amplitude (N = 6 for each). The plotted “x” symbols show average acoustic emission levels in each band for two experiments without the needle thermocouple at each exposure condition.
Also shown in Fig. 4 are the mean time-averaged acoustic emissions levels for two control experiments performed without the needle thermocouple at each exposure condition. Measured emission levels in each band show similar trends with or without the thermocouple present, with no substantial discrepancies except for broadband emissions at the 0.8 MPa amplitude. This discrepancy suggests that the hydrophobic thermocouple surface may have decreased the pressure threshold for inertial cavitation, causing increased broadband emissions to occur at lower pressures when the thermocouple was present. However, this phenomenon did not change the general trend of increasing broadband emissions with increased sonication amplitude, and is thus not expected to substantially affect the correlation results presented below. In general, these control experiments indicate that any influence of the needle thermocouple on cavitation activity was of secondary importance in these experiments.
Representative time series for experiments at each exposure condition are shown in Fig. 5, for the same experiments illustrated in Fig. 3. The temperature time history shows a significant rise over the course of each experiment to temperatures > 75°C associated with significant thermal ablation, with higher heating rates at higher acoustic amplitude as expected. A local decline in temperature, seen about 4 min into the highest-amplitude (1.4 MPa) treatment, is consistent with acoustic shadowing caused by tissue or water vaporization proximal to the thermocouple (Makin et al. 2005). Acoustic emissions are shown in dB relative to the measured noise floor, as described in Materials and Methods, so that the measured emission level was near 0 dB in each band immediately before and after the ultrasound exposure. Subharmonic emissions occurred in each case shown, appearing sporadically at the two lower amplitudes (0.8 and 1.1 MPa) but late in the highest-amplitude (1.4 MPa) treatment, after the apparent vaporization. Broadband emissions were largest in the highest-amplitude case, and also appear to increase with the treatment time in this case. Low-frequency emissions were small except in the highest-amplitude case after the apparent vaporization. Tissue echogenicity rose with temperature to a limited extent, except in the highest-amplitude case where a rapid increase occurred at the time of apparent vaporization, coincident with the rise in low-frequency emissions. Notably, the passive cavitation detector was sensitive to acoustic emissions originating within a broad region. Thus, bubble activity from multiple tissue regions, possibly varying due to local differences in temperature and pressure amplitude, may have contributed to received emission spectra.
Fig. 5.

Representative plots of the measured time-dependent temperature, acoustic emission levels, and B-scan mean grayscale value for one ablation experiment at each of the three exposure conditions employed.
Table 1 shows correlation coefficients among average acoustic emission levels in the three bands considered and the measured volumetric rates of ablation and overtreatment, as defined above in Materials and Methods and illustrated in Fig. 2. Volumetric rates of ablation and overtreatment showed significant correlation with time-averaged broadband and low-frequency emission levels across the 18 experiments analyzed, as illustrated in Fig. 6, but did not correlate significantly with subharmonic emission levels. Notable is that the ablation rate correlated more highly with broadband emissions (r = 0.848) than with low-frequency emissions (r = 0.747), while the rate of overtreatment correlated more highly with low-frequency emissions (r = 0.754) than with broadband emissions (r = 0.682). These statistically significant correlations suggest that for the experiments reported here, increases in average broadband and low-frequency emission levels corresponded with increased bulk ablation effects, but average subharmonic emission levels were not measurably related to ablation effects.
Table 1.
Correlation matrix for time-averaged quantities over all measured epochs (N = 18 for the 18 experiments). Correlation coefficients in bold type are statistically significant (p < 10−2 in all cases).
| Subharmonic | Broadband | Low-frequency | Overtreatment | |
|---|---|---|---|---|
| 0.144 | 0.848 | 0.747 | 0.663 | Ablation |
| 0.172 | 0.250 | 0.225 | Subharmonic | |
| 0.697 | 0.682 | Broadband | ||
| 0.754 | Low-frequency |
Fig. 6.

Scatter plots of ablation rate vs. time-averaged acoustic emission levels for the three frequency bands considered: (a) subharmonic, (b) broadband, and (c) low-frequency emissions. Points are shown for all 18 experiments performed at the three exposure conditions employed.
The scatter plot for ablation rate vs. average acoustic emission levels, shown in Fig. 6, suggests that the volumetric ablation rate was correlated approximately linearly with broadband emissions but nonlinearly with low-frequency emissions. The correspondence between measured broadband emissions and bulk ablation rate may result from increased number or amplitude of inertial cavitation events with increased intensity of the therapeutic ultrasound beam, which in turn is proportional to the rate of heat deposition. The observation of nonlinear correspondence between low-frequency emissions and volumetric ablation rate suggests a consistency between vaporization and rapid tissue ablation, both of which were associated with rapid temperature rises in the experiments considered. The corresponding scatter plot for the overtreatment rate, shown in Fig. 7, instead shows an approximately linear correlation, suggesting that overtreatment effects (defined here by tissue browning, as illustrated in Fig. 2) and low-frequency emissions both occurred at similar temperature elevations.
Fig. 7.

Scatter plots of overtreatment rate vs. time-averaged acoustic emission levels for the three frequency bands considered: (a) subharmonic, (b) broadband, and (c) low-frequency emissions. Points are shown for all 18 experiments performed at the three exposure conditions employed.
Correlation coefficients for the time-dependent measured temperature, acoustic emission levels, and B-scan mean grayscale value are shown in Table 2, with statistically significant correlations indicated in bold type. These correlation values indicate temporal correspondence among simultaneously measured acoustic emissions, tissue echogenicity, and the progress of tissue heating throughout an ultrasound ablation procedure. Measured temperature is seen to correlate significantly (p < 10−25 for N = 6179 epochs from 18 ablation experiments) with low-frequency emissions, broadband emissions, and relative tissue echogenicity (mean grayscale value), with low-frequency emissions showing the strongest correlation. However, measured subharmonic emissions were uncorrelated with simultaneously measured tissue temperature. The relative grayscale value correlated significantly with low-frequency and subharmonic emissions, although the measured correlation coefficients are relatively weak (r < 0.25). Tissue echogenicity was not significantly correlated with broadband emissions in these experiments. These temporal correlations suggest that overall tissue heating and ablation progress may correspond with measurable broadband and low-frequency emissions as well as tissue echogenicity for the ablation conditions studied here. Although the temporal correlations observed are not close to unity, their statistical significance suggests potential for use in treatment monitoring, as discussed below.
Table 2.
Correlation matrix for time-dependent quantities over all measured epochs (N = 6179 for the 18 experiments). Correlation coefficients in bold type are statistically significant (p < 10−25 in all cases).
| Subharmonic | Broadband | Low-frequency | Grayscale | |
|---|---|---|---|---|
| −6.47 · 10−4 | 0.419 | 0.527 | 0.455 | Temperature |
| 1.02 · 10−4 | 3.54 · 10−3 | 0.123 | Subharmonic | |
| 0.651 | 2.32 · 10−3 | Broadband | ||
| 0.218 | Low-frequency |
Corresponding scatter plots for the time-dependent variables are shown in Figs. 8 and 9. Although these plots are somewhat complicated due to the large number of data points (N = 6179), some observations can be made. In Fig. 8a, the scatter plot for subharmonic emissions shows definite structure, even though no significant linear correlation was found. Except for one outlier point, no subharmonic emissions exceeded 10 dB above background for measured tissue temperatures below 45°C. The nature of subharmonic emissions also varied with the intensity of sonication. For the lowest intensity employed (nominal pressure amplitude 0.8 MPa), subharmonic emissions corresponded consistently with measured temperatures in the range 47°–49°C. Within this temperature range, 70% of the measured subharmonic emission levels were greater than 10 dB above background for the 0.8 MPa sonications. Subharmonic emissions are concentrated at higher temperatures for the two higher sonication intensities employed.
Fig. 8.

Scatter plots of instantaneous measured tissue temperature vs. acoustic emission levels for the three frequency bands considered: (a) subharmonic, (b) broadband, and (c) low-frequency emissions. Points are shown for all 6179 epochs within 18 experiments at the three exposure conditions employed.
Fig. 9.

Scatter plots of instantaneous measured mean B-scan grayscale value (MGSV) in the heated region of interest vs. acoustic emission levels for the three frequency bands considered: (a) subharmonic, (b) broadband, and (c) low-frequency emissions. Points are shown for all 6179 epochs within 18 experiments at the three exposure conditions employed.
The scatter plot for broadband emissions shown in Fig. 8b shows a general rise in emission level with the nominal sonication intensity, consistent with the average emission levels shown in Fig. 4. Some broadband emissions of much higher amplitude are also seen for higher temperatures at the two higher pressure levels (nominal amplitudes 1.1 and 1.4 MPa). Low-frequency emissions, illustrated in Fig. 8c, appear to scale with sonication amplitude at low temperatures, similar to the broadband emissions measured in a higher frequency range. However, low-frequency emissions far above background occurred preferentially at high temperatures, suggesting tissue boiling. For epochs with thermocouple-measured temperature greater than 100°C, 75% showed measured low-frequency emissions > 5 dB above background. For epochs with thermocouple-measured temperature less than 80°C, 80% showed measured low-frequency emissions < 5 dB above background. Discrepancies may occur in part because temperatures measured at the thermocouple tip did not necessarily correspond to the maximum tissue temperature.
Fig. 9 shows scatter plots of the relative echo brightness or mean grayscale value (MGSV) within the heated region of interest, plotted as a function of the instantaneous thermocouple-measured temperature and the subharmonic, broadband, and low-frequency acoustic emission levels. The plot of MGSV vs. temperature in Fig. 9a shows a general trend of increasing echo brightness with tissue temperature. The highest grayscale values (relative MGSV> 5 dB) occurred only for temperatures > 80°C at the thermocouple tip, suggesting the likelihood of tissue or water vaporization. The plots of temperature vs. the three measured acoustic emission levels in Fig. 9b–d show considerable scatter. Fig. 9b and Fig. 9d suggest a weak dependence of MGSV on acoustic emission level for the subharmonic and low-frequency bands measured, although the corresponding correlation coefficients in Table 2 show statistical significance. In Fig. 9c, broadband emission levels appear to be nearly independent of the echo brightness, consistent with the small correlation between grayscale value and broadband emissions seen in Table 2. Thus, in these experiments, bubble activity observable by increased echo brightness did not consistently cause subharmonic or broadband acoustic emissions. Although low-frequency emissions and echo brightness both increase at high temperatures, the largest low-frequency emissions (> 15 dB above background) did not coincide with high MGSV. This discrepancy suggests that echo brightness within portions of the ROI can be significantly reduced by acoustic shadowing, caused by widespread tissue or water vaporization at high temperatures (Makin et al. 2005; Mast et al. 2005).
DISCUSSION
The measurements reported here provide insight on bubble activity detected acoustically during ultrasound ablation performed with unfocused, high-intensity beams. Since the passive cavitation detector employed has a similarly unfocused sensitivity pattern, the acoustic emissions recorded emanated from a fairly broad region, as depicted in Fig. 1b. This configuration has several pertinent advantages, including sensitive emission detection due to spatial integration as well as insensitivity to small misalignments and localized artifacts. Since the recorded acoustic emissions are caused by cavitation activity throughout the significantly heated tissue volume, this approach also provides a useful measure of overall bubble activity in the treated tissue. However, this experimental configuration provides no detailed information on the precise spatial location of the cavitation events detected. Thus, received acoustic emissions detected at a given instant may contain components caused by bubble activity in multiple tissue regions subject to different temperatures and acoustic pressures.
In contrast to the broad spatial region sampled by the passive cavitation detector, temperature measurements were obtained only at a single point near the thermocouple tip. Because the unfocused beam emitted by the image-ablate ultrasound array results in a broad heating pattern with relatively low temperature gradients (Mast et al. 2005), this single temperature measurement provides an estimate of tissue temperature for points near the center of the heated volume, and also can be regarded as an indicator for the overall progress of each ablation treatment. However, this local temperature measurement does not correspond to the local tissue temperature at the originating sites of all detectable acoustic emissions. In particular, after the onset of tissue boiling, the tissue heating pattern is complicated by acoustic shadowing from large vapor bubbles, which can reduce the tissue heating occurring at the thermocouple tip. Such acoustic shadowing may also attenuate the propagation of high-frequency acoustic emissions.
For these reasons, the reported correlations between acoustic emissions and tissue temperature show the dependence of overall detectable bubble activity on overall tissue heating in these ablation experiments, but do not test the precise correspondence between local temperature and bubble activity at any single spatial point. Thus, it is possible that acoustic emissions detected with higher spatial resolution would show stronger correlations with local tissue temperature or backscatter. Resolution of this issue will require further study of passive cavitation detection in tissue with higher spatial resolution.
Another limitation of the experiments reported here was the use of fresh ex vivo tissue, which may be expected to have different properties compared to living tissue. In particular, living tissue should contain smaller amounts of free gas prior to sonication, so that initial cavitation levels may be smaller in vivo. Perfusion effects will also vary the initial heating rate, leading to differences in treatment effects between in vivo and in vitro ablation procedures (Mast et al. 2005). However, once tissue temperature is raised 10°C or more by the sonication, differences between ex vivo tissue and heated, non-viable in vivo tissue, including both free gas and perfusion characteristics, should be much less. After coagulative necrosis, tissue should also behave similarly with respect to ultrasound-induced bubble activity, both in vivo and in vitro. Thus, for in vivo ablation, it is possible that acoustic emissions will be correlated more highly with ablation effects and tissue temperature than in the experiments reported here, particularly if bubble activity is detected with higher spatial resolution.
The low-frequency emissions observed here are known to be associated with vaporization and boiling for ultrasound ablation at 3.5 MHz, comparable to the sonication frequency employed here (Anand et al. 2004; Khokhlova et al. 2006). However, physical mechanisms for the bubble activity causing measurable high-frequency acoustic emissions are not yet fully understood. One characteristic of all the present experiments was measurable broadband emissions that were roughly proportional to the sonication amplitude (Fig. 4b) and significantly correlated with the simultaneously measured temperature (r = 0.419). These broadband emissions were relatively long-lived over significant fractions of the treatment duration, except for distinct transitions presumably caused by phase changes such as tissue coagulation and boiling. One possible physical scenario consistent with such broadband emissions is the process of widespread, continual bubble seeding and growth by rectified diffusion (Crum and Hansen 1982) until inertial collapse. Based on computations by Church (1988) for air bubbles in water, the peak-negative pressure threshold for rectified diffusion is less than 0.7 MPa for 3 MHz sonication and initial bubble radii of radius 0.1–2 μm, with much lower thresholds near the bubble resonant size of about 1 μm, and only weak dependence on gas concentration. Thus, the pressure levels employed here were likely all sufficient for widespread rectified diffusion leading to inertial collapse events.
Stable, non-inertial cavitation with enduring subharmonic emissions was observed rarely in these experiments except under special conditions, including the 47–49°C temperature range for the 0.8 MPa sonication amplitude. These subharmonic emissions may be caused by shape oscillations of gas or vapor bubbles generated at specific favorable temperatures or tissue conditions. Under most conditions within these experiments, it appears that any pre-existing bubbles of resonant size were destroyed by the continuous-wave sound fields, except under special circumstances.
Both of these observations, persistent broadband emissions and short-lived subharmonic emissions, are consistent with typical acoustic emissions during stable cavitation, as defined by Neppiras (1980). Neppiras (1980) also states that persistent broadband emissions in this cavitation regime can contain distinct spectral lines unrelated to sonication frequency, possibly associated with resonance frequencies of predominant bubble sizes. Such spectral lines were also observed here, seen as multiple narrow ridges in time-frequency surface plots of emission spectra (Fig. 3) for all three sonication amplitudes.
These observations on bubble activity during the present ultrasound ablation experiments can be compared with observations drawn from several recent studies employing passive cavitation detection (Madanshetty et al. 1991) during HIFU exposures at higher sonication amplitudes. Consistent with a number of other experiments is the sudden onset of increased low-frequency emissions and echo brightness at temperature thresholds suggesting tissue boiling (Khokhlova et al. 2006, McLaughlan et al. 2006). Both of these effects are likely due to large vapor bubbles, which act as ultrasound reflectors and undergo violent low-frequency oscillation.
Observations of high-frequency emissions are less consistent in previous experiments. Some HIFU studies have observed a large increase in subharmonic and broadband emissions simultaneous to, or slightly preceding apparent vaporization (Bailey et al. 2003; Rabkin et al. 2005, 2006), while others have also observed significant high-frequency acoustic emissions, indicating cavitation, in the absence of tissue boiling (Khokhlova et al. 2006; McLaughlan et al. 2006). A possible explanation for this apparent inconsistency is the strong dependence of acoustic emissions on the sonication amplitude, as seen here for the subharmonic emissions depicted in Fig. 8a. In the present experiments, strong subharmonic emissions were seen only within distinct measured temperature ranges, but those ranges were different for each of the sonication amplitudes employed. This behavior may also depend on the sonication frequency. Another reason for strong dependence of acoustic emissions on sonication characteristics are strongly nonlinear effects that can occur in high-intensity focused ultrasound beams (Bailey et al. 2003; Khokhlova et al. 2006). Thus, although high-frequency, cavitational acoustic emissions may show a consistent relationship with tissue temperature for a particular ultrasound ablation scenario, such relationships may not be applicable if the sonication amplitude or other acoustic conditions are significantly modified.
In the experiments reported here, B-scan echo brightness was typically observed to increase with increasing treatment time throughout an ablation experiment. Among the measured temporal variables (N = 6179), the highest observed correlation coefficient was between tissue echogenicity and the simultaneously measured temperature (r = 0.455). Correlations between tissue echogenicity and simultaneous acoustic emissions were weaker, with r = 0.218 for low-frequency emissions, r = 0.123 for subharmonic emissions, and r < 0.01 (statistically insignificant) for broadband emissions. Although the largest observed increases in echo brightness occurred at high tissue temperatures suggesting vaporization and boiling, tissue or water vaporization also causes acoustic shadowing that can reduce echo brightness in portions of the ROI analyzed. As seen in Fig. 9a, significant increases of tissue echogenicity also occurred at lower measured temperature elevations, particularly for the lowest sonication amplitude employed. This observation is consistent with those of Khokhlova et al. (2006), who observed gradual increases in echo brightness as temperature increased in HIFU exposures of a polyacrylamide/gel phantom, even in the absence of passively-detected cavitation. Such increases in tissue echogenicity may be due to bubbles liberated by the decreasing solubility of gas in tissue with increasing temperature.
For the bulk ultrasound ablation experiments reported here, relationships between simultaneously measured acoustic emissions, tissue echogenicity, and temperature are illustrated by Figs. 8 and 9 as well as Table 2. Use of such relationships for ablation monitoring and control may be possible, as indicated by preliminary models predicting local tissue temperature based on measured acoustic emissions and tissue echogenicity (Salgaonkar et al. 2007). However, effective exploitation of these relationships for therapy guidance will require further study to clarify the interrelated effect of sonication parameters and tissue temperature on stable cavitation.
CONCLUSIONS
Measurements of acoustic emissions, temperature, and tissue echogenicity have allowed the role of detectable bubble activity to be assessed for a series of in vitro bulk ultrasound ablation experiments at 3.1 MHz. For the exposure and measurement conditions studied, broadband emissions increased with the acoustic pressure amplitude and ablation rate, while low-frequency emissions were strongly associated with vaporization and boiling. Detectable subharmonic emissions, suggesting stable cavitation, were not straightforwardly related to tissue temperature or ablation efficacy. However, increased subharmonic emissions were observed to coincide temporally with specific ranges of thermocouple-measured temperatures, dependent on sonication conditions.
These results suggest that broadband and low-frequency emissions from tissue, together with tissue echogenicity and other image-based measurements, may be useful for noninvasive monitoring and control of energy delivery and tissue state during ultrasound ablation treatments. Subharmonic emissions may also provide useful information for treatment guidance, possibly including indications of local tissue temperature. However, exploitation of this information will require further elucidation of cavitation behavior in heated tissue, as well as measurement of local cavitation activity with higher spatial resolution.
Acknowledgments
This work was supported by the Department of Biomedical Engineering, University of Cincinnati, and by National Institutes of Health, grants number R01-NS047603 and R43-CA124283.
Footnotes
Publisher's Disclaimer: This is a PDF file of an unedited manuscript that has been accepted for publication. As a service to our customers we are providing this early version of the manuscript. The manuscript will undergo copyediting, typesetting, and review of the resulting proof before it is published in its final citable form. Please note that during the production process errors may be discovered which could affect the content, and all legal disclaimers that apply to the journal pertain.
References
- Anand A, Byrd L, Kaczkowski PJ. In situ thermal parameter estimation for HIFU therapy planning and treatment monitoring. Proc. IEEE Ultrasonics Symposium; 2004. pp. 137–140. [Google Scholar]
- Bailey MR, Khokhlova VA, Sapozhnikov OA, Kargl SG, Crum LA. Physical mechanisms of the therapeutic effect of ultrasound (a review) Acoust Phys. 2003;49:369–388. [Google Scholar]
- Barthe PG, Slayton MH, Jaeger PM, Makin IRS, Mast TD, Faidi W, Runk MM, Gallagher LA. Ultrasound therapy system and ablation results utilizing miniature imaging/therapy arrays. Proc. IEEE Ultrasonics Symposium; 2004. pp. 1792–1795. [Google Scholar]
- Bartlett MS. Periodogram analysis and continuous spectra. Biometrika. 1950;37:1–16. [PubMed] [Google Scholar]
- Chavrier F, Chapelon JY, Gelet A, Cathignol D. Modeling of high-intensity focused ultrasound-induced lesions in the presence of cavitation bubbles. J Acoust Soc Am. 2000;108:432–440. doi: 10.1121/1.429476. [DOI] [PubMed] [Google Scholar]
- Chen WS, Lafon C, Matula TJ, Vaezy S, Crum LA. Mechanisms of lesion formation in high intensity focused ultrasound therapy. Acoust Res Lett Online. 2003;4:41–46. [Google Scholar]
- Chopra R, Luginbuhl C, Weymouth AJ, Foster FS, Bronskill MJ. Interstitial ultrasound heating applicator for MR-guided thermal therapy. Phys Med Biol. 2001;46:3133–3145. doi: 10.1088/0031-9155/46/12/305. [DOI] [PubMed] [Google Scholar]
- Church CC. Prediction of rectified diffusion during nonlinear bubble pulsations at biomedical frequencies. J Acoust Soc Am. 1988;83:2210–2217. doi: 10.1121/1.396349. [DOI] [PubMed] [Google Scholar]
- Coussios CC, Collin JRT, Muckle AP. Noninvasive monitoring and control of inertial cavitation dynamics during HIFU exposure in vitro. American Institute of Physics Conference Proceedings; 6th International Symposium on Therapeutic Ultrasound; Oxford, UK. 2006. pp. 164–170. [Google Scholar]
- Crum LA, Hansen GM. Growth of air bubbles in tissue by rectified diffusion. Phys Med Biol. 1982;27:413–417. doi: 10.1088/0031-9155/27/3/008. [DOI] [PubMed] [Google Scholar]
- Datta S, Coussios CC, McAdory LE, Tan J, Porter T, De Courten-Myers G, Holland CK. Correlation of cavitation with ultrasound enhancement of thrombolysis. Ultrasound Med Biol. 2006;32:1257–1267. doi: 10.1016/j.ultrasmedbio.2006.04.008. [DOI] [PMC free article] [PubMed] [Google Scholar]
- Diederich CJ, Nau WH, Stauffer PR. Ultrasound applicators for interstitial thermal coagulation. IEEE Trans Ultras, Ferroelect, Freq Contr. 1999;46:1218–1228. doi: 10.1109/58.796127. [DOI] [PubMed] [Google Scholar]
- Edmonds PD, Ross P. Acoustic emission as a measure of exposure of suspended cells in vitro. Ultrasound Med. Biol. 1986;12:297–305. doi: 10.1016/0301-5629(86)90339-x. [DOI] [PubMed] [Google Scholar]
- Farny CH, Holt RG, Roy RA. Monitoring the development of HIFU-induced cavitation activity. American Institute of Physics Conference Proceedings; 5th International Symposium on Therapeutic Ultrasound; Boston, MA. 2005. pp. 348–352. [Google Scholar]
- Freedman A. Sound field of a rectangular piston. J Acoust Soc Am. 1960;32:197–209. [Google Scholar]
- Fry FJ. Ultrasound and microbubbles: their generation, detection, potential utilization in tissue and organ therapy–experimental. Ultrasound Med Biol. 1995;21:1227–1237. doi: 10.1016/0301-5629(96)89519-6. [DOI] [PubMed] [Google Scholar]
- Giesecke T, Hynynen K. Ultrasound-mediated cavitation thresholds of liquid perfluorocarbon droplets in vitro. Ultrasound Med. Biol. 2003;29:1359–1365. doi: 10.1016/s0301-5629(03)00980-3. [DOI] [PubMed] [Google Scholar]
- Hallow DM, Mahajan AD, McCutchen TE, Prausnitz MR. Measurement and correlation of acoustic cavitation with cellular bioeffects. Ultrasound Med Biol. 2006;32:1111–1122. doi: 10.1016/j.ultrasmedbio.2006.03.008. [DOI] [PubMed] [Google Scholar]
- Hilgenfeldt S, Lohse D, Zomack M. Sound scattering and localized heat deposition of pulse-driven microbubbles. J Acoust Soc Am. 2000;107:3530–3539. doi: 10.1121/1.429438. [DOI] [PubMed] [Google Scholar]
- Holt RG, Roy RA. Measurements of bubble-enhanced heating from focused, MHz-frequency ultrasound in a tissue-mimicking material. Ultrasound Med Biol. 2001;27:1399–1412. doi: 10.1016/s0301-5629(01)00438-0. [DOI] [PubMed] [Google Scholar]
- Hynynen K, Edwards DK. Temperature measurements during ultrasound hyperthermia. Med Phys. 1989;16:618–626. doi: 10.1118/1.596364. [DOI] [PubMed] [Google Scholar]
- Hynynen K. The threshold for thermally significant cavitation in dog’s thigh muscle in vivo. Ultrasound Med. Biol. 1991;17:157–169. doi: 10.1016/0301-5629(91)90123-e. [DOI] [PubMed] [Google Scholar]
- Kaneko Y, Maruyama T, Takegami K, Mitsui H, Hanajiri K, Nagawa H, Matsumoto Y. Use of a microbubble agent to increase the effects of high intensity focused ultrasound on liver tissue. Eur Radiol. 2005;15:1415–1420. doi: 10.1007/s00330-005-2663-7. [DOI] [PubMed] [Google Scholar]
- Khokhlova VA, Bailey MR, Reed JA, Cunitz BW, Kaczkowski PJ, Crum LA. Effects of nonlinear propagation, cavitation, boiling in lesion formation by high intensity focused ultrasound in a gel phantom. J Acoust Soc Am. 2006;119:1834–1848. doi: 10.1121/1.2161440. [DOI] [PubMed] [Google Scholar]
- Leighton TG. The Acoustic Bubble. ch 4 San Diego: Academic Press; 1994. [Google Scholar]
- Madanshetty SI, Roy RA, Apfel RE. Acoustic microcavitation: its active and passive acoustic detection. J Acoust Soc Am. 1991;90:1515–1526. doi: 10.1121/1.401891. [DOI] [PubMed] [Google Scholar]
- Makin IRS, Mast TD, Faidi W, Runk MM, Barthe PG, Slayton MH. Miniaturized ultrasound arrays for interstitial ablation and imaging. Ultras Med Biol. 2005;31:1539–1550. doi: 10.1016/j.ultrasmedbio.2005.07.008. [DOI] [PubMed] [Google Scholar]
- Mast TD, Makin IRS, Faidi W, Runk MM, Barthe PG, Slayton MH. Bulk ablation of soft tissue with intense ultrasound: modeling and experiments. J Acoust Soc Am. 2005;118:2715–2724. doi: 10.1121/1.2011157. [DOI] [PubMed] [Google Scholar]
- Mast TD, Yu F. Simplified expansions for radiation from a baffled circular piston. J Acoust Soc Am. 2005;118:3457–3464. [Google Scholar]
- Mast TD. Fresnel approximations for ultrasonic fields of rectangularly symmetric sources. J Acoust Soc Am. 2006;121:3311–3322. doi: 10.1121/1.2726252. [DOI] [PubMed] [Google Scholar]
- McLaughlan J, Rivens I, ter Haar G. A study of cavitation activity in ex vivo tissue exposed to high intensity focused ultrasound. American Institute of Physics Conference Proceedings; 6th International Symposium on Therapeutic Ultrasound; Oxford, UK. 2006. pp. 178–184. [Google Scholar]
- Melodelima D, Chapelon JY, Theillère Y, Cathignol D. Combination of thermal and cavitation effects to generate deep lesions with an endocavitary applicator using a plane transducer: ex vivo studies. Ultrasound Med. Biol. 2001;30:103–111. doi: 10.1016/j.ultrasmedbio.2003.09.005. [DOI] [PubMed] [Google Scholar]
- Osborne MFM, Holland FH. The acoustical concomitants of cavitation and boiling, produced by a hot wire. J Acoust Soc Am. 1947;19:13–29. [Google Scholar]
- Prat F, Lafon C, de Lima DM, Theilliere Y, Fritsch J, Pelletier G, Buffet C, Cathignol D. Endoscopic treatment of cholangiocarcinoma and carcinoma of the duodenal papilla by intraductal high-intensity US: Results of a pilot study. Gastrointest Endosc. 2002;56:909–915. doi: 10.1067/mge.2002.129872. [DOI] [PubMed] [Google Scholar]
- Rabkin BA, Zderic V, Vaezy S. Hyperecho in ultrasound images of HIFU therapy: involvement of cavitation. Ultrasound Med Biol. 2005;31:947–956. doi: 10.1016/j.ultrasmedbio.2005.03.015. [DOI] [PubMed] [Google Scholar]
- Rabkin BA, Zderic V, Crum LA, Vaezy S. Biological and physical mechanisms of HIFU-induced hyperecho in ultrasound images. Ultrasound Med Biol. 2006:1721–1729. doi: 10.1016/j.ultrasmedbio.2006.04.010. [DOI] [PubMed] [Google Scholar]
- Salgaonkar VA, Karunakaran CP, Besse JA, Heinlein G, Datta S, Holland CK, Mast TD. Image-guidedex vivo liver ablation by unfocused ultrasound using passive cavitation detection. Proc SPIE. 2007;6440:Q1–Q10. [Google Scholar]
- Sanghvi NT, Fry FJ, Bihrle R, Foster RS, Phillips MH, Syrus J, Zaitsev A, Hennige C. Microbubbles during tissue treatment using high intensity focused ultrasound. Proc. IEEE Ultrasonics Symposium; 1995. pp. 1571–1574. [Google Scholar]
- Sokka SD, King R, Hynynen K. MRI-guided gas bubble enhanced ultrasound heating in in vivo rabbit thigh. Phys. Med. Biol. 2003;48:223–241. doi: 10.1088/0031-9155/48/2/306. [DOI] [PubMed] [Google Scholar]
- ter Haar GR, Daniels S. Evidence for ultrasonically induced cavitation in vivo. Phys. Med. Biol. 1981;26:1145–1149. doi: 10.1088/0031-9155/26/6/013. [DOI] [PubMed] [Google Scholar]
- Thomas CR, Farny CH, Coussios CC, Roy RA, Holt RG. Dynamics and control of cavitation during high-intensity focused ultrasound application. Acoust Res Lett Online. 2005;6:182–187. [Google Scholar]
- Thomsen SL. Mapping of thermal injury in biologic tissues using quantitative pathologic techniques. Proc SPIE. 1999;3594:82–95. [Google Scholar]
- Umemura S, Kawabata K, Sasaki K. In vivo acceleration of ultrasonic tissue heating by microbubble agent. IEEE Trans. Ultrason., Ferroelectr., Freq. Contr. 2005;52:1690–1698. doi: 10.1109/tuffc.2005.1561623. [DOI] [PubMed] [Google Scholar]
- Warwick R, Pond J. Trackless lesions in nervous tissues produced by high intensity focused ultrasound (high-frequency mechanical waves) J Anat. 1968;102:387–405. [PMC free article] [PubMed] [Google Scholar]
- Watkin NA, ter Haar GR, Rivens I. The intensity dependence of the site of maximal energy deposition in focused ultrasound surgery. Ultras Med Biol. 1996;22:483–491. doi: 10.1016/0301-5629(95)02062-4. [DOI] [PubMed] [Google Scholar]
- Yang X, Church CC. Nonlinear dynamics of gas bubbles in viscoelastic media. Acoust Res Lett Online. 2005;6:151–156. [Google Scholar]
- Yang X, Roy RA, Holt RG. Bubble dynamics and size distributions during focused ultrasound insonation. J Acoust Soc Am. 2004;116:3423–3431. doi: 10.1121/1.1823251. [DOI] [PubMed] [Google Scholar]
- Ying SP, Knight ME, Scott CC. Background noise for acoustic emission in boiling water and a pressurized water nuclear-power reactor. J Acoust Soc Am. 1973;53:1627–1631. [Google Scholar]