Abstract
Mechanisms of B cell tolerance act during development in the bone marrow and periphery to eliminate or restrict autoreactive clones to prevent autoimmune disease. B cells in the spleens of mice that harbor anti-insulin BCR transgenes (125Tg) are maintained in a functionally silenced or anergic state by endogenous hormone, but it is not clear when and where anergy is induced. An in vitro bone marrow culture system was therefore used to probe whether small protein hormones, a critical class of autoantigens, could interact with the BCR to induce anergy early during B cell development. Upon exposure to insulin, anti-insulin (125Tg) immature B cells show similar hallmarks of anergy as those observed in mature splenic B cells. These include BCR down-regulation, impaired proliferative responses to anti-CD40, and diminished calcium mobilization upon stimulation with BCR-dependent and independent stimuli. Inhibition of calcineurin also results in reduced immature B cell proliferation in a similar manner, suggesting a potential mechanism through which reduced intracellular calcium mobilization may be altering cellular proliferation. Signs of impairment appear after short-term exposure to insulin, which are reversible upon Ag withdrawal. This suggests that a high degree of functional plasticity is maintained at this stage and that constant Ag engagement is required to maintain functional inactivation. These findings indicate that tolerance observed in mature, splenic 125Tg B cells is initiated by insulin in the developing B cell compartment and thus highlight an important therapeutic window for the prevention of insulin autoimmunity.
Preservation of tolerance in developing and mature B cell compartments is critical for the prevention of autoimmune disease. B cells that escape tolerance can generate pathogenic Abs to play a direct autoaggressive role, such as in systemic lupus erythematosus. They have additionally been shown to indirectly mediate disease, such as in type I diabetes mellitus, in which they likely present autoantigens to autoaggressive T cells (1). Multiple routes therefore exist through which breaches in B cell tolerance can result in autoimmune disease. B cell tolerance is maintained by the mechanisms of anergy, receptor editing, and deletion (2–7). Among these, anergy is known to function in the periphery to silence B cells that recognize soluble protein from actively participating in immune responses (8–10). Anergic B cells are functionally unresponsive to BCR stimulation, show impaired proliferation, compete poorly for follicular entry, have a reduced life span in the periphery, and fail to differentiate into Ab-secreting plasma cells (11). Anergy is a reversible form of tolerance that must be actively maintained by Ag availability (12, 13).
B cells in mice that harbor anti-insulin transgenes (125Tg) recognize endogenously circulating insulin and are rendered anergic in the periphery; thus, an Ag that interacts with the BCR with moderate affinity (8 × 10⁶ M–1) and possesses limited BCR cross-linking potential is capable of eliciting tolerance (10, 14). This form of anergy is characterized by impaired Ca2+ mobilization upon stimulation and is accompanied by diminished basal NFATc1 levels and defective NFATc1 translocation to the nucleus (15). Mature, anergic anti-insulin B cells show diminished proliferative responses to anti-IgM, anti-CD40, and LPS stimulation, produce little circulating Ab, and do not respond to T cell-dependent immunization (10, 16). Isolation of naive 125Tg cells is not possible in this model, as ablation of endogenous insulin would rapidly result in animal morbidity and mortality, due to the essential nature of the hormone. This considerable roadblock to the dissection of insulin-induced B cell tolerance can be overcome using an IL-7-driven in vitro culture system (17–19). Accordingly, this culture system was used to identify the developmental ontogeny of anergy in anti-insulin B cells and to directly dissect how Ag (insulin) governs tolerance in immature B cells.
Although many studies have mechanistically addressed how the anergic state exists in mature B cells, the induction of anergy in immature B cells has not been as well characterized. Previous studies in the Ars/A1 model show that autoreactive immature B cells maintain elevated basal levels of intracellular calcium and impaired calcium mobilization upon anti-IgM stimulation (20). Whether and how such changes may alter downstream functions of autoreactive immature B cells are unknown, and the mechanism through which anergy is established in immature B cells has not been addressed. Unlike mature B cells, immature B cell engagement with Ag stimulates tolerance rather than proliferation (21, 22). To identify whether a small protein hormone can induce anergy in immature B cells and to further characterize the extent and nature of unresponsiveness, the phenotype and function of immature 125Tg B cells cultured with insulin were assessed.
We show that in vitro-derived anti-insulin immature B cells are naive and flux Ca2+ following acute stimulation with insulin, anti-IgM, and ionomycin and confirm that they proliferate upon anti-CD40 stimulation. These responses are reduced in immature B cells that chronically engage insulin in vitro, suggesting that they acquire many hallmarks of the anergic phenotype observed for mature B cells. Similar to chronic insulin encounter, inhibition of calcineurin reduces the proliferation of 125Tg immature B cells, highlighting a potential mechanism through which the observed changes in intracellular Ca2+ mobilization may be negatively regulating cell cycle progression. These data suggest that anergic programming is initiated when developing B cells encounter insulin and is dynamically regulated by Ag availability. Insulin-reactive B cells are therefore precariously positioned to escape tolerance during physiological fluctuations of insulin and facilitate the development of autoimmunity. These studies highlight key aspects of developing B cell tolerance which must be considered to understand and prevent insulin autoimmunity.
Materials and Methods
Animals
The Ig-transgenic mice used in this study harbor non-targeted anti-insulin transgenes (125Tg) or anti-hen egg lysozyme (HEL)3 transgenes, IgHELMD4 on C57BL/6 backgrounds as described previously (backcrossed >20 generations to C57BL/6) (10, 23). IgHELMD4 (IgHELMD4Tg) mice were purchased from The Jackson Laboratory. All mice were housed under specific pathogen-free conditions, and all studies were approved by the Institutional Animal Care and Use Committee of Vanderbilt University.
Cell culture
Bone marrow was eluted from the long bones of 4- to 6-wk-old animals with HBSS (Invitrogen Life Technologies) plus 10% FBS (HyClone). RBCs were lysed and cells were resuspended at 2 × 10⁶ cells/ml in complete bone marrow culture medium (DMEM plus 10% FBS (HyClone) plus l-glutamine plus HEPES buffer plus MEM sodium pyruvate plus gentamicin plus 2 × 10⁻⁵ M 2-ME (Invitrogen)) plus 20% J558L supernatant-derived IL-7 (IL-7-expressing J558L cell line provided by J. Cambier, National Jewish Medical and Research Center, Denver, CO) or 15 ng/ml human rIL-7 (PeproTech) and cultured for 5 days in a 37°C CO2 incubator. FBS contains fg/ml amounts of insulin, which is below the threshold necessary to induce any B cell responsiveness (125Tg included) in all assays tested. To remove IL-7 and promote differentiation, 5-day cultures were washed three times with HBSS plus 10% FBS and resuspended at 2 × 10⁶ cells/ml in complete bone marrow culture medium without IL-7 and were cultured with or without cognate Ag (human insulin; Sigma-Aldrich catalog no. I2643) or HEL (Sigma-Aldrich)) for 1–3 days (see Fig. 2 assay schematic).
FIGURE 2.
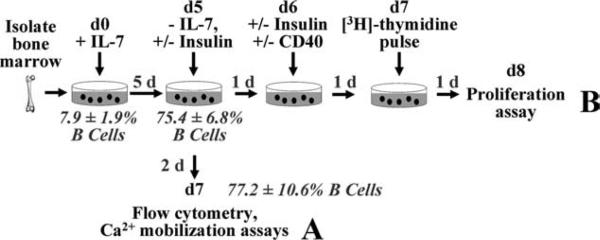
Schematic of IL-7-driven culture system and experimental design. Freshly isolated bone marrow is cultured with IL-7 for 5 days. IL-7 is then withdrawn and (A) cells differentiate for an additional 2 days in the absence or presence of Ag, followed by flow cytometry analysis or Ca2+ mobilization assays. B, Alternatively, cells differentiate with or without insulin for 1 day and are then stimulated with anti-CD40 with or without human insulin for 2 days ([3H]thymidine pulsed for last day), and [3H]thymidine incorporation (cpm) is measured.
Bone marrow proliferation assay
Bone marrow cells were harvested and grown in bone marrow culture medium with IL-7 for 5 days as described above. Upon IL-7 removal, 0, 500, or 5 × 10⁴ ng/ml human insulin (Sigma-Aldrich) was added to the culture. After 1 day, cells were recounted and plated at 2 × 10⁻⁵ cells/well in 96-well, flat-bottom plates (Corning) with the indicated concentrations of insulin and anti-CD40 (HM40-3; BD Pharmingen) “stimulation” in the absence (unless otherwise noted) or presence of 1 μg/ml cyclosporin A (Alexis Biochemicals). In preliminary studies, 0.5 μg/ml anti-CD40 induced maximal immature B cell proliferation. After 1 day, wells were pulsed with 1 μCi of [3H]thymidine (NEN) and grown for 1 day, at which point wells were harvested using a semiautomated cell harvester (Skatron). [3H]Thymidine uptake was measured by scintillation counting after stimulation. Results are reported as the mean ± SD for the average of triplicate determinations for each of the number of animals indicated.
Ca2+ mobilization assay
Bone marrow B cells derived from the in vitro IL-7 culture system described above or MACS-purified CD43-depleted splenic B cells from non-Tg, IgHELMD4Tg, and 125Tg mice were suspended in HBSS (Invitrogen). Changes in intracellular Ca2+ were measured by determining changes in the ratio of bound/free fura 2-AM fluorescence intensities, a cell-per-meant, Ca2+-sensitive ratiometric dye (Molecular Probes) as previously described (15). Spleen B cells were labeled as previously described (15) and bone marrow B cells were loaded with 5 μM fura 2-AM (Molecular Probes) for 15 min at 37°C. Basal readings were taken for 45 s before stimulation. Cells were stimulated with the indicated concentrations of anti-IgM (F(ab′)2 goat anti-mouse μ-chain (Jackson ImmunoResearch Laboratories)), ionomycin (Sigma-Aldrich), human insulin (Sigma-Aldrich), or HEL (Sigma-Aldrich) at 37°C. Images were collected and the average fluorescence measurements of 30 cells were determined using Metamorph software, or 2 × 10⁵ cells were plated per well and a FlexStation II fluorometer (Molecular Devices) was used to measure triplicate wells. Measurements were taken at either 2- or 5-s intervals over a 5-min period. During this time, cells maintained healthy morphology.
Flow cytometry and Abs
Bone marrow cells were washed in 1× PBS containing 5% FBS, 0.02% EDTA, and 0.1% sodium azide and stained with the indicated mAb. Ab reagents were reactive with B220 (6B2), IgMa (DS-1), IgMb (AF6-78), CD43 (S7), CD21 (7G6), CD23 (B3B4), AA4.1 (an immature/transitional B cell marker), or 7-aminoactinomycin D (BD Pharmingen). Streptavidin reagents (BD Pharmingen) were used to detect biotinylated reagents. Analysis was performed on a FACSCalibur or LSR II flow cytometer (BD Biosciences). WinMDI 2.8 software (Dr. J. Trotter, The Scripps Institute, San Diego, CA) was used for analysis.
Results
A homogenous population of immature anti-insulin B cells is generated using an IL-7-driven in vitro bone marrow culture system
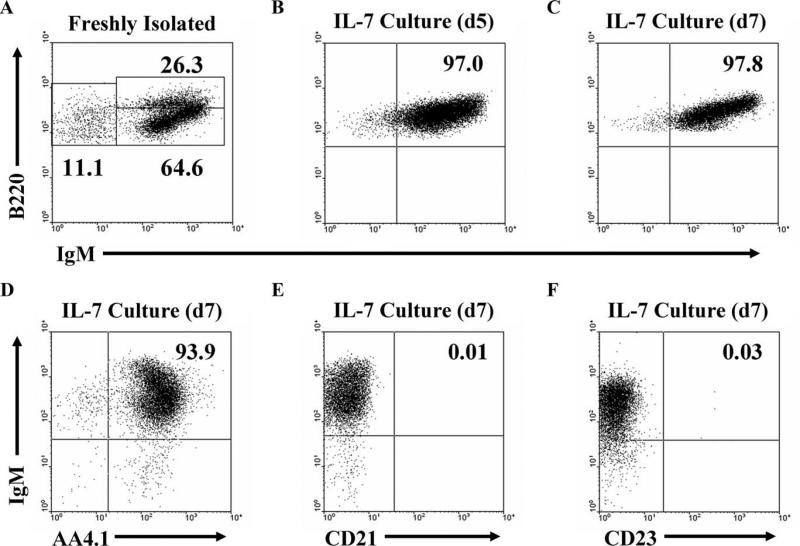
Pro-B cell proliferation is enhanced by culture with IL-7, while B cells that have differentiated beyond this IL-7-responsive stage die, leaving only Ag-naive B cells that subsequently differentiate to express surface BCR (17–19). 125Tg bone marrow cells were therefore cultured with IL-7 for a 5-day period, and B220 and IgM expression was assessed using flow cytometry after an additional 2-day IL-7 withdrawal period (Fig. 1). In freshly isolated bone marrow, 5–10% of the cells are B220+, which include various stages of B cell development (Fig. 1A). However, upon culture and subsequent IL-7 withdrawal, 70–80% of the cells recovered are B220+ and >90% of the B cells are IgMa+ (Fig. 1, B and C). B cells generated in vitro phenotypically resemble immature B cells, as they are AA4.1+, CD21–, and CD23– throughout the duration of the culture (Fig. 1. D–F). This culture system therefore generates Ag-naive immature B cells to permit investigation of how insulin modulates tolerance. Subsequent assays were performed using IL-7-generated immature B cells, as outlined in Fig. 2.
FIGURE 1.
Immature anti-insulin B cells are generated in vitro using an IL-7-driven bone marrow culture system. Flow cytometry on freshly isolated bone marrow (A) and after culture with IL-7 (B–F). Expression of B220, IgM, AA4.1, CD21, and CD23 are as shown for B220+ 7-aminoactinomycin D-negative gated cells on the day indicated. The IL-7-driven culture system used to generate naive 125Tg immature B cells is shown in the schematic in Fig. 2A. All data are representative of more than eight experiments. The average ± SD of B220+-gated cells is: A, pro- and pre- (B220+IgMa–): 14.7 ± 10.6%, immature (B220midIgMa+): 61.0 ± 10.2%, mature recirculating (B220highIgMa+): 24.4 ± 10.2%; B, B220+IgMa+: 95.3 ± 6.1; C, B220+IgMa+: 97.9 ± 1.2%; D, B220+AA4.1+: 91.3 ± 2.9%; E, B220+ CD21+: 0.03 ± 0.03%; and F, B220+CD23+: 0.20 ± 0.17%.
Immature anti-insulin B cells down-regulate BCR surface expression upon interaction with cognate Ag
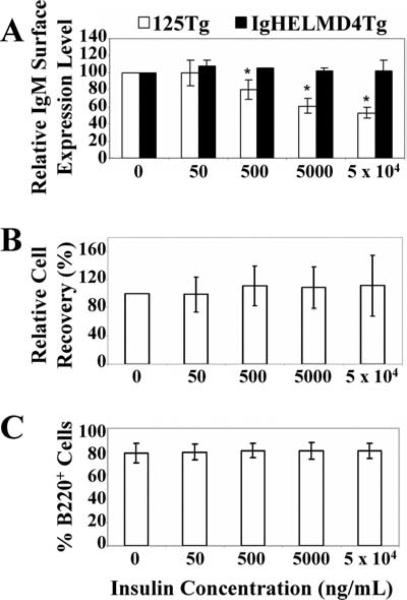
One hallmark of anergy in mature B cells is down-regulation of BCR surface expression (3). To identify whether anti-insulin 125Tg immature B cells (which are devoid of IgD) down-regulate the BCR upon encounter with insulin, immature 125Tg B cells were generated in vitro as in Fig. 2A. After culture, the relative level of IgM expression was measured using flow cytometry. Immature anti-insulin 125Tg B cells (□) show progressive down-regulation of surface BCR with increasing Ag concentration (Fig. 3A). This is BCR-specific, as anti-HEL “MD-4” (IgHELMD4Tg) immature B cells (Fig. 3A, ■) cultured with insulin show no decrease in surface IgM. A similar reduction in surface Ig is observed in anti-HEL immature B cells cultured with HEL (data not shown).
FIGURE 3.
Immature anti-insulin B cells down-regulate IgM surface expression upon insulin encounter in vitro and do not undergo clonal deletion. A, Flow cytometry to show IgM expression levels. The IgM mean fluorescence intensity of cells cultured in the absence of Ag was normalized to 100% and the relative IgM surface expression level was determined for cells cultured with human insulin (e.g., 50 ng/ml insulin IgM mean fluorescence intensity ÷ 0 ng/ml insulin IgM mean fluorescence intensity × 100% = relative IgM expression). The average of three (IgHELMD4Tg, ■) or 15 (125Tg, □) experiments is shown ± SD, *, p < 0.0005, as calculated by a two-tailed, expected mean, one-sample t test. B, Relative cell recovery in bone marrow culture was calculated to minimize experimental differences in IL-7 stimulatory potential by dividing the human insulin-cultured cell percent recovery by the percent recovery of cells cultured without insulin in the same experiment; percent recovery was calculated by dividing the end cell number by the input cell number. The average of 18 experiments ± SD is shown. C, Histograms showing percentages of B220+ cells present at the end of the culture assessed using flow cytometry. The average of 17 experiments ± SD is shown. Ag-naive immature B cells are generated as in Fig. 2A and cells are harvested after culture with 0–5 × 10⁴ ng/ml human insulin.
IgM surface down-regulation observed in 125Tg immature B cells cultured with insulin indicates that B cell tolerance may be induced by this small protein. In addition to anergy, receptor editing or clonal deletion are also potential tolerance outcomes (2–7). Neither the relative cell recovery nor the percentage of B cells present upon culture with insulin was altered (Fig. 3, B and C); thus, encounter even with high concentrations of insulin does not induce deletion, as occurs with BCR cross-linking by anti-IgM stimulation (data not shown). These findings demonstrate that the principal outcome of BCR engagement with insulin is to decrease surface BCR expression in 125Tg immature B cells, a phenotype typical of mature B cells that are rendered anergic.
Cognate Ag encounter impairs anti-CD40-induced proliferation of immature anti-insulin B cells
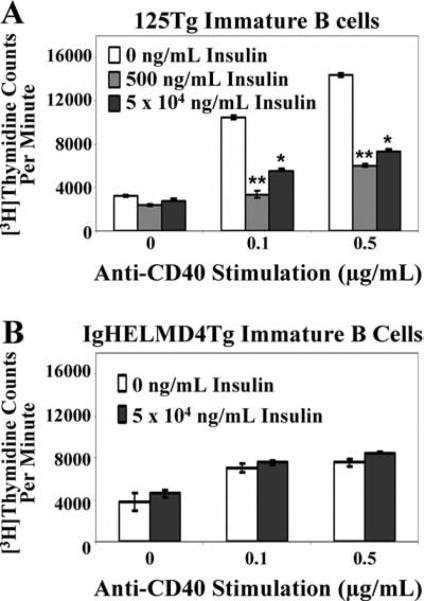
Anti-CD40 stimulation (which emulates T cell help) bypasses the BCR to induce immature and mature B cell proliferation (24), but this response is impaired when mature anti-insulin B cells are exposed to insulin in vivo (16). To identify whether a similar diminished responsiveness is evoked by Ag engagement of immature B cells, Ag-naive immature B cells were generated using IL-7 culture and were subsequently cultured for 1 day with or without insulin. Cells were then stimulated with anti-CD40 for an additional 2 days, during which the initial insulin concentration indicated remained present (Fig. 2B). As shown in Fig. 4, [3H]thymidine up-take indicated that proliferation of 125Tg, but not control IgHELMD4Tg immature B cells, was reduced ~2- to 3-fold upon stimulation with anti-CD40 in the presence of insulin. These data suggest that even low concentrations of insulin are capable of down-modulating immature B cell proliferation when compared with naive cells stimulated in the absence of cognate Ag. This interaction is BCR specific and independent of any hormonal effects, as the presence of even the highest dose of insulin does not alter IgHELMD4Tg immature B cell proliferative responses.
FIGURE 4.
Immature anti-insulin B cells chronically cultured with insulin in vitro show impaired proliferation to anti-CD40. Bone marrow culture-derived (Fig. 2B) 125Tg (A) or IgHELMD4Tg (B) B cells were naive (□) or cultured with human insulin (500 ng/ml,  , or 5 × 10⁴ ng/ml, ■) for 1 day, then stimulated with anti-CD40 (x-axis) with or without insulin indicated. [3H]Thymidine incorporation (cpm) was measured. The average ± SD of triplicate determinations of three animals is shown; *, p < 0.03 and **, p < 0.007, as calculated by a two-tailed, two-sample/unequal variance t test.
Calcium mobilization is impaired in immature B cells upon insulin encounter
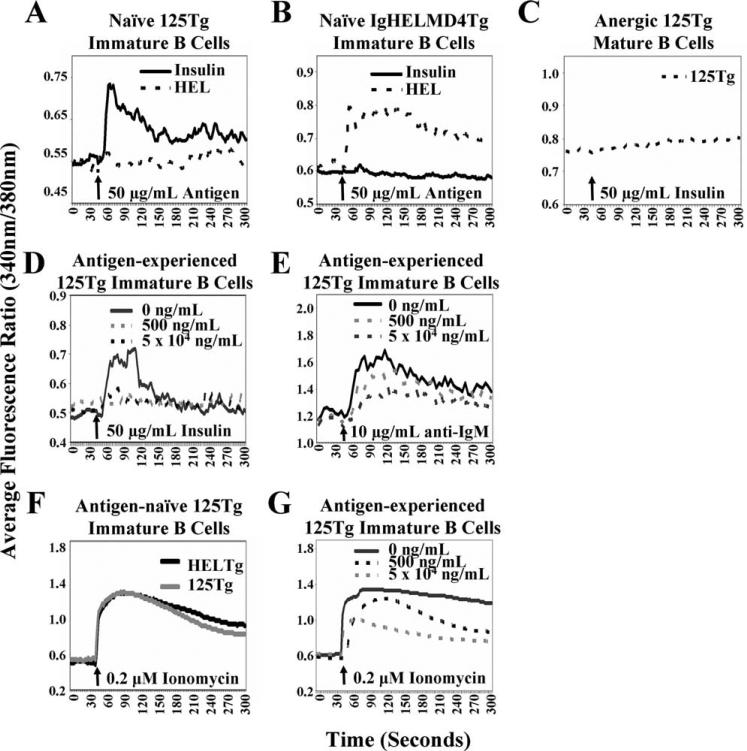
The intracellular Ca2+ concentration in a cell can be rapidly modulated to produce dynamic changes in a wide array of cellular processes, and altered Ca2+ homeostasis is associated with lymphocyte anergy (25). The 125Tg BCR interacts with insulin with a lower affinity and does not lead to substantial BCR cross-linking compared with other available transgenic models of B cell tolerance (14, 26). We therefore tested whether insulin could elicit a sufficiently strong signal to evoke Ca2+ flux by measuring Ca2+ mobilization. Ag-naive immature 125Tg B cells fluxed Ca2+ following acute insulin, but not HEL stimulation (Fig. 5A), and small responses have been observed with as little as 50 ng/ml insulin stimulation (data not shown). Naive IgHELMD4Tg immature B cells mobilized Ca2+ when stimulated with HEL as a positive control, but not insulin (Fig. 5B). These data suggest that a small protein hormone Ag can interact with the BCR to elicit changes in intracellular Ca2+ concentration and confirm that cells generated in vitro are naive.
FIGURE 5.
Calcium mobilization is impaired in anti-insulin immature B cells upon chronic insulin encounter. Intracellular Ca2+ mobilization was measured. Cells were loaded with fura 2-AM. Basal fluorescence readings were taken for 45 s; arrow indicates stimulation. 125Tg (A) or IgHELMD4Tg (B) naive immature B cells (Fig. 2A) were stimulated with human insulin (solid line) or HEL (dashed line). C, Mature, anergic 125Tg spleen cells were stimulated with human insulin. 125Tg naive immature B cells were cultured with or without human insulin (0 ng/ml, black solid line; 500 ng/ml, dashed gray line; 5 × 10⁴ ng/ml, dashed black line) for 1 day and stimulated with human insulin (D), anti-IgM (E), or ionomycin (G). F, 125Tg (gray line) or IgHELMD4Tg (black line) naive immature B cells were stimulated with ionomycin. Data are representative of three or more experiments.
The anergic phenotype observed in anti-insulin mature B cells includes an impaired ability to mobilize Ca2+ upon acute stimulation with ionomycin and suboptimal doses of anti-IgM (15). To determine whether a similar impairment in Ca2+ mobilization exists in immature B cells that have previously encountered insulin, Ag-naive immature 125Tg B cells were generated in vitro and were cultured with or without insulin (Fig. 2A). Cells were then acutely stimulated with insulin, anti-IgM, or ionomycin and intra-cellular Ca2+ mobilization was measured. Immature 125Tg B cells that have previously encountered insulin showed an impaired ability to mobilize Ca2+ upon acute stimulation with insulin (Fig. 5D) or anti-IgM (Fig. 5E), similar to what is observed in mature 125Tg spleen B cells (Fig. 5C and Ref. 15). As immature 125Tg B cells cultured with insulin down-regulate surface IgM, the impaired Ca2+ flux that is observed may be due to reduced BCR molecules available for Ag engagement. Ionomycin was thus used to bypass the BCR and to stimulate intracellular Ca2+ mobilization. 125Tg and control IgHELMD4Tg naive immature B cells produced a robust response of equivalent magnitude upon stimulation with ionomycin (Fig. 5F), which was diminished following culture with insulin (Fig. 5G). These findings suggest that immature B cells can be rendered unresponsive to BCR or ionomycin stimulation upon prior encounter with a small protein such as insulin, which has limited BCR cross-linking potential. This tolerant state mimics the state of altered intracellular Ca2+ homeostasis in mature tolerant anti-insulin B cells.
Calcineurin inhibition impairs immature B cell proliferation
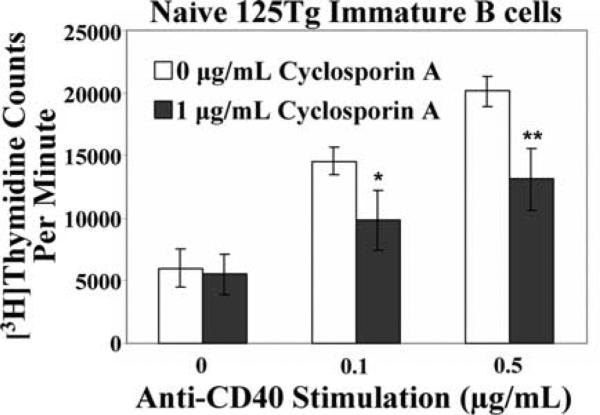
Elevation of intracellular Ca2+ levels leads to enhanced calcineurin activity in mature lymphocytes, which can result in many downstream biological changes, including cell proliferation (25). To probe whether calcineurin activity affects immature 125Tg B cell proliferation, [3H]thymidine uptake of immature B cells grown in the absence of insulin and stimulated with anti-CD40 was assayed (as in Fig. 2), in the presence or absence of cyclosporin A, a calcineurin inhibitor. As shown in Fig. 6, immature B cell proliferation to anti-CD40 stimulation was diminished in the presence of cyclosporin A. This impairment indicates that calcineurin is required for maximal immature B cell proliferation to anti-CD40. These findings suggest that calcineurin plays a role in 125Tg immature B cell proliferation to anti-CD40, and thus provide a potential mechanistic link between the diminished Ca2+ mobilization and impaired proliferation observed in 125Tg immature B cells which chronically engage insulin.
FIGURE 6.
Calcineurin inhibition impairs immature anti-insulin B cell proliferation to anti-CD40 stimulation. 125Tg immature B cells were cultured without insulin for 1 day, then stimulated with anti-CD40 (x-axis) in the absence (□) or presence of 1 μg/ml cyclosporin A (■). [3H]Thymidine incorporation (cpm) was measured after 2 days. The average of triplicate determinations of four animals ± SD is shown; *, p < 0.021 and **, p < 0.0048, as calculated by a two-tailed, two-sample/unequal variance t test. Immature B cells were generated as in Fig. 2B.
Extended exposure of 125Tg immature B cells to insulin is not required to observe IgM down-regulation, impaired calcium mobilization, or diminished proliferation
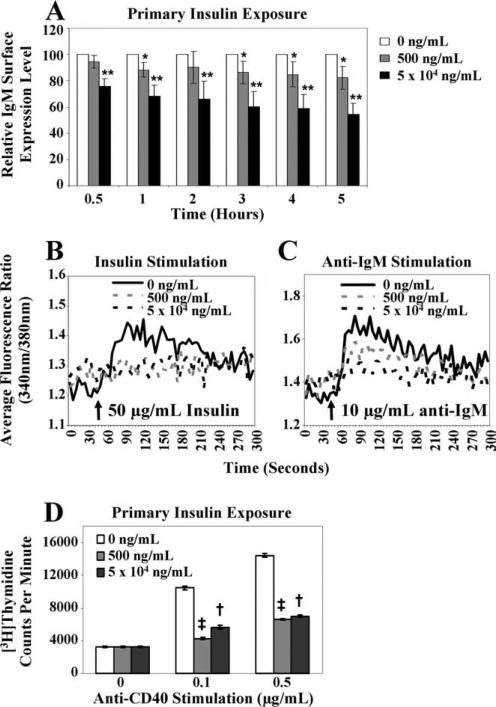
In the previous experiments, insulin (if added) was present continuously throughout the multiday culture period. To determine whether signs of tolerance were present after short-term culture with insulin, immature anti-insulin (125Tg) B cells were cultured for 0.5–5 h with or without insulin after IL-7 withdrawal and 1 day without insulin. Flow cytometry analysis indicated that IgM expression decreased after 0.5 h of culture with insulin, and continued to decrease with time ( and ■, Fig. 7A). 125Tg immature B cells also showed impaired Ca2+ mobilization upon acute insulin or anti-IgM stimulation following culture with insulin for 3 h (earlier time points were not assessed; Fig. 7, B and C). To test whether primary insulin coexposure with anti-CD40 stimulation is sufficient to impair proliferation, Ag-naive 125Tg immature B cells were cultured for 1 day in the absence of insulin (Fig. 2B). Anti-CD40 and insulin were then simultaneously added and the cells were cultured for an additional 2 days before measuring [3H]thymidine uptake. Proliferation was dampened in cells that had encountered insulin concurrent with anti-CD40 stimulation (Fig. 7D), suggesting that an extended period of “anergic reprogramming” before anti-CD40 stimulation is not required for insulin to impair proliferation.
FIGURE 7.
Functional impairment is observed in anti-insulin B cells after short-term exposure to insulin. Naive immature 125Tg B cells were generated (Fig. 2). A, Flow cytometric analysis showing relative IgM surface expression levels on 125Tg cells cultured for 0.5–5 h in the presence of human insulin, as calculated in Fig. 3A. The average of seven animals ± SD is shown; *, p < 0.01 and **, p < 0.007, as calculated by a two-tailed, expected mean, one-sample t test. B and C, Intracellular Ca2+ mobilization was measured in cells cultured for 1 day with no insulin, followed by 0 ng/ml (solid black line), 500 ng/ml (dashed gray line), or 5 × 10⁴ ng/ml human insulin (dashed black line) for 3 h and stimulated with human insulin (B) or anti-IgM (C). Data are representative of more than five animals. D, [3H]thymidine incorporation (cpm) was measured. Following culture without insulin for 1 day, anti-CD40 (x-axis) and 0 ng/ml (□), 500 ng/ml ( ), or 5 × 10⁴ ng/ml (■) human insulin were added simultaneously and the cells were cultured for an additional 2 days. The average of triplicate values from three animals ± SD is shown; †, p < 0.031 and ‡, p < 0.001, as calculated by a two-tailed, two-sample/unequal variance t test.
Maintenance of immature anti-insulin B cell anergy requires continuous Ag presence
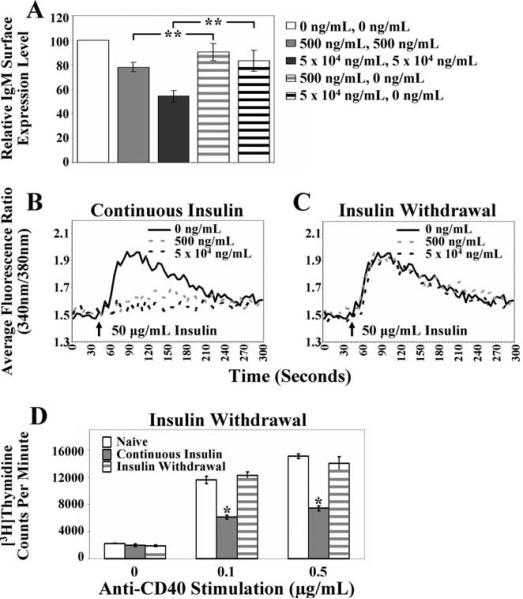
To identify whether anergy in immature anti-insulin B cells requires continuous Ag exposure, 125Tg B cells were cultured with or without insulin (Fig. 2A) and relative IgM expression (Fig. 8A) and Ca2+ mobilization (Fig. 8, B and C) were assessed. Continuous Ag was present ( and ■, Fig. 8A, or gray and black dashed lines, Fig. 8B) or Ag was removed (gray and black striped bars, Fig. 8A, or gray and black dashed lines, Fig. 8C) and cells were cultured for an additional day. Removal of Ag for 1 day (Fig. 8A, striped bars) resulted in restoration of relative surface IgM expression compared with continuous Ag presence (solid bars, Fig. 8A). Insulin withdrawal also restored the ability of cells to mobilize Ca2+ upon acute stimulation with insulin (Fig. 8C). Using a similar approach, withdrawal of insulin upon addition of anti-CD40 resulted in reversion of the level of proliferation to the levels found in naive cells (Fig. 8D). Together, these data indicate that immature B cells retain a high level of functional plasticity, initiating or suppressing the anergic phenotype based on Ag availability.
FIGURE 8.
Functional impairment of 125Tg immature B cells is highly reversible. 125Tg immature B cells were cultured (Fig. 2) with continuous Ag (days 1–2) or Ag was withdrawn from the culture (Ag added day 1, removed day 2). IgM down-regulation, calcium mobilization, and proliferation were assessed. A, Flow cytometric analysis showing relative IgM surface expression levels, as calculated in Fig. 3A. The average of eight animals ± SD is shown. B and C, Intracellular Ca2+ mobilization was measured in cells cultured with 0 ng/ml (solid black line), 500 ng/ml (dashed gray line), or 5 × 10⁴ ng/ml human insulin (dashed black line) for 2 days (continuous insulin presence, B) or 1 day, followed by Ag removal and 1 day of additional culture in the absence of insulin (insulin withdrawal, C) and stimulated with human insulin. Data are representative of four animals. D, [3H]thymidine incorporation (cpm) was measured. Five hundred nanograms of human insulin per milliliter was absent for 3 days (□), continuously present for 3 days ( ), or added for 1 day and then removed for 2 days (striped gray bars); cells were stimulated with anti-CD40 (x-axis) for the final 2-day period. The average of triplicate values ± SD is shown; data are representative of two animals. A two-tailed, two-sample/unequal variance t test was used to calculate the significance for all bar graphs, *, p < 0.001 and **, p < 0.0007.
Discussion
Using IL-7-driven bone marrow culture, we found that naive immature B cells can be generated which mobilize Ca2+ upon insulin stimulation and proliferate upon CD40 engagement. However, immature 125Tg B cells exposed to insulin adopt many of the tolerant phenotypes observed in mature 125Tg splenic B cells, including surface IgM down-regulation, reduced Ca2+ mobilization upon stimulation with insulin, anti-IgM, or ionomycin, as well as impaired proliferative responses to anti-CD40 stimulation. This functional impairment is induced in an Ag-specific fashion and is not due to the hormonal activity of insulin. These findings therefore suggest that a small protein hormone, such as insulin, is capable of altering the biological responsiveness of immature bone marrow B cells in a way that closely resembles the anergic phenotype observed in mature B cells. This initial phase of anergy induction likely serves as a critical line of defense against autoaggressive B cells present in the developing repertoire.
Tonic signaling emanating from BCR surface expression is critical for B cell development to proceed (27–29). A lack of positive signaling due to BCR down-regulation induces receptor editing, another arm of developing B cell tolerance (30). The 125Tg non-targeted transgenic model is not ideal to study how this process physiologically proceeds; therefore, future studies to generate a targeted model will better address whether receptor editing is involved in maintaining tolerance for insulin. Whether frustrated editing attempts are made, anergy is still induced in 125Tg immature B cells to effectively censor self-reactivity. We hypothesize that the IgM down-regulation seen in 125Tg immature B cells cultured with insulin may similarly diminish the amount of positive signaling generated, which may in part account for the reduced Ca2+ mobilization observed. Culture with 500 ng/ml insulin results in a modest reduction of surface IgM (Fig. 3A), yet results in more substantial impairment in Ca2+ mobilization (Fig. 5, D and E). Thus, even a modest reduction in surface IgM expression may correlate with biologically relevant functional outcomes and highlights the exquisite sensitivity that immature B cells possess to detect cognate Ag. Additionally, ionomycin responsiveness, which bypasses the BCR, is also impaired (Fig. 5G), supporting that functional impairment involves changes in the way cells manage intracellular Ca2+ increases and is not solely due to reduced Ag engagement of surface BCR.
Increases of intracellular Ca2+ up-regulate calcineurin activity, which dephosphorylates NFAT to promote its nuclear translocation to induce proliferation in mature lymphocytes (25). Calcineurin inhibition results in decreased 125Tg immature B cell proliferation to anti-CD40 (Fig. 6). We therefore propose a model in which immature 125Tg B cells chronically engaging insulin enter an impaired state by down-regulating the BCR. This limits the magnitude of intracellular Ca2+ increases derived from tonic BCR signaling to diminish calcineurin activity. The magnitude of cell proliferation to anti-CD40 stimulation is therefore impaired due to this reduction in tonic signaling. This may be achieved by reducing nuclear translocation of NFAT, a well-known target of calcineurin (25), which occurs in mature, anergic 125Tg B cells (15). Alternatively, calcineurin has also been shown to dephosphorylate cell cycle proteins, such as CDK4 (31), and calcineurin inhibition inactivates CDK2 in late G1 or S phase due to p27 accumulation (32), thus highlighting another potential method of cell cycle control.
BCR down-regulation and impaired Ca2+ mobilization are observed after 3 h of insulin exposure (Fig. 7, A–C), and immature B cells simultaneously exposed to insulin and anti-CD40 show impaired proliferative responses (Fig. 7D). Any transcriptional changes required to suppress proliferation appear to be able to occur concomitantly with those that support proliferation to result in a dominant antiproliferative effect. These findings raise the possibility that the anergic state observed does not require substantial prior genetic reprogramming. Ca2+ is required for cell cycle progression (32); thus, it seems likely that the impaired Ca2+ mobilization observed is linked to the downstream reduction in proliferative responses. Immature anti-insulin B cell anergy is reversible upon Ag withdrawal, as BCR surface expression, Ca2+ mobilization, and proliferation to anti-CD40 stimulation return to levels observed for naive cells (Fig. 8), which is also consistent with the highly sensitive and responsive qualities of intracellular Ca2+ mobilization.
The anti-insulin Ig-transgenic model enables the study of how tolerance is initiated and maintained for physiologically relevant proteins, such as hormones that have low valency interactions with the BCR, and highlights a different form of anergy induction from what is observed in other models of tolerance. In vitro culture with IL-7 generates naive immature B cells not accessible in vivo. The affinity of the 125Tg BCR for human insulin (used in in vitro assays due to high purity) is 3 × 10⁸ M–1 (14), which contrasts with the more than 100-fold higher affinity of IgHELMD4Tg for HEL (5 × 10¹⁰ (26)), the only other low-valency model of B cell anergy. Comparable IgM surface down-regulation is observed following culture with beef insulin (data not shown) which has a lower affinity (3 × 10⁶ M–1) than rodent insulin (8 × 10⁶ M–1) (14). If the reduction in positive signaling from surface BCR is responsible for the tolerance phenotype observed in immature 125Tg B cells cultured with human insulin, this suggests that a lower affinity species of insulin will also elicit anergy. The concentration of insulin present in vitro (50–5 × 10⁴ ng/ml) is higher than the circulating concentration of insulin in vivo (1 ng/ml), which can increase 5-to 10-fold based on physiologic demand (33). However, BCR internalization of insulin in vitro reduces the concentration of Ag available throughout the culture duration, whereas insulin homeostasis in vivo is tightly regulated. The initial insulin concentration present is well below the concentration at which insulin forms dimers (100 μg/ml) (34). Immature B cells show a decreased threshold for activation through the BCR compared with mature B cells (reviewed in Ref. 35); thus, it seems plausible that endogenous levels of rodent insulin, which are sufficient to occupy virtually all of the surface BCR and to induce anergy in mature 125Tg B cells in vivo (10), would be capable of inducing anergy in immature B cells as well. As little as 50 ng/ml insulin can mobilize Ca2+ in immature B cells (data not shown), consistent with highly sensitive biological responses occurring with low concentrations of Ag.
Insulin is a key autoantigen in type 1 diabetes (36) and its availability in the bloodstream fluctuates hourly with physiological responses to increases in blood glucose (33), unlike other autoantigens which may be present at more constant levels. This may therefore represent an important consideration in understanding fully how tolerance is maintained for protein hormones, as this oscillation may allow a brief window for some autoreactive cells to escape into the periphery. The functionality of tolerance at multiple checkpoints is thus likely to be critical for autoimmune disease prevention, particularly with respect to this category of autoantigens. Developing a better understanding of how cells can become functionally silenced may aid in the identification of novel therapeutic targets for the treatment of autoimmune disease and graft rejection. The site and stage of tolerance induction are important in the consideration of designing novel therapeutics, and these studies highlight an important developmental stage for potential therapeutic intervention in autoimmune disease.
Acknowledgments
We would like to acknowledge the Vanderbilt University Medical Center (VUMC) Flow Cytometry Shared Research (supported by the Vanderbilt-Ingram Cancer Center (P30CA68485) and the Vanderbilt Digestive Disease Research Center (DK058404)), the Veterans Affairs Medical Center Flow Cytometry Core (supported through the Veterans Authority), Dawn Kilkenny, Shawn Goodwin, and other members of the VUMC Cell Imaging Shared Resource (supported by National Institutes of Health Grants CA68485, DK20593, DK58404, HD15052, DK59637, and EY08126), and Chrys Hulbert and other J. W. Thomas laboratory members.
Footnotes
This work was supported by National Institutes of Health Grants 5T32 HL069765, 5T32 GM08554, AI051448, and the Juvenile Diabetes Research Foundation.
Abbreviation used in this paper: HEL, hen egg lysozyme.
Disclosures
The authors have no financial conflict of interest.
References
- 1.Serreze DV, Fleming SA, Chapman HD, Richard SD, Leiter EH, Tisch RM. B lymphocytes are critical antigen-presenting cells for the initiation of T cell-mediated autoimmune diabetes in nonobese diabetic mice. J. Immunol. 1998;161:3912–3918. [PubMed] [Google Scholar]
- 2.Gay D, Saunders T, Camper S, Weigert M. Receptor editing: an approach by autoreactive B cells to escape tolerance. J. Exp. Med. 1993;177:999–1008. doi: 10.1084/jem.177.4.999. [DOI] [PMC free article] [PubMed] [Google Scholar]
- 3.Goodnow CC, Crosbie J, Adelstein S, Lavoie TB, Smith-Gill SJ, Brink RA, Pritchard-Briscoe H, Wotherspoon JS, Loblay RH, Raphael K, et al. Altered immunoglobulin expression and functional silencing of self-reactive B lymphocytes in transgenic mice. Nature. 1988;334:676–682. doi: 10.1038/334676a0. [DOI] [PubMed] [Google Scholar]
- 4.Nemazee D, Buerki K. Clonal deletion of autoreactive B lymphocytes in bone marrow chimeras. Proc. Natl. Acad. Sci. USA. 1989;86:8039–8043. doi: 10.1073/pnas.86.20.8039. [DOI] [PMC free article] [PubMed] [Google Scholar]
- 5.Nemazee DA, Burki K. Clonal deletion of B lymphocytes in a transgenic mouse bearing anti-MHC class I antibody genes. Nature. 1989;337:562–566. doi: 10.1038/337562a0. [DOI] [PubMed] [Google Scholar]
- 6.Radic MZ, Erikson J, Litwin S, Weigert M. B lymphocytes may escape tolerance by revising their antigen receptors. J. Exp. Med. 1993;177:1165–1173. doi: 10.1084/jem.177.4.1165. [DOI] [PMC free article] [PubMed] [Google Scholar]
- 7.Tiegs SL, Russell DM, Nemazee D. Receptor editing in self-reactive bone marrow B cells. J. Exp. Med. 1993;177:1009–1020. doi: 10.1084/jem.177.4.1009. [DOI] [PMC free article] [PubMed] [Google Scholar]
- 8.Cooke MP, Heath AW, Shokat KM, Zeng Y, Finkelman FD, Linsley PS, Howard M, Goodnow CC. Immunoglobulin signal transduction guides the specificity of B cell-T cell interactions and is blocked in tolerant self-reactive B cells. J. Exp. Med. 1994;179:425–438. doi: 10.1084/jem.179.2.425. [DOI] [PMC free article] [PubMed] [Google Scholar]
- 9.Nguyen KA, Mandik L, Bui A, Kavaler J, Norvell A, Monroe JG, Roark JH, Erikson J. Characterization of anti-ssDNA B cells in a non-autoimmune background. J. Immunol. 1997;159:2633–2644. [PubMed] [Google Scholar]
- 10.Rojas M, Hulbert C, Thomas JW. Anergy and not clonal ignorance determines the fate of B cells that recognize a physiological autoantigen. J. Immunol. 2001;166:3194–3200. doi: 10.4049/jimmunol.166.5.3194. [DOI] [PubMed] [Google Scholar]
- 11.Cyster JG, Hartley SB, Goodnow CC. Competition for follicular niches excludes self-reactive cells from the recirculating B-cell repertoire. Nature. 1994;371:389–395. doi: 10.1038/371389a0. [DOI] [PubMed] [Google Scholar]
- 12.Gauld SB, Benschop RJ, Merrell KT, Cambier JC. Maintenance of B cell anergy requires constant antigen receptor occupancy and signaling. Nat. Immunol. 2005;6:1160–1167. doi: 10.1038/ni1256. [DOI] [PubMed] [Google Scholar]
- 13.Goodnow CC, Brink R, Adams E. Breakdown of self-tolerance in anergic B lymphocytes. Nature. 1991;352:532–536. doi: 10.1038/352532a0. [DOI] [PubMed] [Google Scholar]
- 14.Schroer JA, Bender T, Feldmann RJ, Kim KJ. Mapping epitopes on the insulin molecule using monoclonal antibodies. Eur. J. Immunol. 1983;13:693–700. doi: 10.1002/eji.1830130902. [DOI] [PubMed] [Google Scholar]
- 15.Acevedo-Suarez CA, Kilkenny DM, Reich MB, Thomas JW. Impaired intracellular calcium mobilization and NFATc1 availability in tolerant anti-insulin B cells. J. Immunol. 2006;177:2234–2241. doi: 10.4049/jimmunol.177.4.2234. [DOI] [PubMed] [Google Scholar]
- 16.Acevedo-Suarez CA, Hulbert C, Woodward EJ, Thomas JW. Uncoupling of anergy from developmental arrest in anti-insulin B cells supports the development of autoimmune diabetes. J. Immunol. 2005;174:827–833. doi: 10.4049/jimmunol.174.2.827. [DOI] [PubMed] [Google Scholar]
- 17.Billips LG, Petitte D, Dorshkind K, Narayanan R, Chiu CP, Landreth KS. Differential roles of stromal cells, interleukin-7, and kitligand in the regulation of B lymphopoiesis. Blood. 1992;79:1185–1192. [PubMed] [Google Scholar]
- 18.Cumano A, Dorshkind K, Gillis S, Paige CJ. The influence of S17 stromal cells and interleukin 7 on B cell development. Eur. J. Immunol. 1990;20:2183–2189. doi: 10.1002/eji.1830201006. [DOI] [PubMed] [Google Scholar]
- 19.Milne CD, Fleming HE, Paige CJ. IL-7 does not prevent pro-B/pre-B cell maturation to the immature/sIgM+ stage. Eur. J. Immunol. 2004;34:2647–2655. doi: 10.1002/eji.200425400. [DOI] [PubMed] [Google Scholar]
- 20.Benschop RJ, Aviszus K, Zhang X, Manser T, Cambier JC, Wysocki LJ. Activation and anergy in bone marrow B cells of a novel immunoglobulin transgenic mouse that is both hapten specific and autoreactive. Immunity. 2001;14:33–43. doi: 10.1016/s1074-7613(01)00087-5. [DOI] [PubMed] [Google Scholar]
- 21.Norvell A, Mandik L, Monroe JG. Engagement of the antigen-receptor on immature murine B lymphocytes results in death by apoptosis. J. Immunol. 1995;154:4404–4413. [PubMed] [Google Scholar]
- 22.Weiner HL, Moorhead JW, Claman HN. Anti-immunoglobulin stimulation of murine lymphocytes: I. Age dependency of the proliferative response. J. Immunol. 1976;116:1656–1661. [PubMed] [Google Scholar]
- 23.Brink R, Goodnow CC, Crosbie J, Adams E, Eris J, Mason DY, Hartley SB, Basten A. Immunoglobulin M and D antigen receptors are both capable of mediating B lymphocyte activation, deletion, or anergy after interaction with specific antigen. J. Exp. Med. 1992;176:991–1005. doi: 10.1084/jem.176.4.991. [DOI] [PMC free article] [PubMed] [Google Scholar]
- 24.Brines RD, Klaus GG. Polyclonal activation of immature B cells by preactivated T cells: the role of IL-4 and CD40 ligand. Int. Immunol. 1993;5:1445–1450. doi: 10.1093/intimm/5.11.1445. [DOI] [PubMed] [Google Scholar]
- 25.Gwack Y, Feske S, Srikanth S, Hogan PG, Rao A. Signalling to transcription: store-operated Ca2+ entry and NFAT activation in lymphocytes. Cell Calcium. 2007;42:145–156. doi: 10.1016/j.ceca.2007.03.007. [DOI] [PubMed] [Google Scholar]
- 26.Batista FD, Neuberger MS. Affinity dependence of the B cell response to antigen: a threshold, a ceiling, and the importance of off-rate. Immunity. 1998;8:751–759. doi: 10.1016/s1074-7613(00)80580-4. [DOI] [PubMed] [Google Scholar]
- 27.Kouskoff V, Nemazee D. Role of receptor editing and revision in shaping the B and T lymphocyte repertoire. Life Sci. 2001;69:1105–1113. doi: 10.1016/s0024-3205(01)01219-x. [DOI] [PubMed] [Google Scholar]
- 28.Meade J, Tybulewicz VL, Turner M. The tyrosine kinase Syk is required for light chain isotype exclusion but dispensable for the negative selection of B cells. Eur. J. Immunol. 2004;34:1102–1110. doi: 10.1002/eji.200324309. [DOI] [PubMed] [Google Scholar]
- 29.Shivtiel S, Leider N, Sadeh O, Kraiem Z, Melamed D. Impaired light chain allelic exclusion and lack of positive selection in immature B cells expressing incompetent receptor deficient of CD19. J. Immunol. 2002;168:5596–5604. doi: 10.4049/jimmunol.168.11.5596. [DOI] [PubMed] [Google Scholar]
- 30.Schram BR, Tze LE, Ramsey LB, Liu J, Najera L, Vegoe AL, Hardy RR, Hippen KL, Farrar MA, Behrens TW. B cell receptor basal signaling regulates antigen-induced Ig light chain rearrangements. J. Immunol. 2008;180:4728–4741. doi: 10.4049/jimmunol.180.7.4728. [DOI] [PubMed] [Google Scholar]
- 31.Baksh S, Widlund HR, Frazer-Abel AA, Du J, Fosmire S, Fisher DE, DeCaprio JA, Modiano JF, Burakoff SJ. NFATc2-mediated repression of cyclin-dependent kinase 4 expression. Mol. Cell. 2002;10:1071–1081. doi: 10.1016/s1097-2765(02)00701-3. [DOI] [PubMed] [Google Scholar]
- 32.Kahl CR, Means AR. Regulation of cell cycle progression by calcium/calmodulin-dependent pathways. Endocr. Rev. 2003;24:719–736. doi: 10.1210/er.2003-0008. [DOI] [PubMed] [Google Scholar]
- 33.Felig P. In: Physiologic action of insulin. In Diabetes Mellitus, Theory and Practice. Ellenberg M, Rifkin H, editors. Medical Examination Publishing; New Hyde Park: 1983. pp. 77–88. [Google Scholar]
- 34.Blundell T, Dodson G, Hodgkin D, Mercola D. Insulin: the structure in the crystal and its reflection in chemistry and biology. In: Anfinsen CB, Edsall JT, Richards FM, editors. In Advances in Protein Chemistry. Vol. 26. Academic; New York: 1972. pp. 279–403. [Google Scholar]
- 35.King LB, Monroe JG. Immunobiology of the immature B cell: plasticity in the B-cell antigen receptor-induced response fine tunes negative selection. Immunol. Rev. 2000;176:86–104. doi: 10.1034/j.1600-065x.2000.00609.x. [DOI] [PubMed] [Google Scholar]
- 36.Zhang L, Nakayama M, Eisenbarth GS. Insulin as an autoantigen in NOD/human diabetes. Curr. Opin. Immunol. 2008;20:111–118. doi: 10.1016/j.coi.2007.11.005. [DOI] [PMC free article] [PubMed] [Google Scholar]


