

Abstract
Objective
High fat, low carbohydrate (HFLC) diets have become popular tools for weight management. We sought to determine the effects of a HFLC diet compared to a low fat high carbohydrate (LFHC) diet on the change in weight loss, cardiovascular risk factors and inflammation in subjects with obesity.
Methods
Obese subjects (29.0–44.6 kg/m2) recruited from Boston Medical Center were randomized to a hypocaloric LFHC (n=26) or HFLC (n=29) diet for 12 weeks.
Results
The age range of subjects was 21–62 years. As a percentage of daily calories, the HFLC group consumed 33.5% protein, 56.0% fat and 9.6% carbohydrate and the LFHC group consumed 22.0% protein, 25.0% fat and 55.7% carbohydrate. The change in percent body weight, lean and fat mass, blood pressure, flow mediated dilation, hip:waist ratio, hemoglobin A1C, fasting insulin and glucose, and glucose and insulin response to a 2 h oral glucose tolerance test did not differ (P>0.05) between diets after 12 weeks. The HFLC group had greater mean decreases in serum triglyceride (P=0.07), and hs-CRP (P=0.03), and greater mean increases in HDL cholesterol (P=0.004), and total adiponectin (P=0.045) relative to the LFHC. Secreted adipose tissue adiponectin or TNF-α did not differ after weight loss for either diet.
Conclusions
Relative to the LFHC group, the HFLC group had greater improvements in blood lipids and systemic inflammation with similar changes in body weight and composition. This small-scale study suggests that HFLC diets may be more beneficial to cardiovascular health and inflammation in free-living obese adults compared to LFHC diets.
Keywords: macronutrients, weight loss, cardiovascular, inflammation
Introduction
Obesity has become a global epidemic with approximately 500 million individuals affected worldwide [1]. Due to the multitude of co-morbidities associated with this disease, great efforts have been placed on developing treatment strategies for weight reduction. Dietary manipulation remains the first-line treatment for individuals who are overweight and obese. High fat, low carbohydrate (HFLC) diets have received considerable attention in recent years, particularly for the beneficial effects that have been reported on cardiovascular risk markers in overweight and obese individuals [2]. However, some of the results from these studies have been inconsistent, particularly with respect to inflammation. For example, improvements in systemic inflammation have been shown to be improved in several studies when a HFLC diet is consumed, while others have seen improvements with low fat, high carbohydrate (LFHC) diets [3–8]. Some of these discrepancies in outcomes may be due to greater weight loss achieved by a high fat (50–60% kcal), low carbohydrate (20–60 g/d carbohydrate) diet compared to a low fat (20–30% kcal), high carbohydrate (50–60% kcal) diet.
We designed our intervention to promote equal weight loss between two diets varying in macronutrient composition, but with identical calorie deficits. The objective of this study was to determine the effects of hypocaloric LFHC and HFLC diets on the change in anthropometric measures, blood lipids, glucose metabolism, and vascular function in free-living obese adults. We hypothesized that the eucaloric diets would cause similar weight loss and improvements in outcome measures. To test this hypothesis, we utilized an intensive behavioral program that included regular interaction with a registered dietitian in an outpatient setting.
In addition, weight loss has been shown to reduce obesity-associated inflammation [9–12] and there is some evidence to suggest that improvement in adipose tissue inflammation with weight loss may also be influenced by the macronutrient content of the diet [13]. However, no previous studies have directly compared the effects of hypocaloric LFHC and HFLC diets on adipose tissues inflammation in obese individuals. Thus, the secondary objective of this study was to determine how macronutrient content affects serum and adipose tissue inflammation after moderate weight loss in a group of healthy, obese individuals.
Methods
Subjects
Obese subjects (BMI 29.0–44.6 kg/m2) were recruited between April 2009 and October 2010 from the Nutrition and Weight Management Center at Boston Medical Center (Boston, MA). Individuals with cardiovascular disease, type 2 diabetes with HbA1C > 8.0% and on anti-diabetes medication, recent body weight loss (≥ 3% within 3 months), weight loss medication use within 4 weeks (phentermine, orlistat, or sibutramine), eating disorder, renal or hepatic disease, prior bariatric surgery, pregnancy, tobacco use, thyroid disorder or current use of angiotensin receptor blocker medications were excluded from the study. Subjects were also asked to refrain from taking non-steroidal anti-inflammatory medications 7 days prior to the baseline and follow up measures. All subjects provided written, informed consent prior to participating in this study, which was approved by the Institutional Review Board at Boston University Medical Center.
Study design and intervention
One week prior to randomization at the baseline study visit, subjects were counseled by a registered dietitian to follow the American Heart Healthy diet [14]. After the run-in period, subjects were randomized to either the LFHC or HFLC diet and were individually counseled by the study dietitian on a bi-weekly basis to consume a 500 kcal deficit diet targeted to induce 0.5–1 kg weight loss per week (5–10% total weight loss over 12 weeks). Daily caloric needs were estimated by the Mifflin-St Jeor equation [15]. Subjects randomized to the LFHC diet were counseled to consume ~60% of calories from complex carbohydrates, 25% from fat (<7% kcal saturated fat), and 15% from protein. Subjects randomized to the HFLC were counseled to consume ≤40 g/d carbohydrates and 60% kcal as fat (<7% kcal saturated fat) and the remainder of calories from protein (~35%). All subjects completed take home 3-day food records (two weekdays and one weekend day) every two weeks. Energy, and macro- and micronutrient content of the diets were determined by Nutrition Data System for Research (NDSR, Nutrition Coordinating Center, University of Minnesota, Minneapolis, MN).
Anthropometry and body composition
Subjects’ height, weight, body mass index (BMI), blood pressure, and waist and hip circumference were measured at baseline and after the 12 week intervention by the same study coordinator or nurse. Body composition was determined at baseline and follow-up by dual energy x-ray absorptiometry (DXA). All scans were performed at Boston Medical Center’s General Clinical Research Unit on a Hologic QDR Series (Discovery W) DXA Machine.
Vascular Function
Vascular function was assessed prior to and following the 12 week intervention by non-invasive ultrasound of the brachial artery before and 1-minute following induction of reactive hyperemia by a 5-minute upper arm cuff occlusion as described previously [9]. Briefly, brachial artery vasoreactivity was measured by trained blinded sonographers using standardized method of ultrasound imaging on a Toshiba Powervision 6000 system (Toshiba Medical USA, Tustin, CA). All vasoactive medications were withheld 24 h before examination and ultrasounds were performed in a temperature-controlled room with subjects resting supine in a fasting state. Flow-mediated dilation (FMD), expressed as relative change (%) in arterial diameter, of the brachial artery was examined as a measure of endothelium-dependent macro-vascular function. An investigator blinded to clinical information performed all analyses of digitized end-diastolic images.
Fasting blood measures
Fasting blood samples were collected at prior to (baseline) and 12 weeks following the dietary intervention. Serum fasting lipids (triglycerides, high density lipoprotein (HDL), low density lipoprotein (LDL) and total cholesterol), whole blood hemoglobin A1C (HbA1C), and serum high sensitivity C-reactive protein (hs-CRP) were measured using standard methods employed by Quest Diagnostics. Fasting serum insulin concentrations were determined by ELISA (Alpco Diagnostics, Salem, NH) according to the manufacturer’s instructions. Fasting serum glucose was determined by colorimetric assay (Cayman Chemical, Ann Arbor, MI). Concentrations of total and high molecular weight (HMW) adiponectin in serum were determined by ELISA according to the manufacturer’s directions (Alpco Diagnostics, Salem, NH). All samples were measured in duplicate and the absorbance was measured at 500 nm for glucose, 492 nm (650 nm reference wavelength) for adiponectin and 450 nm (reference wavelength of 650 nm) for insulin on a microtitre plate reader (SPECTRAmax 190, Molecular Devices, Sunnyvale, CA).
Oral Glucose Tolerance Test
An oral glucose tolerance test (OGTT) was performed prior to (baseline) and 12 weeks following the dietary intervention. A catheter was inserted into an anticubital vein and a two hour OGTT was performed. Blood samples were collected in the fasting state and 30, 60, 90 and 120 minutes after 100 g of glucose (Trutol, orange flavor) was consumed. The OGTT was performed following the adipose tissue biopsy. Plasma glucose and serum insulin concentrations were measured by Quest Diagnostics.
Subcutaneous Adipose Tissue Collection and Acute Incubation Assay
Subcutaneous adipose tissue samples were collected from the peri-umbilicus region (approximately 3–5 cm lateral to the umbilicus) as previously described [16] prior to (baseline) and 12 weeks following the dietary intervention. Briefly, a sterile field was established and the sampling site was sterilized with betadine and 1% lidocaine was administered for local anesthesia. Through a small 0.5 cm scalpel incision, a three-hole canula was used with wall suction to extract approximately 1–2 g of adipose tissue. A portion of adipose tissue was placed in sterile, ambient temperature Media 199 (Invitrogen, Carlsbad, CA) culture media and transported immediately to the laboratory, where it was weighed and prepared for acute tissue incubations [17]. Adipose tissue samples were minced to uniform 1–2 mm diameter fragments and approximately 100 mg was placed in 1 ml of M199 + 1% bovine serum albumin (Probumin fatty acid free, Millipore, Billerica, MA) in a shaking water bath for 3 h at 37°C. After the incubation period, culture media was collected and stored at −80°C until protein analyses could be performed. Concentrations of TNF-α and adiponectin in the culture media were determined by ELISA according to the manufacturer’s directions (Alpco Diagnostics, Salem, NH).
Statistical Analyses
Baseline characteristics for each of the two dietary groups are described using means and standard deviations for continuous measures and percentages for dichotomous measures. A block randomization method with block sizes of 4 and 6 was used for participant randomization. The area under the curve for glucose and insulin were calculated according to Seltzer’s methods as published elsewhere [18,19]. The homeostasis model assessment of insulin resistance (HOMA-IR) was calculated as follows: fasting insulin (μU/ml) × fasting glucose (mg/dl) ÷ 450. Differences between groups were determined by independent T-test and ANCOVA and differences within groups were determined by paired T-test. ANCOVA analysis was used to compare the change in each of the outcome measures from baseline between the LFHC and HFLC groups. Baseline measures, percent weight loss, age and sex were included as covariates in the analyses. In secondary analyses, we included only subjects that lost the recommended >5% weight loss. The level of significance set for all statistical analyses was P<0.05. All statistical analyses were performed using SPSS software (Version 15). Outcome measures included change in BMI, weight, waist:hip ratio, blood pressure, blood lipids, glucose metabolism, inflammatory markers and FMD.
Results
Attrition
Prior to randomization, one subject withdrew for personal reasons and one subject was excluded after baseline measures due to HbA1C levels >8.0%. Of the 55 subjects enrolled in the study, 26 were randomized to the LFHC and 29 were randomized to the HFLC. The unequal randomization was due to early termination of the study and the utilization of block randomization with block sizes of 4 and 6. Twenty-two (40%) subjects withdrew from the study following randomization (Figure 1) with 18 subjects remaining in the HFLC group and 15 subjects in the LFHC group at the end of the study. Subjects that dropped out of the LFHC group had higher baseline systolic blood pressure relative to the subjects that completed the LFHC dietary intervention, but otherwise all other baseline measures were similar. We were unable to have subjects who dropped out return for follow-up measures, with the exception of body weight measured at the last dietitian visit before drop-out. Thus, treatment analyses were conducted. However, intent-to-treat analyses on weight loss showed that there was no difference between dietary groups with respect to weight loss compared to the completer analysis. Based on interactions with the study subjects, we believe that many of the subjects may have dropped out and not returned for follow-up because of the post-intervention adipose tissue biopsy, which seemed to be poorly accepted by some participants at the baseline visit.
Figure 1.
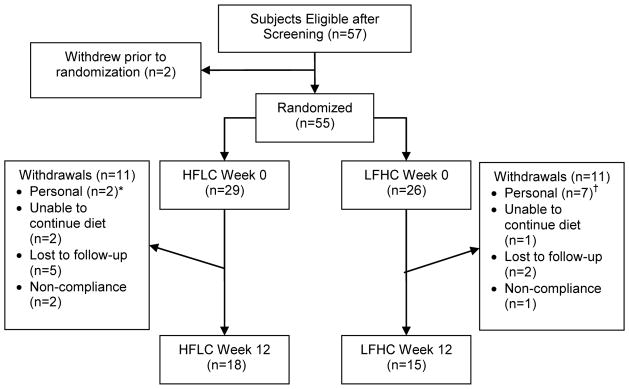
Participant Flowchart. * The personal reasons provided by the subjects from the HFLC diet were unspecified. † The personal reasons provided by the subjects that withdrew from the LFHC diet included unspecified (n=3), work commitment (n=1), family illness (n=1), family commitment (n=1) and “did not lose weight on diet” (n=1).
Baseline Subject Characteristics
Baseline characteristics of all randomized subjects are shown in Table 1. All baseline measures were similar between the HFLC and LFHC groups except plasma triglyceride (P=0.036) and fasting insulin (P=0.029) concentrations were significantly higher in the HFLC group.
Table 1.
Baseline subject characteristics for all enrolled subjects
| LFHC (n=26) | HFLC (n=29) | |
|---|---|---|
| Age | 41.5 ± 12.8 | 43.5 ± 11.5 |
| % Female | 88 | 90 |
| Body weight (kg) | 99.3 ± 14.5 | 100.5 ± 14.8 |
| BMI (kg/m2) | 35.9 ± 4.8 | 37.1 ± 4.6 |
| Waist:Hip Ratio | 0.92 ± 0.06 | 0.91 ± 0.08 |
| % Body Fat | 43.4 ± 5.3 | 43.6 ± 5.1 |
| % Lean Mass | 54.0 ± 5.1 | 53.9 ± 5.0 |
| Systolic BP (mmHg) | 117.2 ± 15.0 | 122.3 ± 14.2 |
| Diastolic BP (mmHg) | 76.4 ± 9.4 | 76.8 ± 9.3 |
| % FMD | 9.61 ± 2.92 | 9.80 ± 3.94 |
| Fasting Insulin (μU/ml) | 9.62 ± 3.78 | 13.67 ± 8.06* |
| Insulin AUC 2h OGTT | 4916 ± 1956 | 6248 ± 3670 |
| Fasting Glucose (mg/dl) | 82.29 ± 11.62 | 85.56 ± 15.97 |
| Glucose AUC 2h | ||
| OGTT | 15324 ± 4073 | 15720 ± 3070 |
| HOMA-IR | 0.95 ± 0.97 | 0.80 ± 0.46 |
| HbA1c | 5.65 ± 0.25 | 5.70 ± 0.49 |
| Triglyceride (mg/dl) | 90.0 ± 33.5 | 121.2 ± 66.7† |
| Cholesterol | ||
| Total (mg/dl) | 178.3 ± 30.3 | 185.8 ± 38.6 |
| LDL (mg/dl) | 107.9 ± 25.5 | 110.7 ± 34.3 |
| HDL (mg/dl) | 52.4 ± 14.4 | 50.9 ± 14.5 |
| hs-CRP (mg/l) | 6.94 ± 10.4 | 5.62 ± 6.55 |
| Serum HMW | ||
| Adiponectin (ng/ml) | 2.49 ± 1.54 | 2.28 ± 1.77 |
| Serum Total | ||
| Adiponectin (ng/ml) | 4.59 ± 2.10 | 4.01 ± 2.43 |
| Serum HMW: Total | ||
| Adiponectin | 0.51 ± 0.16 | 0.50 ± 0.10 |
Data represent mean ± SD for all randomized subjects.
indicates significant difference from LFHC group (P=0.029).
indicates significant difference from LFHC group (P=0.036).
AUC, area under the curve; BMI, body mass index; BP, blood pressure; FMD, flow mediated dilation; LDL, low density lipoprotein; HbA1c, hemoglobin A1C; HDL; high density lipoprotein; HMW, high molecular weight; HOMA-IR, homeostatic model assessement-insulin resistance; hs-CRP, high sensitivity C-Reactive protein; HbA1C, hemoglobin A1C; OGTT, oral glucose tolerance test.
Dietary Intake and Compliance
There were no differences in total daily calories between the LFHC and HFLC groups; however, as expected significant differences in macronutrient composition, both total and percent energy, were observed. Carbohydrate intake was significantly lower in the HFLC group (P<0.0001) and protein (P<0.0001) and total fat (P<0.0001) were significantly higher in the HFLC group compared to the LFHC group (Table 2). The HFLC group consumed the recommended amount of carbohydrate and total fat. For the LFHC group, carbohydrate intake was slightly lower than recommended (56% vs 60% kcal) and protein intake was slightly higher (22% vs 15% kcal). Actual total and saturated fat intake was similar to what was prescribed to the LFHC group, but saturated fat intake in the HFLC was higher than recommended (Table 2).
Table 2.
Average daily dietary intake of subjects that completed the 12 week study.
| LFHC (n=15) | HFLC (n=18) | |
|---|---|---|
| Energy (kcal) | 1439 ± 485 | 1532 ± 468 |
| Fat (g) | 40.1 ± 20.3 | 95.5 ± 33.2* |
| % Fat energy | 25.0 ± 9.1 | 56.0 ± 8.8* |
| SFA (g) | 12.3 ± 7.7 | 35.0 ± 13.8* |
| SFA % energy | 7.7 ± 4.1 | 20.7 ± 5.1* |
| MUFA (g) | 14.3 ± 7.7 | 36.2 ± 13.2* |
| MUFA % energy | 8.9 ± 3.9 | 21.2 ± 4.0* |
| PUFA | 9.6 ± 6.8 | 14.8 ± 9.5* |
| PUFA % energy | 5.9 ± 3.2 | 8.5 ± 4.3* |
| Cholesterol (mg) | 182 ± 142 | 620 ± 258* |
| Carbohydrates (g) | 201.8 ± 83.0 | 39.4 ± 59.5* |
| Carbohydrates % energy | 55.7 ± 12.6 | 9.6 ± 7.7* |
| Dietary Fiber (g) | 26.3 ± 12.8 | 6.8 ± 4.2* |
| Protein (g) | 76.6 ± 25.3 | 125.6 ± 38.2* |
| Protein % energy | 22.0 ± 5.4 | 33.5 ± 7.9* |
Data represent mean ± SD, based on bi-weekly 3-day food records (2 weekdays and 1 weekend day). Energy, macronutrient and micronutrient content of the diets were determined by Nutrition Data System for Research (NDSR, Nutrition Coordinating Center, University of Minnesota, Minneapolis, MN). SFA: saturated fatty acids; MUFA, monounsaturated fatty acids; PUFA, polyunsaturated fatty acids.
indicates significant difference between diets by independent t-test (P<0.05).
Anthropometric Measures
After dietary intervention all subjects lost significant percent body weight and fat mass, and increased the proportion of lean body mass relative to baseline, but there was no effect of dietary treatment on the change in these parameters after weight loss (Table 3). The HFLC group had lower systolic (P=0.017) and diastolic (P=0.017) blood pressure after weight loss and these changes were not observed in the LFHC group. The target weight loss set for the study was 5–10% and a comparison between dietary interventions revealed that there was a greater proportion (78%) of subjects in the HFLC group that lost >5% body weight relative to the LFHC group (53%). There was no effect of diet on the change in waist to hip ratio or diastolic and systolic blood pressure (Table 3).
Table 3.
Mean changes in outcome measures from baseline to 12 weeks by diet group for all completers and subjects that lost greater than 5% body weight.
| All Completers | >5 % Weight Loss† | |||
|---|---|---|---|---|
|
| ||||
| LFHC (n=15) | HFLC (n=18) | LFHC (n=8) | HFLC (n=14) | |
| BMI (kg/m2) | −1.8 ± 1.5 | −2.5 ± 1.5 | −2.9 ± 1.3 | −3.1 ± 1.1 |
| % Body Weight | −5.3 ± 4.7 | −7.1 ± 4.6 | −8.6 ± 3.8 | −8.6 ± 3.3 |
| Waist:hip ratio | 0.01 ± 0.05 | 0.01 ± 0.07 | 0.01 ± 0.03 | −0.03 ± 0.07 |
| Total Fat Mass (kg) | −4.8 ± 3.1 | −5.2 ± 4.0 | −7.0 ± 2.2 | −6.6 ± 3.2 |
| Total Lean Mass (kg) | −0.3 ± 2.3 | −1.6 ± 1.3 | −1.4 ± 2.5 | −1.5 ± 0.8 |
| Percent Fat Mass | −3.0 ± 1.6 | −2.5 ± 2.9 | −4.0 ± 1.1 | −3.4 ± 2.4 |
| Percent Lean Mass | 2.8 ± 1.4 | 2.4 ± 2.8 | 3.8 ± 1.0 | 3.2 ± 2.2 |
| Systolic BP (mmHg) | 2.5 ± 12.4 | −8.8 ± 14.1 | 6.4 ± 15.4 | −9.8 ± 15.2 |
| Diastolic BP (mmHg) | 0.9 ± 9.5 | −5.2 ± 8.2 | 2.0 ± 10.7 | −7.1 ± 8.1 |
| % FMD | 0.47 ± 4.29 | −0.53 ± 4.22 | 0.36 ± 4.66 | −0.73 ± 4.71 |
| Fasting Insulin (μIU/ml) | −2.08 ± 5.12 | −4.86 ± 6.31 | −4.22 ± 4.71 | −5.03 ± 7.03 |
| Insulin AUC 2h | ||||
| OGTT | −1082 ± 2406 | 740 ± 6633 | −2081 ± 2189 | −736 ± 2061 |
| Fasting Glucose (mg/dl) | −2.90 ± 8.24 | −2.59 ± 14.50 | −3.91 ± 3.33 | −3.92 ± 16.18 |
| Glucose AUC 2h | ||||
| OGTT | −886 ± 2543 | −205 ± 2541 | −1530 ± 3060 | −556 ± 1966 |
| HOMA-IR | −0.43 ± 0.92 | −0.90 ± 1.45 | −0.86 ± 0.85 | −0.96 ± 1.65 |
| HbA1c | −0.11 ± 0.12 | −0.07 ± 0.17 | −0.15 ± 0.14 | −0.07 ± 0.16 |
| TG (mg/dl) | 11.3 ± 35.3 | −33.2 ± 37.3 | 9.3 ± 45.1 | −27.5 ± 24.9‡ |
| Cholesterol | ||||
| Total (mg/dl) | −10.2 ± 24.2 | −2.67 ± 37.4 | −24.5 ± 20.8 | −6.0 ± 40.2 |
| LDL (mg/dl) | −7.6 ± 19.2 | −1.1 ± 36.1 | −17.1 ± 18.1 | −5.0 ± 39.5 |
| HDL (mg/dl) | −5.0 ± 10.5 | 5.1 ± 7.3* | −9.4 ± 11.5 | 4.6 ± 7.0§ |
Data represent mean change from baseline ± SD. AUC, area under the curve; BMI, body mass index; BP, blood pressure; FMD, flow mediated dilation; LDL, low density lipoprotein; HbA1c, hemoglobin A1C; HDL; high density lipoprotein; HOMA-IR, homeostatic model assessment-insulin resistance; HbA1C, hemoglobin A1C; OGTT, oral glucose tolerance test.
indicates significant difference between mean change in measures between diets by ANCOVA, with age, sex, baseline measure and % weight loss as covariates (P=0.004).
The secondary analysis compares only those participants who reached a minimum of 5% weight loss and is included for informational purposes and to assist in future study design. It is not powered at 80% to find significant differences between the two treatment groups. Significant difference between diets in mean change in measures by ANCOVA with baseline measure as covariate
(P=0.052) and
(P=0.002).
Glucose Homeostasis and OGTT
HbA1C levels were significantly reduced in the LFHC group (P=0.042), but not the HFLC group after weight loss. Fasting insulin (P=0.008) and HOMA-IR (P=0.026) were lower after weight loss in the HFLC group, but not the LFHC group. There was no effect of diet on the change in HbA1C, fasting glucose and insulin levels and HOMA-IR after weight loss (Table 3). There was also no effect of diet on the change in the area under the curve (AUC) for glucose or insulin in response to the 100 g oral glucose load after weight loss (Table 3).
Blood Lipids and FMD
There was a significant effect of diet on the change in plasma triglycerides and HDL cholesterol levels. HDL levels increased (P=0.009) and triglyceride (P=0.002) concentrations decreased after weight loss in the HFLC group, but not the LFHC group. Subjects that consumed the HFLC diet had a greater absolute change in fasting serum triglycerides (−23.0%, P=0.002) and HDL (11.2%, P=0.003) after weight loss compared to the LFHC diet (Table 3). After adjustment for baseline levels, age, sex, and percent weight loss, the change in triglycerides was borderline significant (P=0.07). Diet did not affect the change in total or LDL cholesterol or percent FMD after weight loss (Table 3).
Inflammation
There was a significant effect of diet on serum inflammation. Compared to baseline levels, total serum adiponectin increased (P=0.019) and hs-CRP concentrations decreased (P=0.020) in the HFLC, but not the LFHC group. Subjects in the HFLC group had a significantly greater reduction in serum hs-CRP concentrations after the 12-week study period (P=0.03) when age, sex, percent weight loss and baseline hs-CRP levels were included in the analyses compared to the LFHC diet. Subjects that consumed the HFLC diet had a greater change in total adiponectin (P=0.045, adjusted for age, percent weight loss and baseline total adiponectin) relative to the LFHC group (Table 4). Diet did not affect the change in HMW adiponectin at follow-up when age, sex, baseline HMW adiponectin and percent weight loss were included as covariates in the analyses. In our secondary analyses, when we included only subjects in each dietary group that had lost the recommended >5% weight loss, the change in both the total and HMW adiponectin was greater in the HFLC diet (Table 4). There was no effect of diet on the ratio of HMW:Total adiponectin after weight loss. In all subjects, the change in secretion of TNF-α (−35.1 ± 37.2 pg/g LFHC (n=9) versus 32.1 ± 58.6 pg/g HFLC (n=7)) and adiponectin (14.3 ± 71.4 ng/g LFHC (n=14) and 7.76 ± 62.9 ng/g HFLC (n=8)) from isolated adipose tissue did not differ between diet groups after weight loss.
Table 4.
Mean change in serum concentrations of inflammatory markers after the 12-week study period by diet group for all completers and subjects that lost greater than 5% body weight.
| All Completers | >5 % Weight Loss‡ | |||
|---|---|---|---|---|
| LFHC (n=15) | HFLC (n=18) | LFHC (n=8) | HFLC (n=14) | |
| hs-CRP (mg/L) | −0.19 ± 1.10 | −1.68 ± 2.78* | −0.36 ± 1.23 | −1.96 ± 2.76 |
| HMW Adiponectin (ng/ml) | −0.23 ± 0.80 | 0.30 ± 0.63 | −0.46 ± 0.94 | 0.39 ± 0.68§ |
| Total Adiponectin (ng/ml) | −0.18 ± 1.06 | 0.40 ± 0.66† | −0.50 ± 1.26 | 0.48 ± 0.64¶ |
| HMW:Total | ||||
| Adiponectin | −0.01 ± 0.12 | 0.01 ± 0.08 | −0.01 ± 0.14 | 0.02 ± 0.09 |
Data represent mean change from baseline ± SD. HMW, high molecular weight; hs-CRP, high sensitivity C-Reactive protein.
indicates significant difference between diet groups by ANCOVA, with age, % weight loss and baseline measure included as covariates P=0.03.
indicates significant difference between diet groups by ANCOVA, with age, % weight loss and baseline measure included as covariates, P=0.045.
The secondary analysis compares only those participants who reached a minimum of 5% weight loss (53% of LFHC completers and 78% of HFLC completers) and is included for informational purposes and to assist in future study design. It is not powered at 80% to find a significant difference between the two treatment groups. Significant difference between diets in mean change in measures by ANCOVA with baseline measure as covariate
(P=0.037) and
(P=0.032).
Discussion
We observed similar reductions in percent body weight with the two dietary groups. However, the HFLC group had more favorable changes in blood lipids (lower triglycerides (marginally significant) and higher HDL) and reduced serum inflammation (lower hs-CRP and higher total adiponectin) after the 12 week intervention than the LFHC diet.
Dietary Intake
Total daily energy intake did not differ between diet groups, but the average intake was lower than anticipated for the weight loss achieved by both groups. It is well established that obese subjects underreport intake [20], but we do not believe this differed between diet groups as similar percent weight loss was achieved. Subjects in the both the HFLC and LFHC group consumed close to the recommended proportions of protein, carbohydrate and fat and these levels were similar to some, but not all previous studies [6,7,21–25]. Overall, the participants’ compliance to the recommended dietary intake was good and was most likely the result of the bi-weekly consultation with the study dietitian.
Weight Loss and Body Composition
We observed similar reductions in body weight between the two diet groups. However, a greater proportion of subjects that consumed the HFLC diet lost greater than 5% body weight. This suggests that those in the HFLC group were more compliant with the dietary guidelines and caloric restriction. Previous intervention studies have reported comparable reductions in body weight when subjects consumed hypocaloric LF or LC diets for 6 weeks to one year [24–27]. But several studies (4–24 week interventions) have also reported greater weight loss in overweight/obese subjects consuming hypocaloric HFLC diets compared to LFHC diets [4–7,21,22,28–30]. We also observed similar losses in lean and fat mass between LFHC and HFLC groups, which is supported by other interventions when similar weight loss was achieved between groups [23,24,27].
Glucose metabolism and insulin sensitivity
In the present study, we observed that when subjects lost similar weight there was no effect of diet on the change in fasting insulin or glucose, HbA1C or AUC for insulin or glucose. In contrast to our findings, Phillips et al reported that fasting insulin levels were reduced from baseline after consuming a LC diet for 4 and 6 weeks in obese subjects, with no changes in the LF group [25]. Additionally, overweight men and women had greater improvements in glycemic control and fasting glucose and insulin and insulin sensitivity on LC diets relative to LF diets [4,28]; however, greater weight loss was achieved in the LC diets relative to the LF diets, which may explain the improved glucose metabolism and insulin sensitivity.
Blood lipids
Similar to previous reports, we found that obese subjects that consumed the HFLC diet for 12 weeks had 23% lower triglyceride (unadjusted) and 11% higher HDL cholesterol concentrations, but these measures were unaffected in the LFHC diet despite similar caloric deficits. This suggests that the macronutrient composition, and not total calories, influences blood lipid parameters. In agreement with our findings, several previous studies have reported that LC diets lower serum triglycerides and raise HDL cholesterol [4,23–25,27,29]. We did observe higher baseline triglyceride levels in the HFLC diet that likely affected the change in triglycerides. We observed that after adjusting for age, sex, percent weight loss and baseline triglycerides, there was weak evidence of a difference between the two dietary groups in the change in triglycerides with weight loss in the HFLC (P=0.07). Carbohydrate restriction may improve dyslipidemia though lower hepatic VLDL secretion (lower triglycerides) [31] and possibly less hydrolysis of HDL by hepatic lipase resulting in higher HDL [32].
Serum and adipose tissue inflammation
In the present study, subjects that consumed the HFLC diet had improved blood markers of inflammation. It is well documented that the acute phase protein, hs-CRP, is associated with increased risk of cardiovascular disease [33]. In the present study, the HFLC group showed a significant reduction in serum concentrations of hs-CRP relative to the LFHC group, suggesting a beneficial effect of a LC diet on cardiovascular disease risk. On the other hand, high levels of serum total and HMW adiponectin have been associated with lower cardiovascular disease [34]. Adiponectin is an adipose tissue-derived mediator that has both insulin sensitizing and anti-inflammatory properties [35]. We observed higher total adiponectin concentrations when the HFLC diet was consumed. Although it has been well-documented that weight loss improves inflammation [36,37], there is little understanding or agreement on the role of carbohydrate restriction or macronutrient composition on inflammation. Some evidence indicates that higher fat diets, particularly high saturated fat diets, are associated with higher serum inflammatory markers [38] and higher protein diets may be beneficial to inflammation[39], although data in this area is very limited. In agreement with the present study, LC diets have been reported to improve systemic inflammation, including decreasing CRP and increasing adiponectin [3–5]. On the other hand, other studies have reported that weight loss, but not macronutrient content, improves systemic inflammation [24,26,40,40,41]; or that hypocaloric LF diets improve inflammation [6–8,42]. Taken together, our data indicates that the HFLC diet improves two inflammatory markers with well-documented associations to cardiovascular disease.
This is the first study to compare the effects of hypocaloric LFHC and HFLC diets on subcutaneous adipose tissue inflammation. Derangements in adipose tissue inflammation, including greater TNF-α and lower adiponectin secretion, are well documented in obesity and have been associated with increased risk of cardiometabolic disease [43]. We did not observe any significant changes in adiponectin or TNF-α secretion from isolated adipose tissue due to macronutrient content or weight loss. This may be due to the smaller sample size (not all subjects provided enough samples for the acute assay) and the high variability of the secretion assay. Similar to our results, it was reported that mRNA expression of adiponectin in adipose tissue was not affected by calorie restriction, while serum concentrations were increased [44]. However, several studies have shown that adipose tissue inflammation is improved by weight loss similar to that achieved in our study [11,12] and these factors have not been shown to be affected by macronutrient content [45,46]. Larger-scale studies are required to better understand the role of macronutrients in modifying adipose tissue inflammation during weight loss in obese individuals.
Strengths and Limitations
Our results strengthen the existing literature and offer new insight into the effects of a HFLC diet on inflammation. One of the major strengths of our study was that it was conducted in free-living adults and included bi-weekly visits with a registered dietitian. As such, our intervention is exemplary of realistic weight loss outside of the clinical research setting. We were also able to obtain adipose tissue biopsies from subjects; although the findings we presented were null we highlight an important research focus for future study.
There are a few limitations to the current study. First, our sample size was small and we had a high attrition rate, which limits our statistical power to do multiple comparisons. Our sample size calculation was based initially on FMD as the primary outcome. We estimated based on our previous work, that we would require 34 participants per group, powered at 80% (alpha=0.05) to detect a 20% change in FMD from baseline. We were only able to retain 15 subjects in the LFHC diet group and 18 participants in the HFLC group. However, the intention of this study was to collect data that could be used to further research in this area and provide a basis for a larger study. With the exception of body weight which did not differ significantly between groups when intention-to-treat analyses was performed, we did not obtain follow-up data on subjects that dropped out of the study.
Conclusion
Overall, subjects that consumed the HFLC diet were more likely to achieve the recommended 5–10% body weight over the 12 week intervention; however, mean weight loss did not differ significantly between the LFHC and the HFLC diet groups. Despite similar changes in body weight, subjects that consumed the HFLC diet had better improvements in serum HDL, hs-CRP and total adiponectin compared to obese subjects that consumed the LFHC. No significant changes in adipose tissue inflammation were observed; however, this may be partly due to our small sample size. This small scale study suggests that a LC diet may achieve healthier lipid profiles and a reduction in inflammation in obese free-living adults compared to a LF diet. Verification of these results in larger scale, long-term studies are necessary; however, our results suggest that free-living obese individuals may benefit most, possibly via improved inflammation, by following a reduced carbohydrate diet rather than a low fat diet.
Acknowledgments
We would like to thank Dr. Sherman Bigornia for his thoughtful input on the statistical analyses. We thank Amy Nahigyan for her help with the execution of this study. We would also like to acknowledge the hard work of the staff and nurses in the General Clinical Research Unit and the staff of the Coronary Health Unit for their assistance with this study, as well as the support of the Boston Nutrition Obesity Research Center Core.
Funding
This study was supported by a research grant from the Dr. Robert C. and Veronica Atkins Foundation to Dr. Apovian, as well as M01 RR000533 and U54 RR025771 to the Boston University Clinical and Translational Science Institute.
Abbreviations
- HFLC
high fat low carbohydrate
- LFHC
low fat high carbohydrate
- hs-CRP
high sensitivity-C-reactive protein
- HDL
high density lipoprotein
- LDL
low density lipoprotein
- HMW
high molecular weight
- TNF-α
tumor necrosis factor-alpha
- BMI
body mass index
- HbA1C
hemoglobin A1C
- DXA
dual energy x-ray absorptiometry
- FMD
flow mediated dilation
- ELISA
enzyme-linked immunosorbent assay
- OGTT
oral glucose tolerance test
- HOMA-IR
homeostatic model assessment-insulin resistance
- AUC
area under the curve
Footnotes
Author Contributions
Dr. M.R. Ruth was involved in planning and execution of the study, sample collection and analyses, statistical analyses and wrote the manuscript with the assistance of the coauthors. Dr. A.M. Port was involved in the planning and execution of the study, adipose tissue collection and analyses and provided critical feedback on the written manuscript. Ms. A Bourland and Ms. M Shah (research dietitian) were involved in the execution of the study and provided critical feedback on the written manuscript. Dr. N Istfan was involved in the statistical analyses and provided assistance with manuscript preparation and feedback. Dr. K Nelson provided statistical advice and provided feedback on the manuscript. Dr. N Gokce was involved in the planning and execution of the study, analyzed the FMD data, and provided critical feedback of the manuscript. Dr. C Apovian is the principal investigator of this study and was involved in all aspects of the study planning, implementation, data analyses and manuscript preparation.
Disclosure Statement
M.R. Ruth, M. Shah, A.M. Port, A.C. Bourland, N.W. Istfan, K. Nelson and N. Gokce have no competing interests. C.M. Apovian has served on the advisory boards for Allergan, Amylin, Orexigen, Merck, Johnson and Johnson, Abbott, Arena, Zafgen, Novo Nordisk and Sanofi-Aventis, and has received research funding from Lilly, Amylin, Pfizer, Sanofi-Aventis, Orexigen, MetaProteomics, and the Dr. Robert C. and Veronica Atkins Foundation.
Publisher's Disclaimer: This is a PDF file of an unedited manuscript that has been accepted for publication. As a service to our customers we are providing this early version of the manuscript. The manuscript will undergo copyediting, typesetting, and review of the resulting proof before it is published in its final citable form. Please note that during the production process errors may be discovered which could affect the content, and all legal disclaimers that apply to the journal pertain.
Reference List
- 1.WHO. Obesity and Overweight Fact Sheet. World Health Organization; May 1, 2012. [October 2012]. Assessed at http://www.who.int/mediacentre/factsheets/fs311/en/index.html on. [Google Scholar]
- 2.Santos FL, Esteves SS, da Costa PA, et al. Systematic review and meta-analysis of clinical trials of the effects of low carbohydrate diets on cardiovascular risk factors. Obes Rev. 2012;13:1048–66. doi: 10.1111/j.1467-789X.2012.01021.x. [DOI] [PubMed] [Google Scholar]
- 3.Seshadri P, Iqbal N, Stern L, et al. A randomized study comparing the effects of a low-carbohydrate diet and a conventional diet on lipoprotein subfractions and C-reactive protein levels in patients with severe obesity. Am J Med. 2004;117:398–405. doi: 10.1016/j.amjmed.2004.04.009. [DOI] [PubMed] [Google Scholar]
- 4.Forsythe CE, Phinney SD, Fernandez ML, et al. Comparison of low fat and low carbohydrate diets on circulating fatty acid composition and markers of inflammation. Lipids. 2008;43:65–77. doi: 10.1007/s11745-007-3132-7. [DOI] [PubMed] [Google Scholar]
- 5.Summer SS, Brehm BJ, Benoit SC, et al. Adiponectin changes in relation to the macronutrient composition of a weight-loss diet. Obesity (Silver Spring) 2011;19:2198–2204. doi: 10.1038/oby.2011.60. [DOI] [PubMed] [Google Scholar]
- 6.Rankin JW, Turpyn AD. Low carbohydrate, high fat diet increases C-reactive protein during weight loss. J Am Coll Nutr. 2007;26:163–169. doi: 10.1080/07315724.2007.10719598. [DOI] [PubMed] [Google Scholar]
- 7.Keogh JB, Brinkworth GD, Noakes M, et al. Effects of weight loss from a very-low-carbohydrate diet on endothelial function and markers of cardiovascular disease risk in subjects with abdominal obesity. Am J Clin Nutr. 2008;87:567–576. doi: 10.1093/ajcn/87.3.567. [DOI] [PubMed] [Google Scholar]
- 8.Varady KA, Bhutani S, Klempel MC, et al. Improvements in vascular health by a low-fat diet, but not a high-fat diet, are mediated by changes in adipocyte biology. Nutr J. 2011;10:8. doi: 10.1186/1475-2891-10-8. [DOI] [PMC free article] [PubMed] [Google Scholar]
- 9.Bigornia SJ, Mott MM, Hess DT, et al. Long-term successful weight loss improves vascular endothelial function in severely obese individuals. Obesity (Silver Spring) 2010;18:754–759. doi: 10.1038/oby.2009.482. [DOI] [PMC free article] [PubMed] [Google Scholar]
- 10.Capel F, Klimcakova E, Viguerie N, et al. Macrophages and adipocytes in human obesity: adipose tissue gene expression and insulin sensitivity during calorie restriction and weight stabilization. Diabetes. 2009;58:1558–1567. doi: 10.2337/db09-0033. [DOI] [PMC free article] [PubMed] [Google Scholar]
- 11.Clement K, Viguerie N, Poitou C, et al. Weight loss regulates inflammation-related genes in white adipose tissue of obese subjects. FASEB J. 2004;18:1657–1669. doi: 10.1096/fj.04-2204com. [DOI] [PubMed] [Google Scholar]
- 12.Varady KA, Tussing L, Bhutani S, et al. Degree of weight loss required to improve adipokine concentrations and decrease fat cell size in severely obese women. Metabolism. 2009;58:1096–1101. doi: 10.1016/j.metabol.2009.04.010. [DOI] [PubMed] [Google Scholar]
- 13.van Dijk SJ, Feskens EJ, Bos MB, et al. A saturated fatty acid-rich diet induces an obesity-linked proinflammatory gene expression profile in adipose tissue of subjects at risk of metabolic syndrome. Am J Clin Nutr. 2009;90:1656–1664. doi: 10.3945/ajcn.2009.27792. [DOI] [PubMed] [Google Scholar]
- 14.Lichtenstein AH, Appel LJ, Brands M, et al. Diet and lifestyle recommendations revision 2006: a scientific statement from the American Heart Association Nutrition Committee. Circulation. 2006;114:82–96. doi: 10.1161/CIRCULATIONAHA.106.176158. [DOI] [PubMed] [Google Scholar]
- 15.Mifflin MD, St Jeor ST, Hill LA, et al. A new predictive equation for resting energy expenditure in healthy individuals. Am J Clin Nutr. 1990;51:241–247. doi: 10.1093/ajcn/51.2.241. [DOI] [PubMed] [Google Scholar]
- 16.Apovian CM, Bigornia S, Mott M, et al. Adipose macrophage infiltration is associated with insulin resistance and vascular endothelial dysfunction in obese subjects. Arterioscler Thromb Vasc Biol. 2008;28:1654–1659. doi: 10.1161/ATVBAHA.108.170316. [DOI] [PMC free article] [PubMed] [Google Scholar]
- 17.Fried SK, Bunkin DA, Greenberg AS. Omental and subcutaneous adipose tissues of obese subjects release interleukin-6: depot difference and regulation by glucocorticoid. J Clin Endocrinol Metab. 1998;83:847–850. doi: 10.1210/jcem.83.3.4660. [DOI] [PubMed] [Google Scholar]
- 18.Seltzer HS, Allen EW, Herron AL, Jr, et al. Insulin secretion in response to glycemic stimulus: relation of delayed initial release to carbohydrate intolerance in mild diabetes mellitus. J Clin Invest. 1967;46:323–335. doi: 10.1172/JCI105534. [DOI] [PMC free article] [PubMed] [Google Scholar]
- 19.Konrady AO, Kasherininov YR, Shavarov AA, et al. How can we block sympathetic overactivity? Effects of rilmenidine and atenolol in overweight hypertensive patients. J Hum Hypertens. 2006;20:398–406. doi: 10.1038/sj.jhh.1002004. [DOI] [PubMed] [Google Scholar]
- 20.Lissner L, Heitmann BL, Bengtsson C. Population studies of diet and obesity. Br J Nutr. 2000;83 (Suppl 1):S21–S24. doi: 10.1017/s000711450000091x. [DOI] [PubMed] [Google Scholar]
- 21.Brehm BJ, Seeley RJ, Daniels SR, et al. A randomized trial comparing a very low carbohydrate diet and a calorie-restricted low fat diet on body weight and cardiovascular risk factors in healthy women. J Clin Endocrinol Metab. 2003;88:1617–1623. doi: 10.1210/jc.2002-021480. [DOI] [PubMed] [Google Scholar]
- 22.Volek JS, Ballard KD, Silvestre R, et al. Effects of dietary carbohydrate restriction versus low-fat diet on flow-mediated dilation. Metabolism. 2009;58:1769–1777. doi: 10.1016/j.metabol.2009.06.005. [DOI] [PubMed] [Google Scholar]
- 23.Foster GD, Wyatt HR, Hill JO, et al. Weight and metabolic outcomes after 2 years on a low-carbohydrate versus low-fat diet: a randomized trial. Ann Intern Med. 2010;153:147–157. doi: 10.1059/0003-4819-153-3-201008030-00005. [DOI] [PMC free article] [PubMed] [Google Scholar]
- 24.Brinkworth GD, Noakes M, Buckley JD, et al. Long-term effects of a very-low-carbohydrate weight loss diet compared with an isocaloric low-fat diet after 12 mo. Am J Clin Nutr. 2009;90:23–32. doi: 10.3945/ajcn.2008.27326. [DOI] [PubMed] [Google Scholar]
- 25.Phillips SA, Jurva JW, Syed AQ, et al. Benefit of low-fat over low-carbohydrate diet on endothelial health in obesity. Hypertension. 2008;51:376–382. doi: 10.1161/HYPERTENSIONAHA.107.101824. [DOI] [PMC free article] [PubMed] [Google Scholar]
- 26.Wycherley TP, Brinkworth GD, Keogh JB, et al. Long-term effects of weight loss with a very low carbohydrate and low fat diet on vascular function in overweight and obese patients. J Intern Med. 2010;267:452–461. doi: 10.1111/j.1365-2796.2009.02174.x. [DOI] [PubMed] [Google Scholar]
- 27.Bradley U, Spence M, Courtney CH, et al. Low-fat versus low-carbohydrate weight reduction diets: effects on weight loss, insulin resistance, and cardiovascular risk: a randomized control trial. Diabetes. 2009;58:2741–2748. doi: 10.2337/db09-0098. [DOI] [PMC free article] [PubMed] [Google Scholar]
- 28.Volek JS, Sharman MJ, Gomez AL, et al. Comparison of a very low-carbohydrate and low-fat diet on fasting lipids, LDL subclasses, insulin resistance, and postprandial lipemic responses in overweight women. J Am Coll Nutr. 2004;23:177–184. doi: 10.1080/07315724.2004.10719359. [DOI] [PubMed] [Google Scholar]
- 29.Foster GD, Wyatt HR, Hill JO, et al. A randomized trial of a low-carbohydrate diet for obesity. N Engl J Med. 2003;348:2082–2090. doi: 10.1056/NEJMoa022207. [DOI] [PubMed] [Google Scholar]
- 30.Yancy WS, Jr, Olsen MK, Guyton JR, et al. A low-carbohydrate, ketogenic diet versus a low-fat diet to treat obesity and hyperlipidemia: a randomized, controlled trial. Ann Intern Med. 2004;140:769–777. doi: 10.7326/0003-4819-140-10-200405180-00006. [DOI] [PubMed] [Google Scholar]
- 31.Uebanso T, Taketani Y, Fukaya M, et al. Hypocaloric high-protein diet improves fatty liver and hypertriglyceridemia in sucrose-fed obese rats via two pathways. Am J Physiol Endocrinol Metab. 2009;297:E76–E84. doi: 10.1152/ajpendo.00014.2009. [DOI] [PubMed] [Google Scholar]
- 32.Samaha FF, Foster GD, Makris AP. Low-carbohydrate diets, obesity, and metabolic risk factors for cardiovascular disease. Curr Atheroscler Rep. 2007;9:441–447. doi: 10.1007/s11883-007-0059-7. [DOI] [PubMed] [Google Scholar]
- 33.Kaptoge S, Di AE, Lowe G, et al. C-reactive protein concentration and risk of coronary heart disease, stroke, and mortality: an individual participant meta-analysis. Lancet. 2010;375:132–140. doi: 10.1016/S0140-6736(09)61717-7. [DOI] [PMC free article] [PubMed] [Google Scholar]
- 34.Pischon T, Hu FB, Girman CJ, et al. Plasma total and high molecular weight adiponectin levels and risk of coronary heart disease in women. Atherosclerosis. 2011;219:322–329. doi: 10.1016/j.atherosclerosis.2011.07.011. [DOI] [PMC free article] [PubMed] [Google Scholar]
- 35.Ziemke F, Mantzoros CS. Adiponectin in insulin resistance: lessons from translational research. Am J Clin Nutr. 2010;91:258S–261S. doi: 10.3945/ajcn.2009.28449C. [DOI] [PMC free article] [PubMed] [Google Scholar]
- 36.Lira FS, Rosa JC, Dos Santos RV, et al. Visceral fat decreased by long-term interdisciplinary lifestyle therapy correlated positively with interleukin-6 and tumor necrosis factor-alpha and negatively with adiponectin levels in obese adolescents. Metabolism. 2011;60:359–365. doi: 10.1016/j.metabol.2010.02.017. [DOI] [PubMed] [Google Scholar]
- 37.Valsamakis G, McTernan PG, Chetty R, et al. Modest weight loss and reduction in waist circumference after medical treatment are associated with favorable changes in serum adipocytokines. Metabolism. 2004;53:430–434. doi: 10.1016/j.metabol.2003.11.022. [DOI] [PubMed] [Google Scholar]
- 38.Calder PC, Ahluwalia N, Brouns F, et al. Dietary factors and low-grade inflammation in relation to overweight and obesity. Br J Nutr. 2011;106 (Suppl 3):S5–78. doi: 10.1017/S0007114511005460. [DOI] [PubMed] [Google Scholar]
- 39.Basu A, Devaraj S, Jialal I. Dietary factors that promote or retard inflammation. Arterioscler Thromb Vasc Biol. 2006;26:995–1001. doi: 10.1161/01.ATV.0000214295.86079.d1. [DOI] [PubMed] [Google Scholar]
- 40.Sharman MJ, Volek JS. Weight loss leads to reductions in inflammatory biomarkers after a very-low-carbohydrate diet and a low-fat diet in overweight men. Clin Sci (Lond) 2004;107:365–369. doi: 10.1042/CS20040111. [DOI] [PubMed] [Google Scholar]
- 41.Keogh JB, Brinkworth GD, Clifton PM. Effects of weight loss on a low-carbohydrate diet on flow-mediated dilatation, adhesion molecules and adiponectin. Br J Nutr. 2007;98:852–859. doi: 10.1017/S0007114507747815. [DOI] [PubMed] [Google Scholar]
- 42.Camhi SM. Potential mechanisms linking low-fat diet to inflammation and metabolic syndrome. Metabolism. 2010;59:455–456. doi: 10.1016/j.metabol.2009.10.008. [DOI] [PMC free article] [PubMed] [Google Scholar]
- 43.Hotamisligil GS. Inflammation and metabolic disorders. Nature. 2006;444:860–867. doi: 10.1038/nature05485. [DOI] [PubMed] [Google Scholar]
- 44.Behre CJ, Gummesson A, Jernas M, et al. Dissociation between adipose tissue expression and serum levels of adiponectin during and after diet-induced weight loss in obese subjects with and without the metabolic syndrome. Metabolism. 2007;56:1022–1028. doi: 10.1016/j.metabol.2007.03.010. [DOI] [PubMed] [Google Scholar]
- 45.Arvidsson E, Viguerie N, Andersson I, et al. Effects of different hypocaloric diets on protein secretion from adipose tissue of obese women. Diabetes. 2004;53:1966–1971. doi: 10.2337/diabetes.53.8.1966. [DOI] [PubMed] [Google Scholar]
- 46.Capel F, Viguerie N, Vega N, et al. Contribution of energy restriction and macronutrient composition to changes in adipose tissue gene expression during dietary weight-loss programs in obese women. J Clin Endocrinol Metab. 2008;93:4315–4322. doi: 10.1210/jc.2008-0814. [DOI] [PubMed] [Google Scholar]