

Abstract
It is generally believed that cerebellar granule neurons originate exclusively from granule neuron precursors (GNPs) in the external germinal layer (EGL). Here we identify a rare population of neuronal progenitors in mouse developing cerebellum that expresses Nestin. Although Nestin is widely considered a marker for multipotent stem cells, these Nestin-expressing progenitors (NEPs) are committed to the granule neuron lineage. Unlike conventional GNPs, which reside in the outer EGL and proliferate extensively, NEPs reside in the deep part of the EGL and are quiescent. Expression profiling reveals that NEPs are distinct from GNPs, and in particular, express markedly reduced levels of genes associated with DNA repair. Consistent with this, upon aberrant activation of Sonic hedgehog (Shh) signaling, NEPs exhibit more severe genomic instability and give rise to tumors more efficiently than GNPs. These studies identify a novel progenitor for cerebellar granule neurons and a novel cell of origin for medulloblastoma.
Introduction
Nestin, a type IV intermediate filament protein, was first identified in multipotent neural stem cells (NSCs)1. Since then, Nestin has been widely used as a marker for NSCs in various regions of the nervous system. It is generally believed that as NSCs differentiate into lineage-restricted progenitors, Nestin is replaced by neurofilament and glial fibrillary acidic protein (GFAP) in neurons and glial cells, respectively2. These events may reflect temporal and spatial control of intermediate filament expression, facilitating changes in cellular shape and migratory potential. However, several studies have suggested that not all Nestin-expressing cells are NSCs, some being lineage-committed neuronal and glial progenitors3–4. Furthermore, recent studies have suggested that Nestin expression is not limited to the nervous system: for example, Nestin-positive cells have been described in skin, pancreas and kidney5. These studies suggest that Nestin cannot be unambiguously interpreted as a marker for NSCs.
In the cerebellum, Nestin expression has been well documented in both NSCs and radial (Bergmann) glia6–9. However, expression of Nestin in granule neuron precursors (GNPs) has been controversial. While some reports have suggested that Nestin expression is extinguished before cells commit to the granule lineage10, others have suggested that GNPs can be Nestin positive11–13. In part, these discrepancies may be due to the fact that the external germinal layer (EGL) where GNPs reside is traversed by the processes of Bergmann glia, making it difficult to distinguish Nestin-positive cells from Nestin-positive fibers. In many studies, animals that express Cre recombinase under the control of the Nestin promoter have been used to target GNPs14–15. However, it is not known whether recombination occurs in GNPs themselves, or in the NSCs that give rise to them.
In this study, we have identified a novel population of progenitors in the developing cerebellum that express high levels of Nestin. Despite lacking the canonical GNP lineage marker Math1, these Nestin-expressing progenitors (NEPs) are committed to the granule neuron lineage. NEPs are distinct from conventional GNPs in terms of location, proliferative status and gene expression. In particular, genes associated with DNA repair are under-expressed in NEPs compared with GNPs. After activation of Shh signaling, NEPs exhibit more severe genomic instability and give rise to medulloblastoma more efficiently than GNPs. Our studies therefore identify a unique population of neuronal progenitors in the developing cerebellum, and suggest that the intrinsic properties of the cell of origin can serve as predisposing factors for tumorigenesis.
Results
1. A rare cell population in cerebellar EGL expresses Nestin
In the cerebellum, Nestin expression has been well described in both NSCs and Bergmann glia6–9. However, whether GNPs express Nestin still remains unresolved.
To evaluate Nestin expression in the developing cerebellum, we first performed immunohistochemical staining using anti-Nestin antibodies. Nestin protein was readily detected in the cerebellum at P4 (Fig. 1a). However, the fact that Nestin protein is distributed both in the cytoplasm and on cell fibers makes it difficult to clearly distinguish Nestin-expressing cells based on immunostaining. To circumvent this limitation, we utilized Nestin-CFP transgenic mice, which express a nuclear-localized form of CFP in Nestin-positive cells16. This protein does not label fibers, and therefore makes it easy to identify the cell bodies of Nestin-expressing cells. In the Nestin-CFP cerebellum at P4, at least three populations of cells were found to be CFP+ (Fig. 1b). Consistent with previous reports6,8, CFP+ cells included Bergmann glia in the molecular layer (S100β+, Fig. 1c) and NSCs in the white matter (Musashi+, Fig. 1d). In addition, a small population of cells in the EGL was found to express the Nestin-CFP transgene (Fig. 1e). As shown in Fig. 1f, all the CFP+ cells in the EGL (NEPs) were negative for Math1, a well-characterized marker for GNPs17. In addition, Math1 positive GNPs reside in the superficial part of the EGL, whereas NEPs are predominantly localized in the deep EGL of the developing cerebellum (Fig. 1f). These data suggest that NEPs may represent a novel cell population distinct from conventional GNPs. In Nestin-CFP transgenic mice, NEPs were only found in the cerebellum during early development (E16.5–P15). At embryonic day 14.5 (E14.5), no Nestin expressing cells were detected in the EGL (Supplementary Fig. 1a) or in the rhombic lip (Supplementary Fig. 1b) where GNPs originate10. NEPs were first detected in the EGL at E16.5 (Supplementary Fig. 1c–d), and were not found in the postnatal cerebellum at P21 (Supplementary Fig. 1e). These data indicate that NEPs are a transient population that exists only during early cerebellar development.
Figure 1. Identification and purification of NEPs in the developing cerebellum.
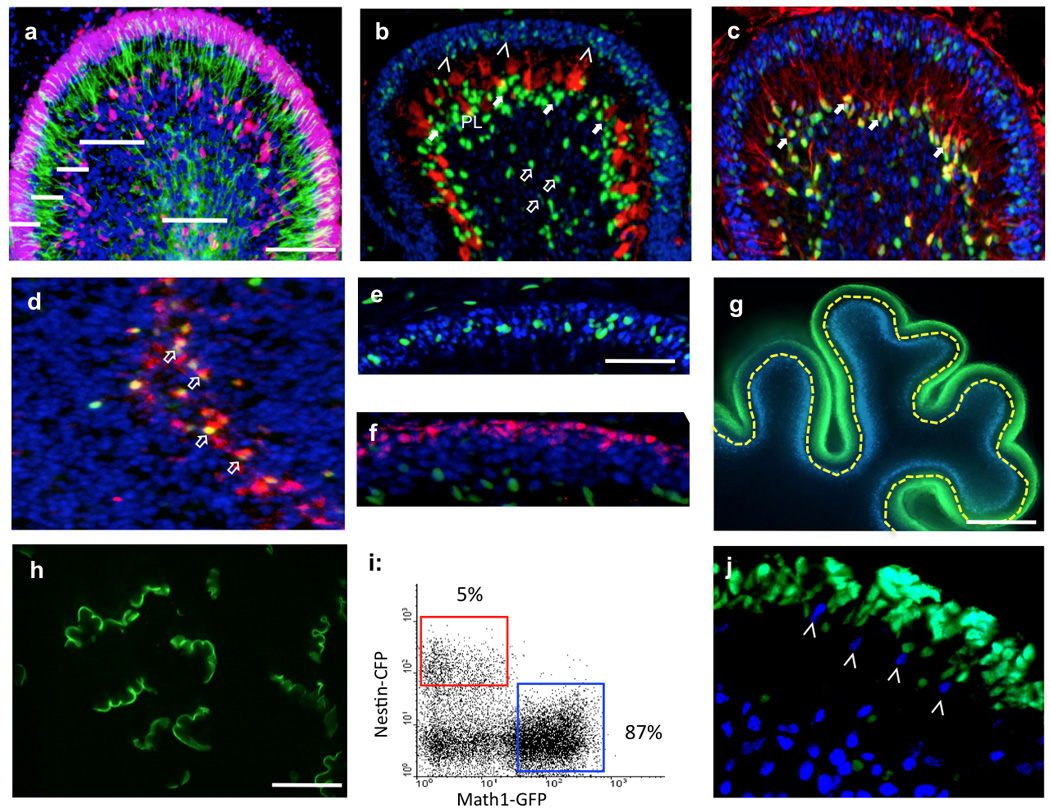
(a) Cerebellar section from a wild type mouse at P4 was immunostained with antibodies against Nestin (green) and Ki67 (red). (b–f) Sections from Nestin-CFP cerebellum at P4 were stained with antibodies against CFP (green, b–f), Calbindin (red, b), S100β (red, c), Mushashi (red, d) and Math1 (red, f). CFP positive cells were found in the EGL (arrowheads), the molecular layer (ML, filled arrows) and the white matter (WM, unfilled arrows). (c–d) Bergmann glia in the molecular layer (S100β+, red, c) and NSCs in the white matter (Musashi+, red, d) are both positive for CFP while GNPs in the EGL (Math1+, red, f) are not. (g) Cerebellar slices prepared from Math1-GFP/Nestin-CFP animals at P4 were microdissected as shown along the yellow dotted line and dissected EGLs were collected for tissue dissociation (h). (i) Cells harvested from dissociated EGLs (h) were analyzed by flow cytometry to detect GFP and CFP. (j) Cerebellar section prepared from Math1-GFP/Nestin-CFP mouse at P4 was imaged with confocal microscopy (GFP, green; CFP, blue). NEPs (arrowheads) were distinct from GFP+ GNPs. Cerebellar regions are labeled in a–f and j. Sections in a–f were counterstained with DAPI (blue). Scale bars: a–d (200µm); e–f, and j (100µm); g (400µm); h (2mm).
To further characterize NEPs in the EGL, we sought to purify these cells. For this purpose, we crossed Nestin-CFP mice with Math1-GFP mice, in which conventional GNPs exclusively express green fluorescent protein18. We then prepared sagittal cerebellar slices from P4 Math1-GFP/Nestin-CFP mice (Fig. 1g), and micro-dissected cerebellar EGLs under a fluorescence microscope to exclude the Nestin+ cells in the molecular layer and the white matter (Fig. 1g). Dissected EGLs (Fig. 1h) were then dissociated and analyzed by flow cytometry to detect expression of GFP and CFP. As shown in Figure 1i, the majority of cells in the EGL are positive for GFP, indicating that cerebellar EGL is dominated by Math1+ GNPs. Approximately 3–5% of cells in the EGL express Nestin-CFP, which is consistent with our immunohistochemical staining of cerebellar sections (Fig. 1b). Almost none of the cells were double-positive for GFP and CFP based on the flow cytometric analysis (Fig. 1i). Using confocal microscopy, we further confirmed that GFP+ GNPs and CFP+ NEPs are mutually exclusive in the EGL of Math1-GFP/Nestin-CFP mice at P4 (Fig. 1j). These data suggest that NEPs and GNPs are two distinct cell populations in the postnatal EGL. As a control, we also dissected the white matter from the cerebellum of Math1-GFP/Nestin-CFP mice (Supplementary Fig. 2a–b). FACS analysis (Supplementary Fig. 2c–e) indicated that more than 18% of cells in the white matter are positive for Nestin-CFP and 35% of Nestin-expressing cells expressed Prominin1, a marker for NSCs19, suggesting that at least some of the Nestin+ cells in the white matter are NSCs.
To determine whether the CFP and GFP fluorescence in the Nestin-CFP/Math1-GFP cerebellum faithfully reflects the expression of endogenous Nestin and Math1 proteins, we examined FACS-sorted CFP+ cells and GFP+ cells by immunocytochemistry. As shown in Supplementary Figure 3a–c, all GFP+ cells isolated from the EGL in Nestin-CFP/Math1-GFP animals at P4 were positive for Math1, but lacked Nestin protein (Supplementary Fig. 3d). Similarly, Nestin protein was detected in the cytoplasm of all sorted CFP+ cells (Supplementary Fig. 3e–g), which lacked Math1 protein (Supplementary Fig. 3h). These data suggest that NEPs and GNPs can be purified from Nestin-CFP/Math1-GFP cerebellum by microdissection followed by FACS.
2. NEPs are committed to the granule neuron lineage
Since Nestin is commonly used as a marker for NSCs, we examined whether NEPs isolated from the EGL might represent NSCs. NSCs from many parts of the central nervous system proliferate and form macroscopic neurospheres when cultured in the presence of growth factors such as EGF and bFGF20. To examine the capacity of NEPs to form neurospheres in culture, we purified NEPs and GNPs from the EGL of P4 Nestin-CFP/Math1-GFP cerebellum, and cultured them at clonal density in the presence of bFGF and EGF. NSCs (Prominin1+, Lin− cells) isolated from the same cerebellum as previously described6 were also cultured as controls. After 7 days, neurospheres were readily detectable in cultures of NSCs (Fig. 2a), whereas almost no neurospheres were generated from NEPs and GNPs (Fig. 2b). These data indicate that unlike NSCs, NEPs have a limited capacity to form neurospheres in vitro.
Figure 2. Neuronal lineage commitment of NEPs in vivo and in vitro.
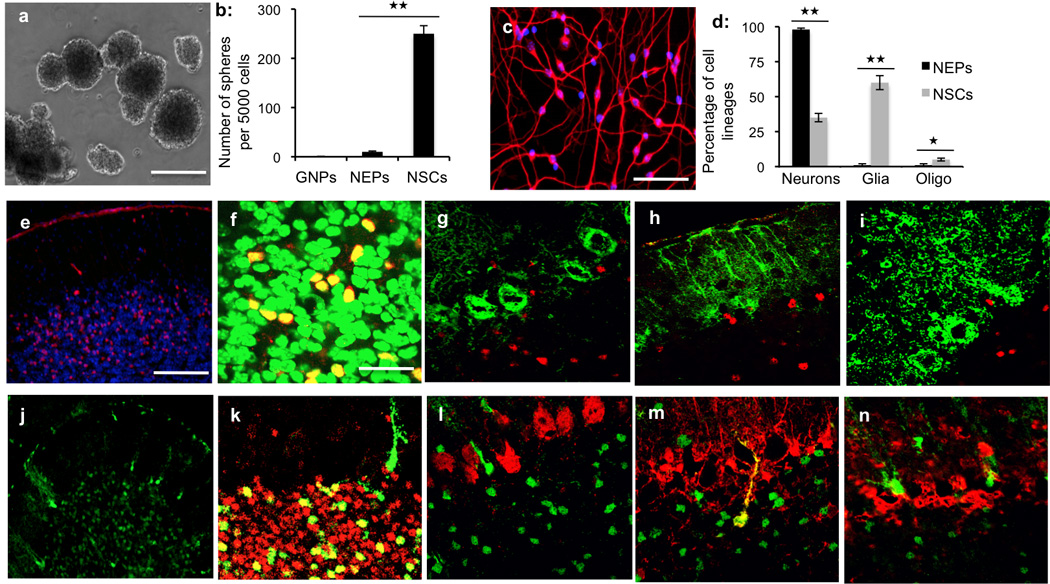
(a) Neurospheres were generated from NSCs (Prominin1+, Lin− cells) in the presence of EGF and bFGF. (b) The number of neurospheres per 5000 NSCs, GNPs and NEPs was counted after 7 days in culture under stem cell culture conditions. No spheres were generated from NEPs and GNPs. (c) After 4 days under differentiation conditions, NEPs were stained for β-tubulin (red) and counterstained with DAPI (blue). (d) The percentage of neurons (β-tubulin+), Bergmann glia (S100β+) and oligodendrocytes (O4+) was quantified after culturing NSCs and NEPs under differentiation culture conditions. NEPs exclusively differentiate into neurons in vitro. (e–i) NEPs isolated from P4 Nestin-CFP/Ds-Red animals were transplanted into the cerebellum of P4 CB17-SCID mice. At P21, the recipient cerebellum was sectioned and immunostained with the indicated antibodies. NEPs gave rise to only neurons after the transplantation. (j–n) Cerebellar sections from Nestin-CreERT2/R26R-GFP animals at P21 were immunostained with the indicated antibodies. Graphical data in b and d represent means of triplicate experiments ± SEM and significance determined with two-tailed Student’s t test. ★★P<0.01 and ★P<0.05 (b) NEPs vs NSCs, P=0.0015, df=2. (d) neurons derived from NEPs vs NSCs, P=0.00461; glia derived from NEPs vs NSCs, P=0.00431; oligodendrocytes derived from NEPs vs NSCs, P=0.0153. Scale bars: a (2mm); c, e and i (200µm); f–h and j–l (67µm).
Another important characteristic of NSCs is the ability to differentiate into multiple cell lineages including neurons, astrocytes and oligodendrocytes20. To examine whether NEPs exhibit multipotency, purified NEPs and NSCs were cultured under differentiation culture conditions. After 3 days in vitro, NSCs differentiated into neurons (βIII-tubulin+), astrocytes (S100β+) and oligodendrocytes (O4+) (Supplementary Fig. 4a–c). In contrast, NEPs exclusively gave rise to βIII-tubulin+ neurons (Fig. 2c). Fewer than 2% of cells in NEP cultures were Bergmann glia or oligodendrocytes (Fig. 2d). These data suggest that NEPs represent lineage-restricted neuronal progenitors rather than multipotent stem cells.
To further confirm the neuronal lineage commitment of NEPs, we examined their differentiation potential in vivo using intracranial transplantation assays. NEPs were purified from the EGL of P4 Nestin-CFP/Actin-Ds-Red animals (which express red fluorescent protein in all cells21), and then transplanted into the cerebellum of CB17/SCID animals at P4. No proliferation was detected among NEPs following the transplantation based the immunohistochemical staining for Ki67 (data not shown). At P21, recipient cerebella were sectioned to detect the differentiation of transplanted cells (Ds-red positive, Fig. 2e). As shown in Fig. 2f, all Ds-Red positive cells were positive for Zic1, a marker of cerebellar granule neurons22, and no Ds-Red+ Purkinje neurons (Calbindin+, Fig. 2g), Bergmann glial cells (S100β+, Fig. 2h) or interneurons (Parvalbumin+, Fig. 2i) were found in the recipient cerebellum. As a comparison, NSCs (Prominin1+, Lin−) purified from P4 Nestin-CFP/Ds-Red cerebellum were found to differentiate into neurons, Bergmann glia and Purkinje neurons following the transplantation (data not shown). These data confirm that NEPs are lineage-committed neuronal progenitors.
The studies above focused on the differentiation potential of NEPs following isolation. To determine the fate of NEPs in situ, we lineage-traced these cells by using a Nestin-CreERT2 mouse, in which expression of a tamoxifen-regulatable Cre recombinase is controlled by the Nestin enhancer23. Nestin-CreERT2 mice were crossed to ROSA26 reporter (R26R) mice expressing GFP preceded by a loxP-flanked stop sequence24. After tamoxifen treatment at P4, Nestin-CreERT2/R26R-GFP mice were sacrificed at P21 to locate the GFP+ cells in their cerebella by immunohistochemistry. 5–7% of the cells in the cerebellar internal granule layer (IGL) were found to be GFP+ (Fig. 2j). All of the GFP+ cells in the IGL expressed Zic1 (Fig. 2k). No Calbindin+ Purkinje neurons (Fig. 2l) or Parvalbumin+ interneurons (Fig. 2n) were found among GFP+ cells. GFP+ cells in the molecular layer were glial cells that expressed S100β (Fig. 2m), presumably originating from Bergman glial cells expressing Nestin at P4. Some GFP+ fibers remain on the surface of the Nestin-CreERT2/R26R-GFP cerebellum at P21. These fibers do not have cell nuclei, and are positive for S100β (Supplementary Fig. 5), suggesting that they represent end-feet of the Bergmann glial cells mentioned above. These data suggest that in addition to GNPs, NEPs also contribute to the genesis of granule neurons during cerebellar development.
3. NEPs and GNPs represent distinct lineages
It is generally believed that cerebellar granule neurons originate predominately from Math1+ GNPs in the EGL25. In the studies described above, we have demonstrated that NEPs also generate granule neurons. We therefore examined the possible lineage relationships between NEPs and GNPs. For this purpose, we crossed Math1-Cre/R26R-GFP mice, which have previously been used to lineage-trace conventional GNPs7,25, with Nestin-CFP animals. Cerebellar EGLs from these animals were microdissected at P4 and dissociated for FACS analysis. As shown in Figure 3a, 58% of cells in the EGL were GFP+, and around 4% of EGL cells at P4 were found to be CFP+. No double positive (GFP+ and CFP+) cell population was detected among EGL cells at P4 (Fig. 3a) or at later stages examined (P8–P15, data not shown). These results suggest that Math1+ GNPs do not give rise to NEPs during cerebellar development.
Figure 3. Lineage independence of NEPs and GNPs.
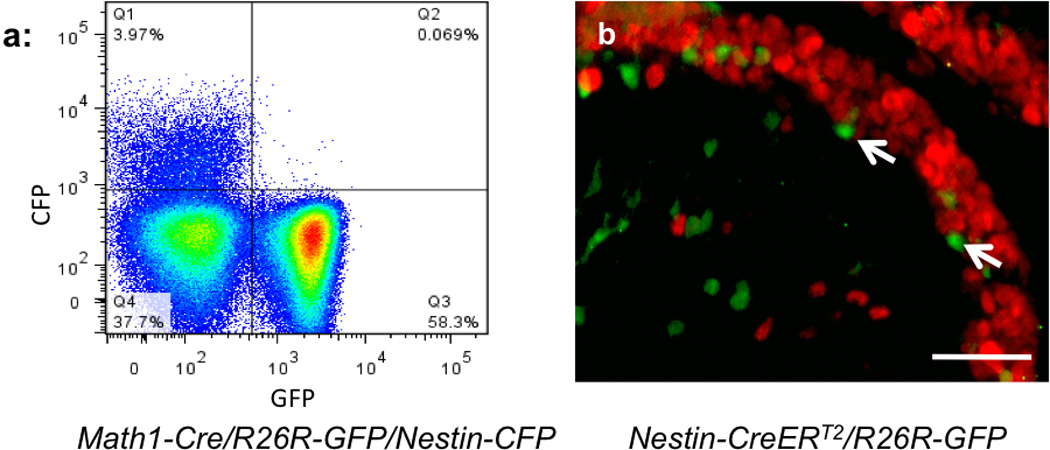
(a) Cells dissected from the EGL of Math1-Cre/R26R-GFP/Nestin-CFP mice at P4 were analyzed for GFP and CFP expression by flow cytometry. Note that no double positive cells (CFP+ GFP+) were found among the isolated EGL cells. (b) Nestin-CreERT2/R26R-GFP mice were treated with tamoxifen at P4 and analyzed at P8. Cerebella were sectioned and stained for GFP (green) and Math1 (red). GFP+ cells (arrows) were negative for Math1. Scale bar in b (200µm).
To determine whether NEPs can give rise to GNPs, we crossed Nestin-CreERT2 mice to R26R-GFP mice to lineage-trace NEPs in the postnatal cerebellum. Nestin-CreERT2/R26R-GFP animals were treated with tamoxifen at P4, and cerebella were harvested at P8 for immunostaining with antibodies against Math1 and GFP. As shown in Fig. 3b, Math1+ GNPs were preferentially located in the outer part of cerebellar EGL. No Math1+ GNPs were found to express GFP at P8, or at later developmental stages (P10–P21, data not shown), suggesting that GNPs do not derive from NEPs in the developing cerebellum. The above data indicate that NEPs and GNPs represent two independent cell lineages.
4. NEPs can proliferate in response to Sonic hedgehog
Shh protein, secreted by Purkinje neurons, is the major mitogen for GNPs in the EGL26. Since NEPs residing in the inner EGL are closer to the source of Shh than GNPs, they might be expected to show increased Shh signaling. To test this, we used quantitative PCR to measure expression of Shh pathway target genes (cyclinD1 and Gli1) in NEPs and GNPs purified from Math1-GFP/Nestin-CFP cerebellum at P4. As expected, very high levels of cyclinD1 and Gli1 were detected in GNPs (Fig. 4a), consistent with the fact that Shh signaling is occurring in these cells. Expression of cyclinD1 and Gli1 was markedly lower in NEPs than in GNPs, suggesting that the Shh pathway was less active in NEPs. We then examined the proliferation of NEPs in the EGL by immunostaining cerebella from P4 Nestin-CFP and Math1-GFP mice with Ki67 antibodies. As shown in Fig. 4b, the majority of Math1+ GNPs in the EGL were positive for Ki67, indicating that they are highly proliferative. In contrast, the majority of NEPs were Ki67-negative at P4 (Fig. 4c), and at all other stages examined (P0–P15, data not shown), suggesting that in contrast to GNPs, NEPs in the EGL are quiescent. Thus, despite being located proximal to the source of Shh (Purkinje neurons), NEPs do not appear to exhibit an active Shh signal pathway in vivo.
Figure 4. Shh-induced proliferation among NEPs.
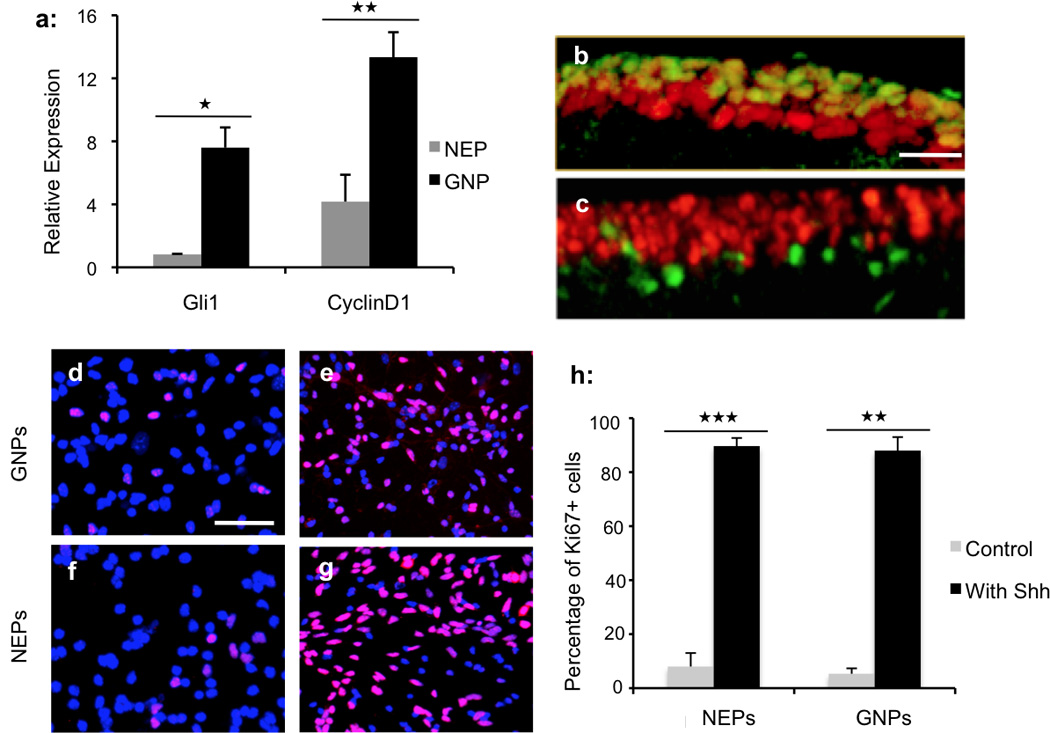
(a) Expression of Gli1 and cyclinD1 were examined in NEPs and GNPs from P4 Math1-GFP/Nestin-CFP cerebellum by quantitative PCR. Expression of both genes were normalized to actin expression. Expression of Gli1 and cyclinD1 was significantly down-regulated in NEPs compared with GNPs. (b) Cerebellar sections from P4 Math1-GFP mice were immunostained for GFP (green) and Ki67 (red). (c) Sections from P4 Nestin-CFP cerebellum were immunostained for CFP (green) and Ki67 (red). (d–g) Purified GNPs (d and e) and NEPs (f and g) were cultured in the absence (d and f) and presence (e and g) of Shh, and then immunostained for Ki67 (red) and counterstained with DAPI (blue). (h) Quantification of the percentage of Ki67+ cells in cultured NEPs and GNPs +/− Shh treatment. Both GNPs and NEPs increased their proliferation in response to Shh treatment. Graphical data in a and h represent means of triplicate experiments ± SEM and significance determined with two-tailed Student’s t test, ★★★P<0.001, ★★P<0.01, ★P<0.05. (a) NEP Gli1 vs GNP Gli1, P=0.0114; NEP CyclinD1 vs GNP CyclinD1, P=0.0038 (h) Proliferation of NEPs with Shh treatment vs control, P=0.00077; proliferation of GNPs with Shh treatment vs control, P=0.00177. Scale bars: b–c (100µm); d–g (200µm).
To test whether NEPs are capable of responding to Shh, we purified GNPs and NEPs from P4 Nestin-CFP/Math1-GFP cerebellum, treated them with recombinant Shh protein in vitro, and examined their proliferation by immunostaining for Ki67. In the absence of Shh, the majority of both GNPs and NEPs stop dividing and become Ki67-negative after 48 hrs in culture (Fig. 4d and 4f), indicating that both cell populations are, or become, quiescent in vitro without Shh treatment. Consistent with previous studies26,27, Shh dramatically increased the proliferation of GNPs (Fig. 4e and 4h), and surprisingly, proliferation of NEPs was also significantly increased in the presence of Shh (Fig. 4g–h). These data suggest that NEPs have the capacity to respond to Shh in vitro, although they remain quiescent in vivo.
5. DNA repair-associated genes are down-regulated in NEPs
The studies described above indicate that NEPs can give rise to granule neurons but are distinct from conventional GNPs. To determine the molecular basis for the difference between NEPs and GNPs, we performed gene expression analysis. RNA from NEPs, GNPs and NSCs purified from P4 Nestin-CFP/Math1-GFP cerebellum was subjected to microarray analysis using Affymetrix mouse 430 2.0 chips. We then performed principal components analysis (PCA), a statistical method that facilitates global comparison of gene expression among multiple samples. As shown in Fig. 5a, NEPs, GNPs and NSCs are well separated from one another, confirming that NEPs represent a unique progenitor population in the developing cerebellum.
Figure 5. Deficiency in DNA repair of NEPs.
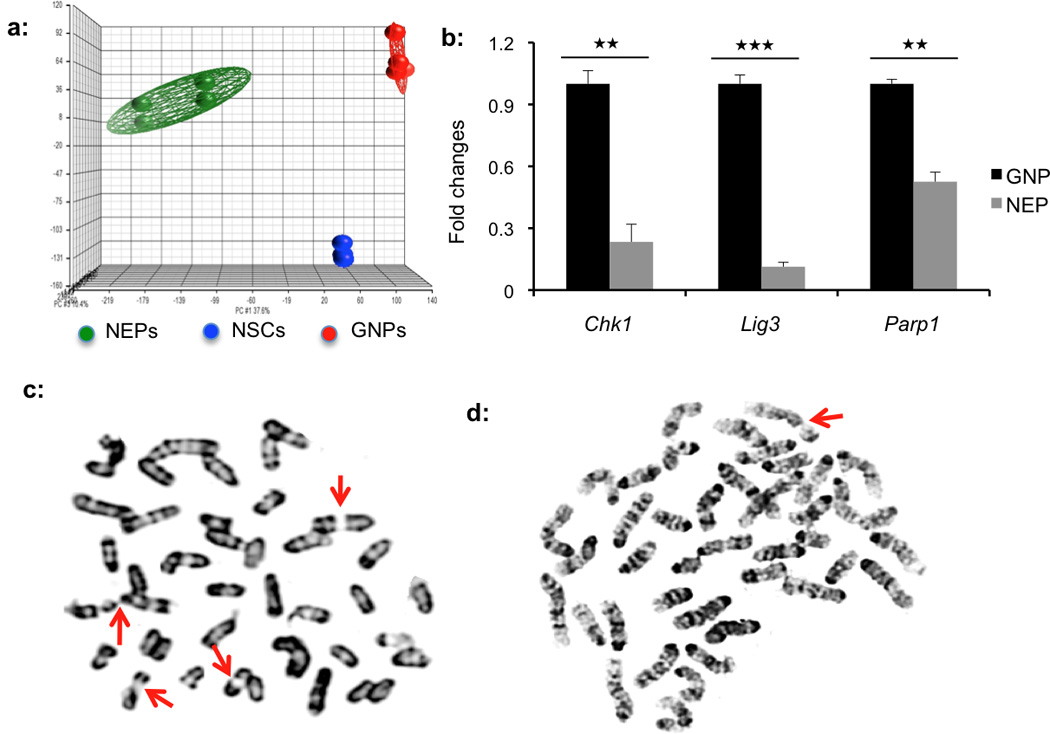
(a) Principal component analysis. Each sample is represented by a spot whose position in the grid reflects its overall expression profile. The distance between spots is proportional to the difference in gene expression. (b) Validation of differential expression of DNA repair genes including Chk1, Lig3 and Parp1 between NEPs and GNPs by quantitative PCR. Expression of all genes in NEPs is normalized to their relative expression in GNPs. (c and d) Representative image of metaphase spreads from Ptch1-deficient NEPs (c) and GNPs (d). Arrows show chromosomal breaks. NEPs exhibited more chromosomal alterations after Ptch1 deletion than GNPs. Graphic data in b represent means of triplicate experiments ± SEM and significance determined with two-tailed Student’s t test,. ★★★P<0.001, ★★P<0.01. Chk1 of NEPs vs GNPs, P=0.0041; Lig3 of NEPs vs GNPs, P=0.0002; Parp1 of NEPs vs GNPs, P=0.0031.
To gain insight into properties that distinguish NEPs and GNPs, we examined the genes differentially expressed between these two cell populations. Among the 45,101 probe sets on the arrays, 4,902 (10.87%) showed significant differences in expression (increased or decreased by ≥2-fold, false discovery rate < 0.01 by paired t test). Of those, 2,755 were higher in NEPs, and 2,147 were lower. Gene enrichment analysis using NexusExp3 software identified four major categories of genes that were differentially expressed between NEPs and GNPs (Table 1). Consistent with our observation that NEPs are normally quiescent in vivo, expression of genes associated with cell proliferation and cell cycle was markedly decreased in NEPs compared with GNPs. Cell adhesion and migration genes were also up-regulated in NEPs, in agreement with the known involvement of Nestin in cell migration5. Genes involved in neural cell fate commitment were up-regulated in NEPs relative to GNPs, consistent with the neuronal lineage restriction of NEPs. Finally, of 179 genes associated with DNA damage and repair, 62 (34.64%) were differentially expressed between NEPs and GNPs (P<0.001). All 62 genes were down-regulated in NEPs compared with GNPs. Reduced expression of several DNA repair associated genes in NEPs (including Chk1, Lig3 and Parp1) was validated by quantitative PCR (Fig. 5b).
Table 1.
Categories of Genes Differentially Expressed in NEPs versus GNPs
| Gene Name | Gene Symbol |
Log ratio |
Gene Function |
|---|---|---|---|
| Cell Cycle | |||
| E2F transcription factor 1 | E2F1 | −2.2 | Cell cycle control |
| Cyclin D1 | Ccnd1 | −2.0 | Cell cycle G1/S transition |
| Cyclin G2 | Ccng2 | −1.7 | Cell cycle control |
| Structural maintenance of chromosomes 2 | Smc2 | −1.7 | Chromatid cohesion and Chromosome condensation |
| Cell division cycle associated 5 | Cdca5 | −1.6 | Cell cycle G1/S transition |
| Cyclin-dependent kinase 6 | Cdk6 | −1.2 | G1 phase transition of cell cycle |
| DNA Damage/Repair | |||
| Breast cancer 1 | Brca1 | −1.9 | DNA damage response |
| Rad51 associated protein-1 | Rad51ap1 | −1.6 | DNA recombination and repair |
| Brca1/Brca2-containing complex, subunit 3 | Brcc3 | −1.1 | DNA damage and repair |
| Brca2 and Cdkn1a interacting protein | Bccip | −1.0 | DNA damage and repair |
| Checkpoint kinase 1 | Chek1 | −0.9 | DNA damage checkpoint and DNA repair |
| DNA ligase 3 | Lig3 | −0.6 | DNA recombination and repair |
| Poly (ADP-ribose) polymerase 1 | Parp1 | −0.5 | DNA repair |
| Cell Adhesion and Migration | |||
| Tenascin C | Tnc | 8.2 | Fibronectin binding |
| Procollagen, type 1, alpha 2 | Col1a2 | 6.7 | Extracellular matrix structural constituent |
| Vascular cell adhesion molecule 1 | Vcam1 | 6.4 | GPI anchor binding and protein binding |
| Neuropilin 1 | Nrp1 | 5.0 | Semaphorin receptor regulation |
| Developmentally down-regulated 9 | Nedd9 | 4.3 | Cell adhesion and protein binding |
| Neural cell adhesion molecule 2 | Ncam2 | 3.3 | GPI anchor binding |
| Protocadherin 17 | Pcdh17 | 2.6 | Calcium ion binding |
| Neural Fate Commitment | |||
| Pancreas specific transcription factor 1a | Ptf1a | 7.8 | Neural fate commitment |
| Neurogenin 2 | Neurog2 | 6.3 | Neural differentiation and lineage commitment |
| Neurogenin 1 | Neurog1 | 5.0 | Neural differentiation and lineage commitment |
| Notch gene homolog 1 | Notch1 | 4.5 | Notch1 signaling and fate commitment |
| SRY-box containing gene 6 | Sox6 | 4.3 | Neural lineage commitment |
| Sprouty homolog 2 | Spry2 | 2.9 | Cell fate commitment |
The quiescent status of cells, particularly stem cells, has been suggested to be an essential protective mechanism that minimizes endogenous stress caused by cellular respiration and DNA replication28. To determine whether the decreased expression of DNA repair-associated genes in NEPs is due to their quiescent status, we induced the proliferation of NEPs and GNPs by exposing them to recombinant Shh. After 48hrs, cells were harvested for quantitative PCR analysis. As shown in Supplementary Fig. 6, the expression of Chk1, Lig3 and Parp1 was significantly lower in proliferating NEPs than GNPs. These data suggest that decreased expression of DNA repair-associated genes in NEPs is independent of their quiescent state. The above results indicate that NEPs have a distinct genetic profile characterized by decreased expression of DNA repair-associated transcripts.
6. Proliferative stress causes DNA instability in NEPs
The cellular DNA repair machinery is critical for maintaining the genomic integrity that is constantly challenged by endogenous and exogenous stimuli29. The decreased expression of DNA repair genes in NEPs raises the possibility that these cells may be more susceptible to DNA damage in response to genotoxic agents and stress. Because hyper-proliferation can cause DNA-replication stress and genomic damage30, we compared the genomic alterations in hyper-proliferating NEPs and GNPs. For this purpose, we crossed Math1-GFP/Nestin-CFP mice with Ptch1C/C mice, in which the loxP flanked Patched1 (Ptch1) gene can be conditionally ablated in a Cre-dependent manner31. Ptch1 is an antagonist of the Shh signaling pathway, so Ptch1 deletion causes aberrant activation of Shh signaling and hyper-proliferation in both stem cells and progenitors in the nervous system7,32,33. NEPs and GNPs were purified from P4 Math1-GFP/Nestin-CFP/Ptch1C/C cerebella, and Ptch1 was deleted in these cells by infection with a lentivirus encoding Cre recombinase. 24hrs after infection, cells were pulse-labeled with BrdU for an additional 12 hrs and then harvested for analysis of BrdU incorporation by immunocytochemistry. Extensive and comparable proliferation was observed among Cre infected GNPs and NEPs (Supplementary Fig. 6c)7. We then harvested these two cell populations to perform metaphase spreading to test for the presence of chromosomal aberrations, which is the major form of genomic instability in mammalian cells34. As shown in Fig. 5c–d, more chromosome alterations including chromosomal breaks, centromere separation and pulverization were found in NEPs (62.96%) compared with GNPs (20.0%), suggesting that NEPs exhibit greater genomic instability after Ptch1 deletion (Supplementary Fig. 6d).
7. NEPs exhibit increased tumorigenic potential
It has been reported that genomic instability facilitates tumorigenesis in many cells including neuronal progenitors14,35. We have previously demonstrated that deletion of Ptch1 in GNPs causes medulloblastoma formation in mice7. The fact that Ptch1 deletion promotes proliferation and genomic instability in NEPs led us to postulate that NEPs may be more susceptible to oncogenic transformation after loss of Ptch1. To test this, we crossed Ptch1C/C mice, with Nestin-CreERT2 mice. For comparison, Ptch1 was also deleted in GNPs using Math1-CreERT2 mice7,25. Animals were treated with tamoxifen at P4, and cerebella were examined at P21, a time point at which wild-type GNPs have exited the cell cycle, differentiated and migrated inwards from the surface of the cerebellum (Fig. 6a). As reported previously7, large numbers of proliferating cells were found on the surface of the cerebellum in P21 Math1-CreERT2/Ptch1C/C animals (Fig. 6b). Far fewer ectopically proliferating cells were detected in the Nestin-CreERT2/Ptch1C/C cerebellum at P21 (Fig. 6c), consistent with the relatively small number of NEPs in the cerebellum at the time of tamoxifen treatment (NEPs account for only 3–5% of EGL cells at P4). Notably, both Nestin-CreERT2/Ptch1C/C animals and Math1-CreERT2/Ptch1C/C animals eventually develop tumors. These tumors resemble human medulloblastoma in terms of histology (Fig. 6d–f). Moreover, gene expression profiling did not reveal any significant differences between Nestin-CreERT2/Ptch1C/C and Math1-CreERT2/Ptch1C/C tumor cells (Supplementary Fig. 7). Thus, NEPs can also give rise to medulloblastoma after loss of Ptch1. Intriguingly, despite being far less abundant than GNPs, NEPs give rise to tumors with the same penetrance (100%) and latency as Math1+ GNPs (Fig. 6g). These findings suggest that on a per-cell basis, NEPs may be more prone to give rise to tumors than GNPs.
Figure 6. Increased tumorigenicity of NEPs after Ptch1 deletion.
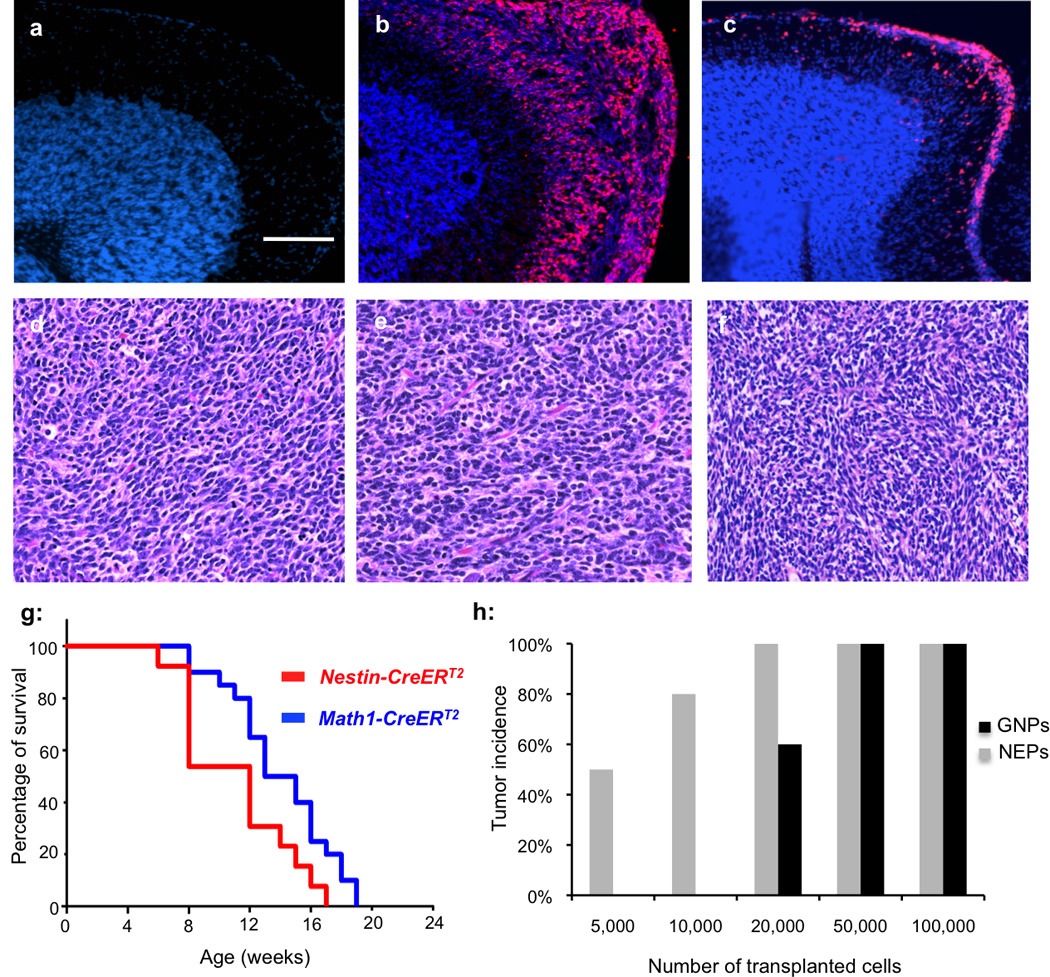
(a–c) Cerebellar sections prepared from P21 wild type mice (a), Math1-CreERT2/Ptch1C/C mice (b) and Nestin-CreERT2/Ptch1C/C mice (c) at P21, were immunostained for Ki67 (red) and counterstained with DAPI (blue). Note the ectopic lesions on the surface of the cerebellum after Ptch1 deletion. (d–f) H&E staining of paraffin-embedded tumor sections prepared from Math1-CreERT2/Ptch1C/C mice (d), Nestin-CreERT2/Ptch1C/C mice (e) and human medulloblastoma (f). Tumors from Math1-CreERT2/Ptch1C/C mice and Nestin-CreERT2/Ptch1C/C mice resemble human medulloblasotma in their histological properties. (g) Survival curve of Math1-CreERT2/Ptch1C/C mice and Nestin-CreERT2/Ptch1C/C mice after tamoxifen treatment at P4. Both NEPs and GNPs gave rise to tumors after Ptch1 deletion with 100% penetrence. (Mantel-Cox test, P=0.0283, n=12 for Nestin-CreERT2/Ptch1C/C mice, n=14 for Math1-CreERT2/Ptch1C/C mice.) (h) The tumor incidence in CB17SCID animals after transplantation with indicated number of Ptch1 deficient GNPs and NEPs. Scale bar: 200 µm.
To directly compare the tumorigenic potential of NEPs and GNPs, we performed limiting dilution transplantation assays. For this purpose, we generated Nestin-CreERT2/Nestin-CFP/Ptch1C/C mice and Math1-CreERT2/Math1-GFP/Ptch1C/C mice. After tamoxifen treatment of these animals at P4, EGLs were micro-dissected at P8. Ptch1-deleted NEPs and GNPs were isolated from the dissociated EGLs by FACS-sorting CFP+ and GFP+ cells, respectively. Comparable efficiency of Ptch1 deletion in the two purified cell populations was confirmed by quantitative PCR as previously described7 (Supplementary Fig. 8a–c). As shown in Fig. 6h and Supplementary Fig. 8d, transplantation of more than 50,000 NEPs or GNPs resulted in tumor formation in 100% of recipients. Transplantation of 20,000 GNPs resulted in tumors in 60% of recipients, whereas the same number of NEPs still generated tumors in 100% of recipients. Transplantation of fewer than 20,000 GNPs failed to cause tumor formation, but as few as 5000 NEPs generated medulloblastoma in 50% of recipients. These data confirm that NEPs have increased tumorigenic potential compared to GNPs.
Discussion
Nestin is widely considered a marker for NSCs in various regions of the nervous system, but is commonly lost as NSCs differentiate into lineage-restricted neuronal and glial progenitors2. Here we describe a previously unidentified population of Nestin-expressing cells in the EGL of the developing cerebellum. These cells do not exhibit stem cell properties such as neurosphere forming capacity and multipotency, and exclusively generate granule neurons. These data suggest that some neuronal progenitors retain Nestin expression during differentiation.
Although they are committed to the granule neuron lineage, NEPs are apparently distinct from conventional GNPs in that: 1) NEPs account for only 3–5% of the cells that can be isolated from the EGL, whereas GNPs account for over 90% of EGL cells; 2) NEPs do not express Math1, a transcription factor previously thought to be essential for specification of GNPs17; 3) NEPs reside in the deep part of the EGL, whereas GNPs are found in the superficial EGL; 4) GNPs proliferate extensively in the EGL, whereas NEPs migrate and differentiate without initial proliferating; 5) the expression profile of NEPs is distinct from that of GNPs. Together, these data suggest that NEPs represent a unique population of granule neuron progenitors. Previous studies have suggested that cerebellar granule neurons predominately originate from Math1-expressing GNPs25. However, our studies demonstrate that NEPs also contribute to the genesis of granule neurons. We have not observed any obvious phenotypic or morphological differences between granule neurons originating from NEPs and those arising from conventional GNPs, but further studies will be necessary to determine whether there are functional distinctions between these two populations.
The ability of NEPs to give rise to granule neurons despite their lack of Math1 expression is somewhat surprising. Math1 is highly expressed in GNPs located in the anterior rhombic lip as well as the outer part of the EGL17. The fact that Math1-null animals lack an EGL has often been interpreted to mean that Math1 is required for GNP regeneration. Our observation that NEPs can produce granule neurons suggests that Math1 is not absolutely required for specification or maintenance of granule neuron identity. Although our studies have revealed that NEPs and GNPs are mutually exclusive during cerebellar development, it is possible that NEPs and GNPs share a common cellular origin: NSCs in the ventricular zone15. It has been demonstrated that GNPs originate from progenitors in the rhombic lip10. However, no Nestin expressing cells were detected in the rhombic lip at embryonic stages (Supplementary Fig. 1), and NEPs are always found in the deep part of the EGL, implying that NEPs are not rhombic lip-derived progenitors. Other possible sources of NEPs include NSCs in the embryonic ventricular zone or postnatal white matter6, or astroglial cells in the EGL36.
A recent study identified a novel population of GFAP+ cells in the EGL by utilizing transgenic mice expressing Ds-Red driven by the human GFAP promoter36. hGFAP-dsRed+ cells were found to express Nestin, reside in the deep part of EGL and to give rise to granule neurons. However, 60% of GFAP+ cells were positive for Musashi1, and almost half of GFAP+ cells were Ki67+. Based on these immunostaining data, the authors concluded that GFAP+ cells in the EGL represent NSCs. In contrast, the NEPs identified in our study are quiescent and do not exhibit multipotency or the ability to form neurospheres. Given these differences, we believe that NEPs and GFAP+ cells in the EGL are distinct populations.
Shh is a potent mitogen for GNPs in the developing cerebellum. Despite residing in a Shh-enriched environment, NEPs do not express Shh target genes and do not proliferate in vivo. However, NEPs markedly increase their proliferation in response to Shh in vitro. These data suggest that NEPs have the capacity to respond to Shh signaling. The failure of NEPs to respond to Shh in vivo may be due to factors in the inner EGL that override the mitogenic effects of Shh. For example, pituitary adenylate cyclase activating polypeptide37, bone morphogenetic proteins38, FGF-239 and the extracellular matrix molecule vitronectin40 have all been shown to inhibit Shh-induced proliferation of GNPs. Further experiments will be necessary to delineate the contribution of these signals to the quiescent state of NEPs in vivo.
It has been reported that GNPs can give rise to medulloblastoma after aberrant activation of Shh signaling7,41. In this study, we have demonstrated that NEPs also have the capacity to initiate medulloblastoma formation after deletion of Ptch1. We did not find any significant differences between tumors arising from GNPs and those derived from NEPs based on thymidine incorporation, cell-cycle analysis, and gene expression profiling. These studies suggest that both NEPs and GNPs can represent cells of origin for Shh-associated medulloblastoma. Notably, expression of Shh in Nestin+ cells using the RCAS-TVA system also results in medulloblastoma12. Although previous studies suggested that these tumors were arising from GNPs, our studies raise the possibility that they may actually originate from NEPs.
Cell proliferation involves numerous processes that need to be tightly coordinated to ensure the preservation of genome integrity and to promote faithful genome propagation. Efficient and error-free DNA replication is critical for faithful replication of chromosomes before their segregation. Coordination of DNA replication with DNA-damage repair ensures genome integrity during cell division, thus preventing tumorigenic mutations. It has been reported that disruption of a DNA repair pathway has the potential to expedite tumorigenesis by resulting in a cell that is hypermutable42,43. In this study, we have demonstrated that NEPs exhibit more chromosomal aberrations after Ptch1 deletion than GNPs. In our previous studies, we have demonstrated that loss of Ptch1 alone is not sufficient to initiate tumor formation, and that additional epigenetic or genetic changes (“second hits”) are required to fully transform GNPs7,44. Comparable levels of proliferation of NEPs and GNPs following Ptch1 deletion (Figure 5c) indicate that the differential tumorigenic potential of these two cell populations is not solely due to Ptch1 deletion. Deficiency in DNA repair may give NEPs advantages in terms of accumulating the oncogenic mutations necessary for tumor initiation, and this may result in the increased tumorigenicity of NEPs following Ptch1 deletion.
The fact that NEPs exhibit increased genomic instability and increased tumorigenic potential is consistent with previous studies showing that genomic instability facilitates medulloblastoma formation in neuronal progenitors. Ionizing radiation significantly increases tumor incidence and accelerates medulloblastoma formation in Ptch1 heterozygous mice, suggesting that DNA damage predisposes to medulloblastoma tumorigenesis45,46. Moreover, inactivation of DNA repair-associated genes, including Lig4, Xrcc4 and Brca2 in cerebellar neuronal progenitors (using a Nestin-Cre transgene), has been reported to cause medulloblastoma formation in a p53-deficient background14,35,47. A very recent study has also shown that overexpression of Yes-associated protein (YAP) impairs DNA repair and increases medulloblastoma tumorigenesis in cerebellar neuronal progenitors48. Our observation that NEPs are already deficient in DNA repair suggests that these cells may be particularly prone to transformation and may represent cells of origin in some of the above tumor models.
It is common to think of oncogenic transformation as resulting from a series of mutations that endow a cell with increased genomic instability, unlimited proliferative capacity, decreased ability to undergo apoptosis and altered ability to interact with the microenvironment. However, our studies suggest that these properties may not necessarily be the result of somatic mutations, but instead, may represent intrinsic characteristics of cells at certain stages of development. Indeed, transgenic expression of the same oncogene or conditional deletion of the same tumor suppressor gene in different tissues under the control of tissue-specific promoters frequently results in significant variations in tumor initiating ability, phenotype, latency, and penetrance49. These examples highlight the critical role of the cellular context in determining whether and when tumorigenesis will take place in response to particular oncogenic stimuli. Identification of “tumor-prone” cell populations may provide critical insight into mechanisms of transformation and yield novel approaches to targeting cancer.
Methods
Animals
Ptch1C/C mice, Nestin-CFP mice and Nestin-CreERT2 mice have been described previously23,31. Math1-Cre Mice, Math1-CreERT2 mice, Math1-GFP mice, Actin-Ds-Red mice and R26R-GFP reporter mice were purchased from the Jackson Laboratory. CB17 SCID mice were bred in the Fox Chase Cancer Center Laboratory Animal Facility (LAF). All animals were maintained in the LAF at Fox Chase Cancer Center and all experiments were performed in accordance with procedures approved by the Fox Chase Cancer Center Animal Care and Use Committee.
Cerebellum microdissection, cell isolation and cell culture
Cerebella were harvested from Nestin-CFP/Math1-GFP animals at P4. 300µm slices were prepared using a VT1000S vibratome (Leica). Under a fluorescent microscope, EGL or white matter were carefully removed from the rest of the cerebellum using fine forceps. Dissected EGL or white matter were then digested in a solution containing 10 units/ml papain (Worthington) and 250 U/ml DNase then triturated to obtain a single-cell suspension. GNPs (GFP+) and NEPs (CFP+) were then purified using a FACSvantage SE (BD Bioscience). For isolation of NSCs, the cell suspension dissociated from Nestin-CFP/Math1-GFP cerebellum was stained for 1 hour with PE-conjugated Prominin1 antibody and with antibodies specific for lineage markers (PSA-NCAM, O4 and TAPA-1). After staining with FITC-conjugated secondary antibodies, NSCs were FACs sorted for PE-positive and FITC-negative cells6.
NEPs and GNPs were suspended in NB-B27 (Neurobasal with 1 mM sodium pyruvate, 2 mM L-glutamine, penicillin/streptomycin and B27 supplement, all from Invitrogen) and plated on poly-D-lysine (PDL)-coated coverslips (BD Biosciences). For the neurosphere forming assay, cells were plated at 2×10⁵ cells/ml in NSC proliferation medium (NeuroCult basal medium with proliferation supplemental, Stem Cell Technologies) plus 10 ng/ml basic fibroblast growth factor and 20 ng/ml epidermal growth factor (Pepro Tech). Neurospheres were counted or harvested for immunostaining after 7 days in culture. To confirm the self-renewal capacity, neurospheres were mechanically dissociated and replated in fresh proliferation medium at 2×10³ cells/ml. For differentiation assays, cells were plated on PDL-coated coverslips in NSC differentiation medium (NeuroCult basal medium with differentiation supplement, invitrogen).
Immunochemical staining and histological analysis
For tissue staining, cerebella from PFA-perfused animals were fixed overnight in 4% PFA, cryoprotected in 30% sucrose, frozen in Tissue Tek-OCT (Sakura Finetek), and cut into 10–12 µm sagittal sections. For cell staining, GNPs cultured on PDL were fixed with 4% PFA for 15 min. Immunofluorescent staining of sections and cells was carried out according to standard methods. Briefly, sections or cells were blocked and permeabilized for 2 hr with PBS containing 0.1% Triton X-100 and 1% normal goat serum, stained with primary antibodies overnight at 4°C, and incubated with secondary antibodies for 2 hr at room temperature. Sections or cells were counterstained with DAPI and mounted with Fluoromount-G (Southern Biotech) before being visualized using a Nikon TE200 microscope. Antibodies used in this study are listed in Supplementary Table 1. To compare the histological properties between human and mouse medulloblastoma, hematoxylin and eosin stain was performed according to the standard procedure. Human medulloblastoma slides were purchased from US Biomax, Inc.
Tamoxifen treatment and intracranial transplantation
Tamoxifen (Sigma) was prepared as a 20 mg/ml stock solution in corn oil (Sigma) and was administered by oral gavage using a 24G gavaging needle (Fine Science Tools). Animals at P4 were given tamoxifen at a dosage of 0.6 mg/30 ml.
For the intracranial transplantations, CB17 SCID mice were anesthetized using 100 mg/kg ketamine (Fort Dodge Animal Health) plus 9 mg/kg xylazine (Ben Venue Laboratories) and positioned in a stereotaxic frame with a mouse adaptor (David Kopf Instruments). An incision was made in the midline of the scalp over the cerebellum and a small hole was made in the skull (1 mm lateral to midline) using a beveled 18G needle. A 24G Hamilton syringe loaded with cells was mounted on a micromanipulator and introduced through the hole at a 30° angle to the surface of the cerebellum at a depth of 1 mm. Freshly sorted (uncultured) cells were injected over the course of 2 min and the needle was left in place for another 2 min to avoid reflux. After removing the mouse from the frame, 1–2 drops of 0.25% (2.5 mg/ml) bupivicaine (Hospira) were applied along the incision for postoperative analgesia and the skin was closed with 6.0 fast-absorbing plain gut sutures using a 3/8 PC-1 cutting needle (Ethicon).
Microarray analysis
RNAs isolated from NEPs, GNPs and NSCs were labeled and hybridized to Affymetrix Mouse Genome 430 2.0 arrays. Microarray data were preprocessed using robust multichip analysis (RMA). Principal component analysis (PCA) was performed on samples based on normalized expression of all genes using Partek Genomics Suite 6.3 software. Gene ontology analysis was carried out to examine the biological functions of the differentially expressed genes between NEPs and GNPs using NexusExp3 software.
Quantitative PCR
RNA was isolated using the RNAqueous kit (Ambion) and treated with DNA-free DNase (Ambion). cDNA was synthesized using oligo(dT) and Superscript II reverse transcriptase (Invitrogen). Quantitative PCR reactions were performed in triplicate using iQ SYBR Green Supermix (Bio-Rad) and the Bio-Rad iQ5 Multicolor Real-Time PCR Detection System. Gene expression was normalized to actin and expression of each gene was compared between NEPs and GNPs. Primer sequences are available upon request.
Metaphase spread
Metaphase preparations were carried out by the Molecular Cytogenetics core facility at Fox Chase Cancer Center according to standard procedures.
Statistics
Student’s t tests and Chi-square tests were performed to determine the statistical significance of the difference in means between samples in the experiments reported in Figure 2, 4, 5 and Supplementary Figure 6 and 8. P<0.05 was considered statistically significant. Error bars represents the SEM. No statistical methods were used to predetermine sample sizes, but these were similar to those employed in the field. We did not use randomization in this study, but for each experiment all genotypes were represented and appropriately blocked for data collection. We did not perform data collection and analysis blind to the conditions of the experiments because the properties of each cell type are so distinctive that the investigators would be able to tell the genotype of the animals by observation of the tissue sections. The data distribution was assumed to be normal, but this was not formally tested. Overall survival in Figure 6 was assessed using the Kaplan-Meier survival analysis and the mantel-Cox log-rank test was used to assess the significance of difference between survival curves. Data handling and statistical processing was performed using Microsoft Excel and Graphpad Prism Software.
Supplementary Material
Acknowledgements
The authors thank J. Oesterling for flow cytometric analysis; Drs. Z. Liu, J. Pei and J. Testa for cytogenetic analysis; Dr. A. Efimov for microscopy analysis; Dr. Q. Cai for histological analysis; Dr. R. Segal at Dana Farber Cancer Institute for Zic1 antibody; and Drs. D. Wiest, F. Roegiers and T. Yen for helpful discussions. This research was supported by the W.W. Smith Charitable Trust (Z.Y.), a generous gift from Cathie and Pete Getchell (Z.Y.), a NIH Postdoctoral training grant (5T32CA009035-37, L.W.Y.) grants from the US National Cancer institute (R01-CA178380, Z.Y.; R01-CA122759, R.J.W.), a pilot funding from the US National Institutes of Health (U19-AI067798, R.J.W.) and the California Institute for Regenerative Medicine ((CIRM) LA1-01747, R.J.W.).
Footnotes
Accession Codes, Microarray data are available at GEO (Gene expression Omnibus, http://www.ncbi.nlm.nih.gov/prejects/geo/index.cgi) with accession number GSE50824.
Author contributions:
Z.Y. and R.J.W. conceived the project. P.L., F.D., L.W.Y., T.L., R.E.M. and R.T. performed the experiments. Z.Y., P.L., J.W., A.B. and R.J.W. analyzed the data. G.E. provided reagents. Z.Y. prepared the manuscript.
References
- 1.Lendahl U, Zimmerman LB, McKay RD. CNS stem cells express a new class of intermediate filament protein. Cell. 1990;60:585–595. doi: 10.1016/0092-8674(90)90662-x. [DOI] [PubMed] [Google Scholar]
- 2.Morshead CM, et al. Neural stem cells in the adult mammalian forebrain: a relatively quiescent subpopulation of subependymal cells. Neuron. 1994;13:1071–1082. doi: 10.1016/0896-6273(94)90046-9. [DOI] [PubMed] [Google Scholar]
- 3.Shi H, et al. Nestin expression defines both glial and neuronal progenitors in postnatal sympathetic ganglia. J Comp Neurol. 2008;508:867–878. doi: 10.1002/cne.21719. [DOI] [PMC free article] [PubMed] [Google Scholar]
- 4.Vukojevic K, Petrovic D, Saraga-Babic M. Nestin expression in glial and neuronal progenitors of the developing human spinal ganglia. Gene Expr Patterns. 2010;10:144–151. doi: 10.1016/j.gep.2009.12.001. [DOI] [PubMed] [Google Scholar]
- 5.Hyder CL, Isoniemi KO, Torvaldson ES, Eriksson JE. Insights into intermediate filament regulation from development to ageing. J Cell Sci. 2011;124:1363–1372. doi: 10.1242/jcs.041244. [DOI] [PubMed] [Google Scholar]
- 6.Lee A, et al. Isolation of neural stem cells from the postnatal cerebellum. Nat Neurosci. 2005;8:723–729. doi: 10.1038/nn1473. [DOI] [PMC free article] [PubMed] [Google Scholar]
- 7.Yang ZJ, et al. Medulloblastoma can be initiated by deletion of Patched in lineage-restricted progenitors or stem cells. Cancer Cell. 2008;14:135–145. doi: 10.1016/j.ccr.2008.07.003. [DOI] [PMC free article] [PubMed] [Google Scholar]
- 8.Sutter R, et al. Cerebellar stem cells act as medulloblastoma-initiating cells in a mouse model and a neural stem cell signature characterizes a subset of human medulloblastomas. Oncogene. 2010;29:1845–1856. doi: 10.1038/onc.2009.472. [DOI] [PubMed] [Google Scholar]
- 9.Sotelo C, Alvarado-Mallart RM, Frain M, Vernet M. Molecular plasticity of adult Bergmann fibers is associated with radial migration of grafted Purkinje cells. J Neurosci. 1994;14:124–133. doi: 10.1523/JNEUROSCI.14-01-00124.1994. [DOI] [PMC free article] [PubMed] [Google Scholar]
- 10.Alder J, Cho NK, Hatten ME. Embryonic precursor cells from the rhombic lip are specified to a cerebellar granule neuron identity. Neuron. 1996;17:389–399. doi: 10.1016/s0896-6273(00)80172-5. [DOI] [PubMed] [Google Scholar]
- 11.Rao G, Pedone CA, Coffin CM, Holland EC, Fults DW. c-Myc enhances sonic hedgehog-induced medulloblastoma formation from nestin-expressing neural progenitors in mice. Neoplasia. 2003;5:198–204. doi: 10.1016/S1476-5586(03)80052-0. [DOI] [PMC free article] [PubMed] [Google Scholar]
- 12.Rao G, et al. Sonic hedgehog and insulin-like growth factor signaling synergize to induce medulloblastoma formation from nestin-expressing neural progenitors in mice. Oncogene. 2004;23:6156–6162. doi: 10.1038/sj.onc.1207818. [DOI] [PubMed] [Google Scholar]
- 13.Tanori M, et al. Developmental and oncogenic effects of insulin-like growth factor-I in Ptc1+/− mouse cerebellum. Mol Cancer. 2010;9:53. doi: 10.1186/1476-4598-9-53. [DOI] [PMC free article] [PubMed] [Google Scholar]
- 14.Frappart PO, Lee Y, Lamont J, McKinnon PJ. BRCA2 is required for neurogenesis and suppression of medulloblastoma. EMBO J. 2007;26:2732–2742. doi: 10.1038/sj.emboj.7601703. [DOI] [PMC free article] [PubMed] [Google Scholar]
- 15.Mills J, et al. Critical role of integrin-linked kinase in granule cell precursor proliferation and cerebellar development. J Neurosci. 2006;26:830–840. doi: 10.1523/JNEUROSCI.1852-05.2006. [DOI] [PMC free article] [PubMed] [Google Scholar]
- 16.Mignone JL, Kukekov V, Chiang AS, Steindler D, Enikolopov G. Neural stem and progenitor cells in nestin-GFP transgenic mice. J Comp Neurol. 2004;469:311–324. doi: 10.1002/cne.10964. [DOI] [PubMed] [Google Scholar]
- 17.Ben-Arie N, et al. Math1 is essential for genesis of cerebellar granule neurons. Nature. 1997;390:169–172. doi: 10.1038/36579. [DOI] [PubMed] [Google Scholar]
- 18.Lumpkin EA, et al. Math1-driven GFP expression in the developing nervous system of transgenic mice. Gene Expr Patterns. 2003;3:389–395. doi: 10.1016/s1567-133x(03)00089-9. [DOI] [PubMed] [Google Scholar]
- 19.Uchida N, et al. Direct isolation of human central nervous system stem cells. Proc Natl Acad Sci U S A. 2000;97:14720–14725. doi: 10.1073/pnas.97.26.14720. [DOI] [PMC free article] [PubMed] [Google Scholar]
- 20.Reynolds BA, Weiss S. Generation of neurons and astrocytes from isolated cells of the adult mammalian central nervous system. Science. 1992;255:1707–1710. doi: 10.1126/science.1553558. [DOI] [PubMed] [Google Scholar]
- 21.Vintersten K, et al. Mouse in red: red fluorescent protein expression in mouse ES cells, embryos, and adult animals. Genesis. 2004;40:241–246. doi: 10.1002/gene.20095. [DOI] [PubMed] [Google Scholar]
- 22.Aruga J, et al. A novel zinc finger protein, zic, is involved in neurogenesis, especially in the cell lineage of cerebellar granule cells. J Neurochem. 1994;63:1880–1890. doi: 10.1046/j.1471-4159.1994.63051880.x. [DOI] [PubMed] [Google Scholar]
- 23.Balordi F, Fishell G. Mosaic removal of hedgehog signaling in the adult SVZ reveals that the residual wild-type stem cells have a limited capacity for self-renewal. J Neurosci. 2007;27:14248–14259. doi: 10.1523/JNEUROSCI.4531-07.2007. [DOI] [PMC free article] [PubMed] [Google Scholar]
- 24.Mao X, Fujiwara Y, Chapdelaine A, Yang H, Orkin SH. Activation of EGFP expression by Cre-mediated excision in a new ROSA26 reporter mouse strain. Blood. 2001;97:324–326. doi: 10.1182/blood.v97.1.324. [DOI] [PubMed] [Google Scholar]
- 25.Machold R, Fishell G. Math1 is expressed in temporally discrete pools of cerebellar rhombic-lip neural progenitors. Neuron. 2005;48:17–24. doi: 10.1016/j.neuron.2005.08.028. [DOI] [PubMed] [Google Scholar]
- 26.Wechsler-Reya RJ, Scott MP. Control of neuronal precursor proliferation in the cerebellum by Sonic Hedgehog. Neuron. 1999;22:103–114. doi: 10.1016/s0896-6273(00)80682-0. [DOI] [PubMed] [Google Scholar]
- 27.Kenney AM, Cole MD, Rowitch DH. Nmyc upregulation by sonic hedgehog signaling promotes proliferation in developing cerebellar granule neuron precursors. Development. 2003;130:15–28. doi: 10.1242/dev.00182. [DOI] [PubMed] [Google Scholar]
- 28.Orford KW, Scadden DT. Deconstructing stem cell self-renewal: genetic insights into cell-cycle regulation. Nat Rev Genet. 2008;9:115–128. doi: 10.1038/nrg2269. [DOI] [PubMed] [Google Scholar]
- 29.Lombard DB, et al. DNA repair, genome stability, and aging. Cell. 2005;120:497–512. doi: 10.1016/j.cell.2005.01.028. [DOI] [PubMed] [Google Scholar]
- 30.Burhans WC, Weinberger M. DNA replication stress, genome instability and aging. Nucleic Acids Res. 2007;35:7545–7556. doi: 10.1093/nar/gkm1059. [DOI] [PMC free article] [PubMed] [Google Scholar]
- 31.Ellis T, et al. Patched 1 conditional null allele in mice. Genesis. 2003;36:158–161. doi: 10.1002/gene.10208. [DOI] [PubMed] [Google Scholar]
- 32.Ahn S, Joyner AL. In vivo analysis of quiescent adult neural stem cells responding to Sonic hedgehog. Nature. 2005;437:894–897. doi: 10.1038/nature03994. [DOI] [PubMed] [Google Scholar]
- 33.Balordi F, Fishell G. Hedgehog signaling in the subventricular zone is required for both the maintenance of stem cells and the migration of newborn neurons. J Neurosci. 2007;27:5936–5947. doi: 10.1523/JNEUROSCI.1040-07.2007. [DOI] [PMC free article] [PubMed] [Google Scholar]
- 34.Aguilera A, Gomez-Gonzalez B. Genome instability: a mechanistic view of its causes and consequences. Nat Rev Genet. 2008;9:204–217. doi: 10.1038/nrg2268. [DOI] [PubMed] [Google Scholar]
- 35.Frappart PO, et al. Recurrent genomic alterations characterize medulloblastoma arising from DNA double-strand break repair deficiency. Proc Natl Acad Sci U S A. 2009;106:1880–1885. doi: 10.1073/pnas.0806882106. [DOI] [PMC free article] [PubMed] [Google Scholar]
- 36.Silbereis J, et al. Astroglial cells in the external granular layer are precursors of cerebellar granule neurons in neonates. Mol Cell Neurosci. 2010;44:362–373. doi: 10.1016/j.mcn.2010.05.001. [DOI] [PMC free article] [PubMed] [Google Scholar]
- 37.Nicot A, Lelievre V, Tam J, Waschek JA, DiCicco-Bloom E. Pituitary adenylate cyclase-activating polypeptide and sonic hedgehog interact to control cerebellar granule precursor cell proliferation. J Neurosci. 2002;22:9244–9254. doi: 10.1523/JNEUROSCI.22-21-09244.2002. [DOI] [PMC free article] [PubMed] [Google Scholar]
- 38.Rios I, Alvarez-Rodriguez R, Marti E, Pons S. Bmp2 antagonizes sonic hedgehog-mediated proliferation of cerebellar granule neurones through Smad5 signalling. Development. 2004;131:3159–3168. doi: 10.1242/dev.01188. [DOI] [PubMed] [Google Scholar]
- 39.Fogarty MP, Kessler JD, Wechsler-Reya RJ. Morphing into cancer: the role of developmental signaling pathways in brain tumor formation. J Neurobiol. 2005;64:458–475. doi: 10.1002/neu.20166. [DOI] [PubMed] [Google Scholar]
- 40.Pons S, Trejo JL, Martinez-Morales JR, Marti E. Vitronectin regulates Sonic hedgehog activity during cerebellum development through CREB phosphorylation. Development. 2001;128:1481–1492. doi: 10.1242/dev.128.9.1481. [DOI] [PubMed] [Google Scholar]
- 41.Schuller U, et al. Acquisition of granule neuron precursor identity is a critical determinant of progenitor cell competence to form Shh-induced medulloblastoma. Cancer Cell. 2008;14:123–134. doi: 10.1016/j.ccr.2008.07.005. [DOI] [PMC free article] [PubMed] [Google Scholar]
- 42.Kaye JA, et al. DNA breaks promote genomic instability by impeding proper chromosome segregation. Curr Biol. 2004;14:2096–2106. doi: 10.1016/j.cub.2004.10.051. [DOI] [PubMed] [Google Scholar]
- 43.Jasin M. Chromosome breaks and genomic instability. Cancer Invest. 2000;18:78–86. doi: 10.3109/07357900009023065. [DOI] [PubMed] [Google Scholar]
- 44.Oliver TG, et al. Loss of patched and disruption of granule cell development in a pre-neoplastic stage of medulloblastoma. Development. 2005;132:2425–2439. doi: 10.1242/dev.01793. [DOI] [PubMed] [Google Scholar]
- 45.Pazzaglia S, et al. High incidence of medulloblastoma following X-ray-irradiation of newborn Ptc1 heterozygous mice. Oncogene. 2002;21:7580–7584. doi: 10.1038/sj.onc.1205973. [DOI] [PubMed] [Google Scholar]
- 46.Pazzaglia S, et al. The genetic control of chemically and radiation-induced skin tumorigenesis: a study with carcinogenesis-susceptible and carcinogenesis-resistant mice. Radiat Res. 2002;158:78–83. doi: 10.1667/0033-7587(2002)158[0078:tgcoca]2.0.co;2. [DOI] [PubMed] [Google Scholar]
- 47.Lee Y, McKinnon PJ. DNA ligase IV suppresses medulloblastoma formation. Cancer Res. 2002;62:6395–6399. [PubMed] [Google Scholar]
- 48.Fernandez LA, et al. Oncogenic YAP promotes radioresistance and genomic instability in medulloblastoma through IGF2-mediated Akt activation. Oncogene. 2012;31:1923–1937. doi: 10.1038/onc.2011.379. [DOI] [PMC free article] [PubMed] [Google Scholar]
- 49.Beer S, et al. Developmental context determines latency of MYC-induced tumorigenesis. PLoS Biol. 2004;2:e332. doi: 10.1371/journal.pbio.0020332. [DOI] [PMC free article] [PubMed] [Google Scholar]
Associated Data
This section collects any data citations, data availability statements, or supplementary materials included in this article.