Abstract
Analyzing the function of gene sets is a critical step in interpreting the results of high-throughput experiments in systems biology. A variety of enrichment analysis tools have been developed in recent years, but most output a long list of significantly enriched terms that are often redundant, making it difficult to extract the most meaningful functions. In this paper, we present GOMA, a novel enrichment analysis method based on the new concept of enriched functional Gene Ontology (GO) modules. With this method, we systematically revealed functional GO modules, i.e., groups of functionally similar GO terms, via an optimization model and then ranked them by enrichment scores. Our new method simplifies enrichment analysis results by reducing redundancy, thereby preventing inconsistent enrichment results among functionally similar terms and providing more biologically meaningful results.
Keywords: GO enrichment analysis, GO modules, functional redundancy, GO network, GO relationships
In the post-genome era, a group of genes—instead of single gene—is believed to perform biological functions, making functional analysis of gene sets an important way to understand cell biology[1]–[3]. Functional enrichment analysis, a bioinformatics technique that has become popular in systems biology, is used to find specific and significant functions to annotate a given gene set. In the past decade, many enrichment analysis tools have been developed, and these can be classified into different types based on the algorithms and data used. A recent review categorized the 68 existing enrichment tools into three classes: singular enrichment analysis (SEA), gene set enrichment analysis (GSEA), and modular enrichment analysis (MEA)[4], as shown in Figure 1. SEA methods calculate enrichment P value for each term on a pre-selected gene list, so the results heavily depend on how the pre-selected gene set is generated. GSEA methods do not require a cutoff to pre-selected genes and instead integrate the attributes of each gene in the whole gene set into the enrichment score. MEA methods extend SEA methods by integrating the term-term/gene-gene relationships. A biological process is typically realized by a group of genes or gene products. A group of genes may also participate in several biological processes. Gene sets are mostly annotated by a set of related annotation terms, named term module, instead of the most significant term. From this point of view, MEA methods are more reasonable in practice. By using the term modules instead of individual terms, MEA methods can also solve the functional redundancy problem, that is, a set of identified significant terms represents a redundant view of the same biological process[5]. However, MEA methods have been only minimally reported in the literature (e.g. DAVID[6] and GenGO[5]).
Figure 1. Three types of enrichment analysis tools.

Enrichment analysis tools are categorized into singular enrichment analysis (SEA), gene set enrichment analysis (GSEA), and modular enrichment analysis (MEA) based on the algorithms and data used [4]. The yellow arrows mean the developmental process of the enrichment analysis tools.
In this article, we present a novel Gene Ontology[7] (GO) enrichment analysis method. GO is the most important and extensively used annotation database in enrichment analysis. In this new method, GOMA, we built a GO term network; used an optimization model to extract GO modules, groups of densely connected and functionally similar terms, from the GO network; and ranked GO modules by their enrichment scores. GOMA solves the problem of functional redundancy and prevents inconsistent enrichment results among functionally similar terms. Compared with the classic term-centric hypergeometric method (CHM), computational results on several real data sets show that GOMA provides more meaningful results.
Materials and Methods
The GOMA work flow is shown in Figure 2 and described in detail below.
Figure 2. The GOMA work flowchart.

The steps in the GOMA process are as follows: ① construct GO term network; ② extract densely connected GO modules; ③ rank GO modules by enrichment scores; and ④ output GO module list.
Construction of a GO Network
A GO term network was constructed according to the global similarities among GO terms. The nodes of the GO network represent the GO terms annotated in the input gene list, and the edges denote the global similarities between any GO term pairs. The global similarity of two GO terms was calculated with GOSemSim[8], which integrates GO-dependent information included in the GO hierarchical structure. In general, a GO network is presented as an undirected weighted graph G = (V, E), where V = {v1,v2,…,vn} is the node (GO term) set and E = {(vi,vj) |vi, vj ∈ V} is the edge set. There are weights a ssociated with nodes and edges. Suppose that F = {f1, f2,…, fn} is the node weight vector, and W = {wij,i,j = 1,…,n} is the edge weight matrix.
Extraction of GO modules from the GO network
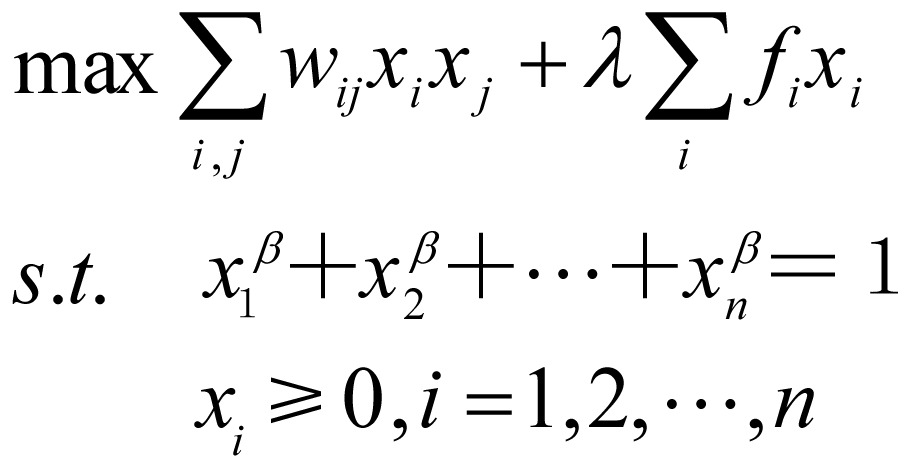
The functional GO modules, that is, the densely connected subgraphs, were extracted from the GO network. There are many module identification algorithms for complex networks, but only a few integrate both the edge weights and node weights. GOMA is based on an optimization model to identify the most coherent subnetworks. The optimization model maximizes the sum of weights of edges and nodes within a subnetwork while constraining the subnetwork size. Therefore, it is suitable for finding the most functionally similar GO modules. The model can be described formally as follows:
 |
(1.1), |
where max means to maximize the objective function and s.t. is the abbreviation for “subject to”; xi denotes the degree for node i belonging to the optimal GO module; λ is a parameter to balance the node and edge weights; and β is a regularization parameter for the variable x = (x1, x2, …, xn). The larger β is, the smaller the size of the derived GO module. By solving the optimization model, we obtained a GO module by selecting the nodes with xi larger than a pre-determined cutoff. Then these nodes and the related edges were removed from the GO term network. This process was repeated to derive all densely connected GO modules. The optimization model was solved by the efficient iterative algorithm proposed by Wang et al.[9].
To extract functionally similar GO terms that annotated as many genes as possible, the node weight was defined as fi = mi/m,i=1, … ,n, where mi is the number of genes annotated by GO term vi, and m is the total number of genes. The edge weight was defined as wij = sij × dij, where sij is the semantic similarity of GO terms vi and vj, and dij is the normalized average GO level of two terms. In detail,  and
and  , where di, i=1, 2,…, n, is the GO level of term vi (that is, the longest path length from the root to term vi in the GO hierarchical structure), and α is a parameter to adjust the specificity of GO modules. The larger α is, the more specific the derived GO module is. We noted that sjj is a factor to find the functionally similar terms in GO tree structure, and dij is a factor to adjust the specificity of GO modules. The goal of functional enrichment analysis is to find the specific biological annotations for a gene set, and larger GO level indicates more specific functional annotations. Therefore, we defined wij as the product of sij and dij.
Ranking of GO modules
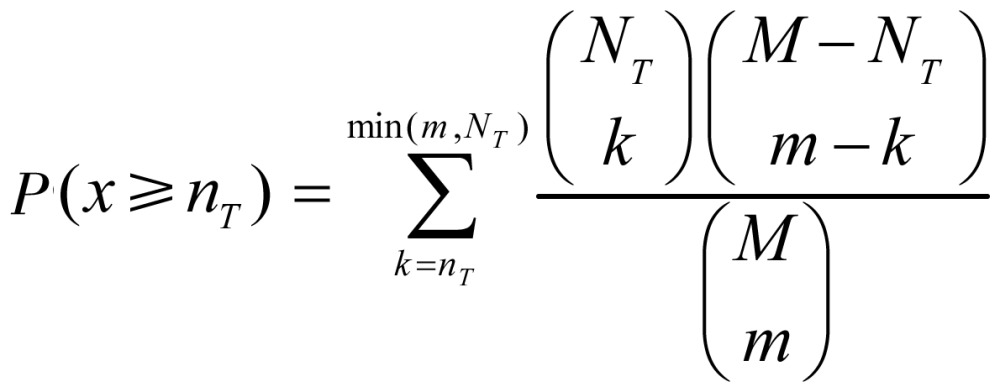
GO modules were ranked according to their enrichment scores. A GO module T is considered a pseudo term, and a gene is annotated by T if the gene is annotated by at least one term in T. To test whether a GO module is enriched in a given gene set, the enrichment score of T was defined as sT = (nT/m)(NT/M), where nT is the number of genes annotated by T, m is the total number of genes in the given gene set, and NT and M are the corresponding number of genes annotated by T and the total number of genes in the reference set, respectively. The statistical significance of GO module enrichment was calculated by the hypergeometric test, which is extensively used in bioinformatics enrichment analysis studies. The null hypothesis is that genes annotated by T have the same probabilistic distributions in the given gene set and in the reference set. Suppose that the random variable x denotes the number of genes annotated by T in the given gene set, x should follow a hypergeometric distribution under the null hypothesis. The P value of GO module enrichment, that is, the probability that x would have a value greater than or equal to the observed value nT by chance, can be calculated as follows:
 |
(1.2). |
The GO module enrichment of T in the given gene set is statistically significant if the P value is smaller than a chosen cutoff which is given by the users. When the P value of one GO module is lower than the cutoff, the GO module is considered statistically significant.
Data sets and model parameters
We used four data sets from the literature, originally analyzed with NOA[10], DAVID[6],[11], and GOrilla[12], to evaluate the proposed method. In the computational experiments, the parameters were set as follows: β = 10, λ = 0.08, and α = 1. GO semantic similarities sij were computed using an R package GOSemSim[8], which implemented the algorithm proposed by Wang et al. [13]. Yeast and human GO annotation data were from R packages org. Sc.sgd.db[14] and org.Hs.eg.db[15] in Bioconductor [16], respectively. All GO hierarchies were generated by AmiGO[17]. In this study, we focused on the biological process (BP) domain only, though the method also can be applied to cellular component (CC) and molecular function (MF) domains.
Results
Transcription factor co-regulatory network
The first data set used was the yeast cell cycle transcription factor (TF) co-regulatory network[10], which was downloaded from the NOA web server[18]. The TF network contained 67 genes and the derived GO term network had 545 terms as nodes.
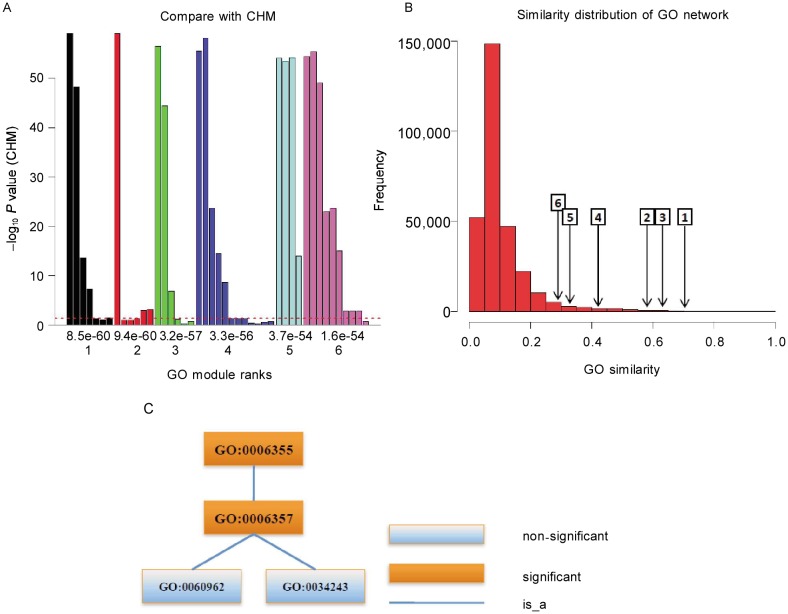
GOMA results are shown in Figure 3. We compared the top six statistically significant GO modules found by GOMA with individual terms calculated by CHM and found that five of six GO modules contained non-significant GO terms by CHM method (Figure 3A). Many non-significant terms are functional redundancy with the significant ones. GOMA collected them together as GO modules without the functional redundancy and described the biological process more specific with the functional similar terms. We also found that the top six GO modules had larger average similarities compared with the whole GO network (Figure 3B), suggesting that the terms in the GO modules were more functionally similar than those in the whole GO network.
Figure 3. GO modules of yeast cell cycle transcription factor co-regulatory network.
A, comparison with CHM. The X axis is the rank (down) and P value (up) of GO modules. The Y axis is –log10(P value) of individual terms calculated by CHM. The maximal value of the Y axis corresponds to infinity. The dashed line denotes the P value cutoff of 0.05. There are five of six GO modules containing non-significant terms which are functional similar. B, similarity distribution of the GO network and the average similarities of GO modules. The number in the rectangle is GO module rank, and the arrow points to the corresponding average similarity. GO modules have high similarities, that is, GO modules are really functional similar. C, the term structure of the first GO module. The functions of GO modules are as follows: GO:0006355, regulation of transcription, DNA-dependent; GO:0006357, regulation of transcription from RNA polymerase II promoter; GO:0034243, regulation of transcription elongation from RNA polymerase II promoter; and GO:0060962, regulation of ribosomal protein gene transcription from RNA polymerase II promoter.
Enrichment analysis results were simplified by grouping functionally similar terms together. The first GO module mainly described how the transcription process is regulated (Figure 3C). (In AmiGO[17] ontology data, GO: 00100551, GO:0032583 and GO:0090039 were merged with GO:0006357, GO:0006355, and GO:0034243, respectively.) While GO:0006355 (regulation of transcription, DNA-dependent) and GO:0006357 (regulation of transcription from RNA polymerase II promoter) are general descriptions for the transcription regulation process, the other two terms have more specific functions: regulation of transcription elongation from RNA polymerase II promoter (GO:0034243) and regulation of ribosomal protein gene transcription from RNA polymerase II promoter (GO:0060962). Although the terms GO:0034243 and GO:0060962 were not significant in term-centric enrichment analysis, they were major contributors to the significance of the two parental terms. This example shows that GOMA can find a module containing the specific terms, whereas term-centric methods can only find the common ancestor of several specific terms. The details of other GO modules, which contain cell cycle–related functions, are listed in Supplementary materials (http://www.cjcsysu.com/enpdf/supp/12-151.pdf). The data set used in this example is a cell-cycle conditional-specific transcription factor regulatory network[19], and our GO modules support the cell cycle process in different and specific angle, that is, the top six GO modules contained many cell cycle–related functional terms.
DAVID demo lists
The second and third data sets used were demo lists from the DAVID web server[20]. Demo list 1[21] contains 164 human genes found to be up-regulated in CD4+/CD62L− T cells relative to CD4+/CD62L+ T cells. Demo list 2[22] contains 403 human genes found to be induced in peripheral blood mononuclear cells incubated with purified HIV envelope proteins. After ID mapping, the gene sets included 155 and 379 genes while the GO term networks contained 2,171 and 3,439 terms, respectively.
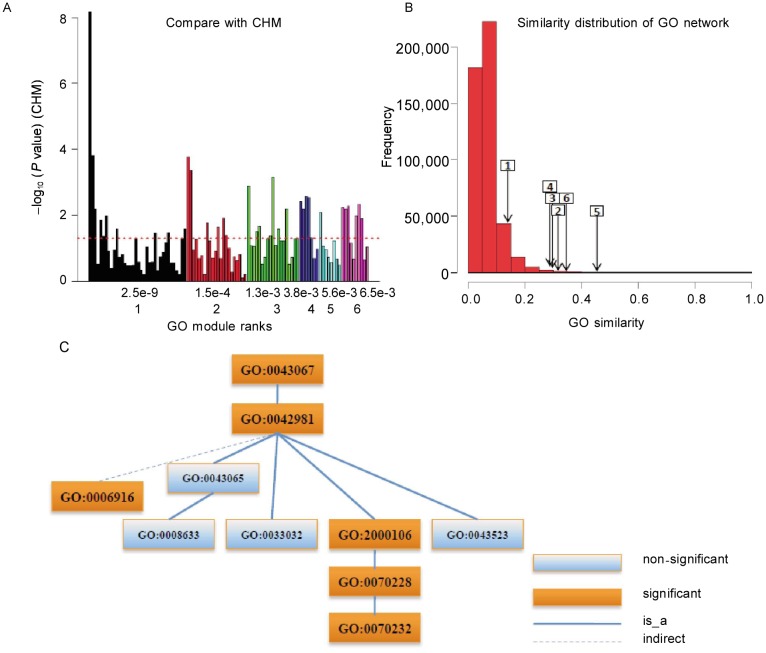
Results for demo list 1 are shown in Figure 4. CHM revealed that the top six GO modules got by GOMA contained non-significant terms (Figure 4A). GOMA put these terms together as the GO modules most significantly enriched in the entire gene set. We also found that the terms in each GO module were similar to each other (Figure 4B). For example, in addition to individually significant terms such as GO:2000106 (regulation of leukocyte apoptotic process), GOMA identified GO:0033032 and GO:0043523 (regulation of myeloid cell and neuron apoptosis process) and the functionally similar terms GO:0043065 and GO:0008633 in the sixth GO module (Figure 4C).
Figure 4. GO modules of DAVID demo list 1.
A, comparison with CHM. The X axis is the rank (down) and P value (up) of GO modules. The Y axis is –log10(P value) of individual terms calculated by CHM. The maximal value of the Y axis corresponds to infinity. The dashed line denotes the P value cutoff of 0.05. Many non-significant terms are functional redundancy with the significant ones. GOMA collected them together as GO modules without the functional redundancy. B, similarity distribution of the GO network and the average similarities of GO modules. The number in the rectangle is GO module rank and the arrow points to the corresponding average similarity. The high similarities for GO modules mean the dense subnetworks. C, the term structure of the sixth GO module shows more details about the functional relationships among the terms in one GO module.
Differentially expressed genes in demo list 1 could be classified into several functional clusters, such as receptor and receptor ligand genes, signal transduction genes, and effector genes[21]. The receptor and receptor ligand cluster could be further subdivided into chemokine and cytokine, cell fate and apoptosis, or trophic and growth factor gene product pathways. The first and sixth GO modules covered the receptor and receptor ligand functions, which is consistent with the original data analysis[21]. The primary function of the first GO module was response to stimulus (GO:0050896), and its specific functions included cellular response to cytokine stimulus (GO:0071345), cellular response to growth factor stimulus (GO:0071363), and chemokine-mediated signaling pathway (GO:0070098). The sixth GO module mainly described cell death and apoptosis related functions, such as regulation of apoptotic process (GO: 0042981) and regulation of programmed cell death (GO: 0043067). The second GO module covered signal transduction (GO:0007165) and more specific signaling pathway relevant terms, which corresponds to a significant sub gene set with the signal transduction function[21]. The third and fourth GO modules were involved in regulation of multicellular organismal development (GO:2000026) and regulation of cell differentiation (GO:0045595), respectively. The fifth GO module corresponded to the effector gene cluster in demo list 1, which is also an enriched function corresponding to a sub gene set in the original data analysis[21] and included regulation of lymphocyte differentiation (GO:0045619) and regulation of myeloid cell differentiation (GO:0045638, GO:0045639).
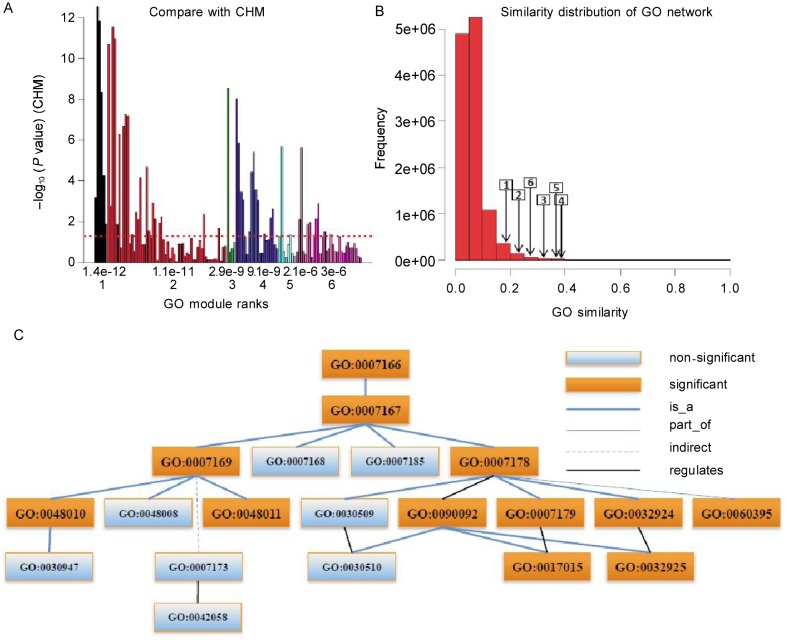
Results for demo list 2 are shown in Figure 5. All but the first GO module contained non-significant terms (Figure 5A). The average GO similarities within GO modules are shown in Figure 5B. The structure of the fourth GO module is illustrated as an example in Figure 5C. Compared with the individual significant terms found by term-centric methods, GOMA identified the whole module related to cell surface receptor signaling pathway (GO:0007166). With GOMA, we also identified many specific terms that were not individually significant but were still related to growth factor receptor signaling pathways, such as GO:0048008, GO:0007173, and GO: 0042058. Module-centric results may provide a more complete picture of enriched GO terms in the given gene set.
Figure 5. GO modules of DAVID demo list 2.
A, comparison with CHM. The X axis is the rank (down) and P value (up) of GO modules. The Y axis is –log10(P value) of individual terms calculated by CHM. The maximal value of the Y axis corresponds to infinity. The dashed line denotes the P value cutoff of 0.05. Many non-significant terms are functional redundancy with the significant ones. GOMA collected them together as GO modules without functional redundancy. B, similarity distribution of the GO term network and the average similarities of GO modules. The number in the rectangle is GO module rank and the arrow points to the corresponding average similarity. The high similarities for GO modules mean the densely subnetworks. C, the term structure of the fourth GO module shows more details about the functional relationships among the terms in one GO module.
Demo list 2 consists of the genes involved in the transcriptional changes induced by gp120 freshly isolated peripheral blood mononuclear cells and monocyte-derived-macrophages[22]. The first GO module contained the regulation of biological process and related functions and is therefore a general function module. The second GO module included the specific functions of signal transduction (GO:0007165) that correspond to chemokines and modulators of chemokine-related signal transduction[22]. The third GO module was related to meiosis I (GO:0007127). The primary function of the fourth GO module was regulation of growth factor related signal pathways, including terms such as regulation of vascular endothelial growth factor receptor signaling pathway (GO:0030947), which is significantly related with the original data analysis[22], and regulation of epidermal growth factor receptor signaling pathway (GO:0042058). The fifth GO module involved regulation of receptor activity (GO:0010469), and the sixth module involved cell differentiation (GO:0030154).
Breast cancer data
The fourth data set used was differentially expressed genes in breast cancer samples[23] originally analyzed with GOrilla[12]. Genes in this list were ranked according to a simple t test for one group of 44 patients who survived longer than 5 years and another group of 33 patients who survived less than 5 years. The top 927 differentially expressed genes were included in the gene list. After deleting genes with unresolved identity and without GO annotations, our final list contained 775 genes and 4,144 GO terms.
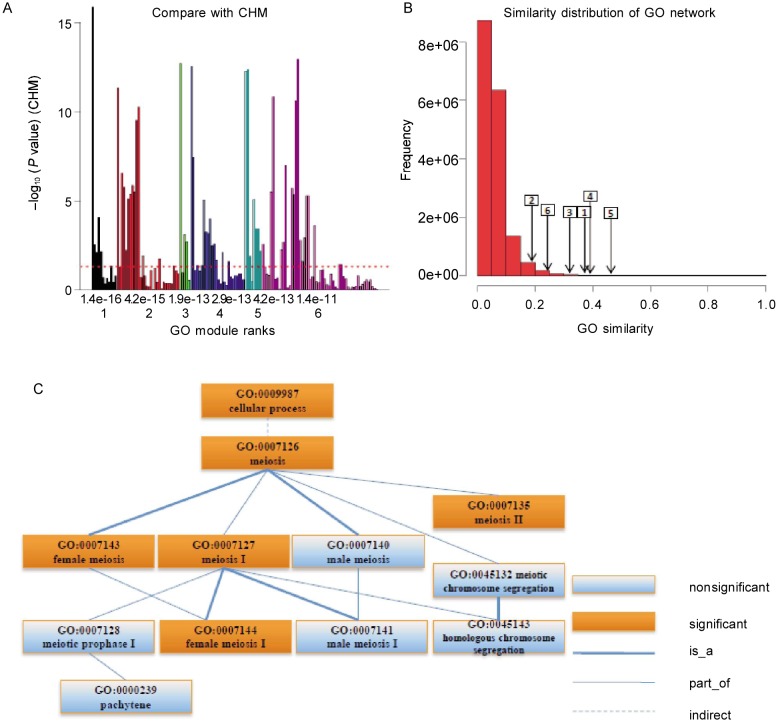
GOMA results are shown in Figure 6. The top six GO modules contained both significant and non-significant terms (Figure 6A) and had large internal similarities (Figure 6B). Figure 6C shows the hierarchical structure of the first GO module. GOMA revealed many functions specific to the cellular process (GO:0009987) and clustered the meiosis process related GO terms into one functional module.
Figure 6. GO modules of breast cancer data.
A, comparison with CHM. The X axis is the rank (down) and P value (up) of GO modules. The Y axis is –log10(P value) of individual terms calculated by CHM. The maximal value of the Y axis corresponds to infinity. The dashed line denotes the P value cutoff of 0.05. Many non-significant terms are functional redundancy with the significant ones. GOMA collected them together as GO modules without the functional redundancy. B, similarity distribution of the GO term network and the average similarities of GO modules. The number in the rectangle is GO module rank and the arrow points to the corresponding average similarity. The high similarities for GO modules mean the densely subnetworks. C, the term structure of the first GO module shows more details about the functional relationships among the terms in one GO module.
Cell cycle phase (GO:0022403) and reproduction (GO:0000003) functions were enriched in the breast cancer data set. The first GO module grasped their specific offspring terms: meiosis (GO:0007126), pachytene (GO:000239), and other related functions. The second GO module involved translation-related functions, such as translational initiation (GO:0006413) and posttranscriptional regulation of gene expression (GO:0010608). The third GO module involved regulation of cell cycle process (GO:0010564) and the more specific regulation of meiosis and S phase (GO: 0040020, GO:0033261), which is consistent with the first module. The fourth and fifth modules also included functions involved in the cell cycle process. The sixth module included signal transduction (GO:0007165) and other signal pathways related functions. All terms in the GO modules and their functional information can be found in Supplementary Materials (http://www.cjcsysu.com/enpdf/supp/12-151.pdf).
Discussion
In this paper, we proposed a new functional enrichment analysis method, GOMA, in which a GO term network is built based on term-term relationships and GO hierarchical structures. Functional enrichment results are given as a list of enriched GO modules for a given gene set, which reduces functional redundancy. As illustrated in the real data examples, GOMA can find meaningful and consistent functional GO modules from given gene sets, making it a useful tool.
Functional redundancy poses a problem in traditional bioinformatics enrichment analysis. Hence, several MEA methods, which may overcome functional redundancy, have been developed in recent years. By grouping terms as modules, MEA methods greatly simplify the results of enrichment analysis and improve the efficiency of downstream analysis. Some MEA methods, such as GenGO[5], do not explicitly model the similarity between terms, and as a result, the terms identified with these methods may not be functionally similar. With DAVID[6], an MEA method, functionally similar terms are grouped into clusters, but the similarity of two terms is defined based on the number of common annotated genes in the given gene set. That is, with DAVID, only the local similarity of terms is considered: terms in the same cluster are similar in the given gene set but are not necessarily similar in the reference set. Conversely, with GOMA, the global similarity of terms is considered, making the modules found more functionally similar and therefore more meaningful. Methods based on global similarity can also be used to find individually non-significant terms, which is difficult for methods based on local similarity. These terms are often closely related to significant terms and may be meaningful for downstream analysis. Another intuitive way to reduce the functional redundancy in the results of enrichment analysis is by clustering the significantly enriched terms found with term-centric enrichment analysis tools. With term-centric approaches, individually non-significant terms cannot be identified and the selected modules largely depend on a pre-selected cutoff.
Currently, most MEA methods are based solely on term-term relationships. While gene-gene relationships are also considered in a few MEA methods, only limited information such as gene similarity is used. To our best knowledge, our previous method, NOA[10], was the first real network-based enrichment analysis approach. With NOA, edge annotations are defined from gene annotations, and then the functional terms in edges are analyzed. In this way, NOA can be used to find specific enrichment results related to the network—results that cannot be obtained with traditional gene-based methods. However, NOA was only an initial approach in the field of network-based enrichment analysis, and there are many possible improvements. For example, the integration of NOA and GOMA is a promising direction for future study. In our GOMA model, we used only term-term relationship information, though other information like gene-gene interactions, specific experimental conditions, and other annotations are now available. Integration of this information is a promising direction for future work.
Compared with term-centric methods, GOMA is limited by computational complexity and running time, with GO term network construction and GO module extraction taking the majority of time. Improving algorithms to make GO network construction and module extraction more efficient and rapid will make GOMA more practical for large-scale data. The optimal choice of parameters, which was not considered in this study, should also be investigated thoroughly. Other considerations for future studies include how to deal with weighted gene sets and how to integrate annotations from different databases where relationships may vary[24]. This latter point is a key research focus among developers of functional enrichment analysis tools.
Acknowledgments
This work was supported by grants from the National Natural Science Foundation of China (No. 60970091, 61171007, 11131009).
References
- 1.Chen ZL, Zhao SH, Wang Z, et al. et al. Expression and unique functions of four nuclear factor of activated T cells isoforms in non-small cell lung cancer. Chin J Cancer. 2011;30:62–68. doi: 10.5732/cjc.010.10156. [DOI] [PMC free article] [PubMed] [Google Scholar]
- 2.Gullu G, Karabulut S, Akkiprik M. Functional roles and clinical values of insulin-like growth factor-binding protein-5 in different types of cancers. Chin J Cancer. 2012;31:266–280. doi: 10.5732/cjc.011.10405. [DOI] [PMC free article] [PubMed] [Google Scholar]
- 3.Zhai JW, Yang XG, Yang FS, et al. et al. Expression and clinical significance of Ezrin and E-cadherin in esophageal squamous cell carcinoma. Chin J Cancer. 2010;29:317–320. doi: 10.5732/cjc.009.10505. [DOI] [PubMed] [Google Scholar]
- 4.Huang da W, Sherman BT, Lempicki RA. Bioinformatics enrichment tools: paths toward the comprehensive functional analysis of large gene lists. Nucleic Acids Res. 2009;37:1–13. doi: 10.1093/nar/gkn923. [DOI] [PMC free article] [PubMed] [Google Scholar]
- 5.Lu Y, Rosenfeld R, Simon I, et al. et al. A probabilistic generative model for GO enrichment analysis. Nucleic Acids Res. 2008;36:e109–e109. doi: 10.1093/nar/gkn434. [DOI] [PMC free article] [PubMed] [Google Scholar]
- 6.Alvord G, Roayaei J, Stephens R, et al. et al. The DAVID gene functional classification tool: a novel biological module-centric algorithm to functionally analyze large gene lists. Genome Biol. 2007;8:R183. doi: 10.1186/gb-2007-8-9-r183. [DOI] [PMC free article] [PubMed] [Google Scholar]
- 7.Ashburner M, Ball CA, Blake JA, et al. et al. Gene Ontology: tool for the unification of biology. Nat Genet. 2000;25:25–29. doi: 10.1038/75556. [DOI] [PMC free article] [PubMed] [Google Scholar]
- 8.Yu G, Li F, Qin Y, et al. et al. GOSemSim: an R package for measuring semantic similarity among GO terms and gene products. Bioinformatics. 2010;26:976–978. doi: 10.1093/bioinformatics/btq064. [DOI] [PubMed] [Google Scholar]
- 9.Wang Y, Xia Y. Condition specific subnetwork identification using an optimization model. Proc Optim Syst Biol. 2008;9:333–340. [Google Scholar]
- 10.Wang J, Huang Q, Liu ZP, et al. et al. NOA: a novel network ontology analysis method. Nucleic Acids Res. 2011;39:e87–e87. doi: 10.1093/nar/gkr251. [DOI] [PMC free article] [PubMed] [Google Scholar]
- 11.Huang da W, Sherman BT, Lempicki RA, et al. et al. Systematic and integrative analysis of large gene lists using DAVID bioinformatics resources. Nat Protoc. 2008;4:44–57. doi: 10.1038/nprot.2008.211. [DOI] [PubMed] [Google Scholar]
- 12.Eden E, Navon R, Steinfeld I, et al. et al. GOrilla: a tool for discovery and visualization of enriched GO terms in ranked gene lists. BMC Bioinformatics. 2009;10:48. doi: 10.1186/1471-2105-10-48. [DOI] [PMC free article] [PubMed] [Google Scholar]
- 13.Wang JZ, Du Z, Payattakool R, et al. et al. A new method to measure the semantic similarity of GO terms. Bioinformatics. 2007;23:1274–1281. doi: 10.1093/bioinformatics/btm087. [DOI] [PubMed] [Google Scholar]
- 14. Bioconductor [ http://www.bioconductor.org/]. Carlson M, Falcon S, Pages H, et al. org.Sc.sgd.db: Genome wide annotation for Yeast. R package version 2.5.0. Available from: http://www.bioconductor.org/packages/release/data/annotation/html/org.Sc.sgd.db.html .
- 15. Bioconductor [ http://www.bioconductor.org/]. Carlson M, Falcon S, Pages H, et al. org.Hs.eg.db: Genome wide annotation for Human. R package version 2.5.0. Available from: http://www.bioconductor.org/packages/release/data/annotation/html/org.Hs.eg.db.html .
- 16.Gentleman RC, Carey VJ, Bates DM, et al. et al. Bioconductor: open software development for computational biology and bioinformatics. Genome Biol. 2004;5:R80. doi: 10.1186/gb-2004-5-10-r80. [DOI] [PMC free article] [PubMed] [Google Scholar]
- 17.Carbon S, Ireland A, Mungall CJ, et al. et al. AmiGO: online access to ontology and annotation data. Bioinformatics. 2009;25:288–289. doi: 10.1093/bioinformatics/btn615. [DOI] [PMC free article] [PubMed] [Google Scholar]
- 18.Network Ontology Analysis. http://app.aporc.org/NOA/. Updated July 16th, 2011.
- 19.Luscombe NM, Babu MM, Yu H, et al. et al. Genomic analysis of regulatory network dynamics reveals large topological changes. Nature. 2004;431:308–312. doi: 10.1038/nature02782. [DOI] [PubMed] [Google Scholar]
- 20.DAVID Functional Annotation Bioinformatics Microarray Analysis. http://david.abcc.ncifcrf.gov/.
- 21.Hengel RL, Thaker V, Pavlick MV, et al. et al. Cutting edge: L-selectin (CD62L) expression distinguishes small resting memory CD4+ T cells that preferentially respond to recall antigen. J Immunol. 2003;170:28–32. doi: 10.4049/jimmunol.170.1.28. [DOI] [PubMed] [Google Scholar]
- 22.Cicala C, Arthos J, Selig SM, et al. et al. HIV envelope induces a cascade of cell signals in non-proliferating target cells that favor virus replication. Proc Natl Acad Sci USA. 2002;99:9380–9385. doi: 10.1073/pnas.142287999. [DOI] [PMC free article] [PubMed] [Google Scholar]
- 23.Van't Veer LJ, Dai H, van de Vijver MJ, et al. et al. Gene expression profiling predicts clinical outcome of breast cancer. Nature. 2002;415:530–536. doi: 10.1038/415530a. [DOI] [PubMed] [Google Scholar]
- 24.Frost HR, McCray AT. Markov chain ontology analysis (MCOA) BMC Bioinformatics. 2012;13:23. doi: 10.1186/1471-2105-13-23. [DOI] [PMC free article] [PubMed] [Google Scholar]


