Abstract
By altering the electrostatic charge of histones or providing binding sites to protein recognition molecules, Chromatin marks have been proposed to regulate gene expression, a property that has motivated researchers to link these marks to Cis-regulatory elements. With the help of next generation sequencing technologies, we can now correlate one specific chromatin mark with regulatory elements (e.g. enhancers or promoters) and also build tools, such as hidden Markov models, to gain insight into mark combinations. However, hidden Markov models have limitation for their character of generative models and assume that a current observation depends only on a current hidden state in the chain. Here, we employed two graphical probabilistic models, namely the linear conditional random field model and multivariate hidden Markov model, to mark gene regions with different states based on recurrent and spatially coherent character of these eight marks. Both models revealed chromatin states that may correspond to enhancers and promoters, transcribed regions, transcriptional elongation, and low-signal regions. We also found that the linear conditional random field model was more effective than the hidden Markov model in recognizing regulatory elements, such as promoter-, enhancer-, and transcriptional elongation-associated regions, which gives us a better choice.
Keywords: Epigenetics, histone modification, conditional random field, regulatory elements
Gene expression is modulated from the transcription step to the post-translational modification step, all under the cooperative influence of factors that regulate transcription, epigenetics, and nuclear export. However, our knowledge about the characters and machenism of regulatory elements is limit. Although epigenetics has significant impact on the regulation of gene expression[1]–[3], little is known about the histone modifications—key players in epigenetics and their relationship with regulation.
Although the debate of “histone code” hypothesis[4] which proposed that the transcription of genetic information encoded in DNA is in part regulated by chemical modifications to histone proteins has subsided, histone modifications and their relationship with gene expression are still being widely studied because histone modifications identify transcriptional regulatory elements (e.g. promoters and enhancers). Many histone modifications have been reported to be highly related with gene transcription. Heintzman et al.[5] mapped five histone modifications to the human genome to distinguish promoters from enhancers, and they found histone H3 trimethylated at lysine 4 (H3K4me3) and monomethylated H3K4 (H3K4me1) to be enriched at active promoters and enhancers. Further, Creyghton et al.[6] proposed that acetylation of histone H3 at lysine 27 (H3K27ac) distinguished active enhancers from inactive/poised enhancer elements containing H3K4me1 alone. Guenther et al.[7] found that nucleosomes with H3K4me3 and H3K9ac occupied the promoters of most protein-coding genes. H3K36me3 and its relationship with the transcribed region of genes have been well documented in mammals and yeast[8]. This modification is made co-transcriptionally and catalyzed by Set2 histone methytransferase, which is associated with elongating RNA polymerase[9],[10]. Barski et al.[11] tested human CD4+ T cell and found H3K36me3 enriched in 3′ of active genes. In CD4+ T lymphocytes cells, enrichment of H3K4me2 in genomic regions surrounding transcription start sites suggests this modification is also linked to enhancers and promoters[12]. The CCCTC- binding factor (CTCF) is a well known insulator-binding protein in vertebrates[13],[14]. Moreover, H3K20me1, which localizes downstream from transcription start sites, provides a strong signal of the transcription region[11],[15].
In this study, we used these marks (H3K4me1, H3K4me2, H3K4me3, H3K9ac, H3K27ac, H3K36me3, H3K20me1, and CTCF) to recognize regulatory elements in or near gene regions. Taking the combinations of these marks as features, we employed the linear conditional random field (CRF) model to predict their corresponding chromatin states. We also built a hidden Markov model (HMM) for comparison. Though the HMM has been realized by Ernst et al.[16],[17], the tool is unavailable now. Furthermore, for HMMs, initialization can be taken in different ways, which could lead to very different results. We believe CRF will work better.
Methods
Input data for modeling
Our raw datasets were WIG format files[16], which are designed for display of dense continuous data. Each file contains signal information for H3K4me1, H3K4me2, H3K4me3, H3K9ac, H3K27ac, H3K36me3, H3K20me1, and CTCF in CD4+ T cells. Because nucleosome core particles consist of 147 base pairs (bp) of DNA and the DNA sequences that separate each pair of nucleosomes are approximately 50 bp, we first divided the whole genome into 200-bp non-overlapping intervals. Then we analyzed whether the aforementioned marks were present using Ernst's signal files and thresholds[16]. We identified 24 sequences  with length Tc, corresponding to 24 chromosomes. The position of each sequence indicated a combination of marks in the corresponding interval, i.e.
  , where
 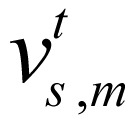 is binary; if the signal of chromatin mark at position of chromosome is higher than predefined threshold,
 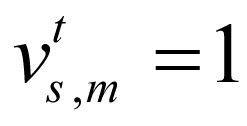 , otherwise
 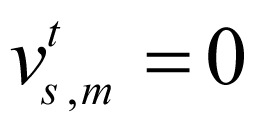 . M is the number of chromatin marks.
To identify regulatory elements that correspond to chromatin marks, we extracted known genes (N = 39,991 genes) in each interval using annotations from Refseq and then extended 5 kb on both sides of selected genes to cover possible regulatory elements. After extracting chromatin marks of these extended gene regions from 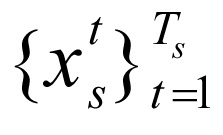 , s = 1, …, 24, there were N = 39,991 subsequences of combinations of chromatin marks,
  , c = 1, …, N, which comprised the primary dataset used in this study. In this equation,
 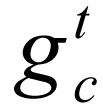 denotes the combination of marks at position t of gene c, extracting for
 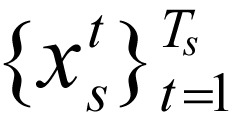 , s = 1, ..., 24. For fast and stable model learning, we randomly screened out 0.5 percent of the extended gene regions with lengths between 11 kb and 110 kb. These genes were selected from different chromosomes and long enough (6.023 Mb) to determine different chromatin states.
The probabilistic model
Our first model was a multivariate HMM that is a sequence version of naive Bayes. This type of generative model is based on the joint distribution of input observations and output hidden states that we wish to predict. Let chromatin states be hidden states of HMM. Each state depends only on its immediate predecessor described by a transition probabilities bij from state i to state j. At each time point of this hidden sequence, a chromatin state emits a corresponding combination of marks from a distribution described by a product of independent Bernoulli distribution (Figure 1).
Figure 1. The probabilistic model of hidden Markov model (HMM) and conditional random field (CRF). These two graphical models have different structures.

Let K be the number of hidden states,  be the unobserved state sequence corresponding to sequence gc. pk,m (k=1, …, K, m=1,…M) denote the probability that the mark occurs when the current state is K, and
  be the specific combination of marks at point t of hidden sequence gc, the probability of an observation is
 |
(1) |
The distribution of the initial state S0 in each extended gene region is, P (S0 = i)=αj, i=1, …, K. Then the likelihood function (joint distribution) is
 |
(2) |
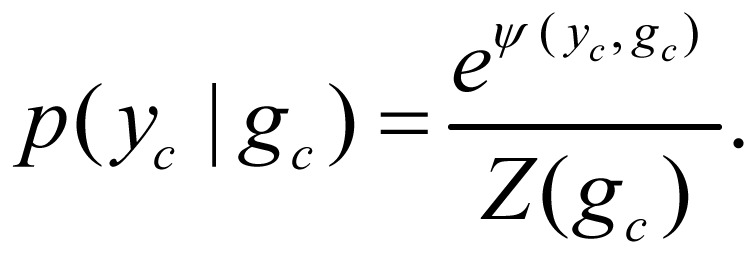
The second probabilistic model is based on a multivariate instance of a CRF model[18],[19] that is a sequence version of logistic regression. This kind of discriminative model is based on the conditional distribution of output hidden variables given input observations. They don't need to model p(x). This character allows the CRF models to be applied to a wide range of applications. In our application, the CRF model was defined as
 |
(3) |
In equation (3), Z(gc), a normalization function, was defined as  . Factor ψ(yc, gc) integrates the transition potential function
  between state
 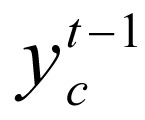 and state
  and local evidence function
  :
:
 |
(4) |
where I is indicator function. In our study,  was treated as parameterized:
 |
(5) |
The feature function in a CRF model may depend on observations from any time point, thus making  very flexible. For this study, we chose the following feature function:
 |
(6) |
where 
This definition links the current hidden state with the three nearest observations (Figure 1), which allowed us to incorporate context information to find chromatin states. From this point of view, the CRF model is more powerful than the HMM.
Model learning
For the HMM, we used the Baum-Welch algorithm to maximize its likelihood function. Because the local algorithm is expectation-maximization (EM), the result of HMM largely depends on the initial values of the parameters. To reduce the effect of the local maximum, we used the fuzzy c-means (FCM) method to get initial values of the parameters {α0,b0,p0}. Then a local optimum of the parameters was found using the standard EM based Baum-Welch algorithm.
For the CRF model, we used an iterative learning method to infer the model parameters {θij, i,j =1, k, pk,m, k=1,…,K, m=1,…,M} and yc, c=1,…,N:
Step 1: Initialize the parameters of the CRF model using FCM, and use this model to infer hidden states yc, c=1,…,N;
Step 2: Train the model and update parameters using inferred hidden states;
Step 3: Infer, yc, c = 1, …, N using new model; and
Step 4: Repeat step 2 until convergence.
Model assessment
First, we used trained HMM and CRF models to predict chromatin states of extended gene regions on test data. We are going to use a simple cross-validation to get a preliminary assessment of the stability of these two models.
Let fij be the frequency of a chromatin mark associated with each state, defined as
 |
(7) |
After training and prediction, we obtained two frequency matrices Ftrain and Ftest. For the CRF model or HMM, the generalization performance was measured by
Bias =|Ftrain/100–Ftest/100|2.
Second, we used external gene annotation data to validate the inferred results from our models. We started by using transcription start site data. Gene annotations were the Refseq annotations[20] obtained from the University of California Santa Cruz (UCSC) genome browser. After determining the transcription start site from known genes, we extended them on both sides to get ±2k (k = 2,000) transcription start site regions that may contain many regulatory elements, especially promoters and enhancers. This true may help us to recognize histone modification combinations that characterize promoters and enhancers. Further, after using CRF or HMM, hidden states in transcription start site regions are figured out. If these states occur in other regions, such as introns, sites corresponding to these states are putative enhancers. We also used DNase I hypersensitivity data produced by DNase-chip[21]. This Encyclopedia of DNA Elements (ENCODE) data describe areas hypersensitive to DNase as determined by assay in a large collection of cell types. Regulatory regions in general and promoters in particular tend to be DNase sensitive. Instead of using the whole set of data, we chose DNase hypersensitive areas whose scores exceeded the mean score of all DNase hypersensitive areas. Similarly, we detected some states to be enriched in transcription start site regions. These states may be putative enhancers or promoters.
For enrichment, we used following definition. Let PIntersect be the sum of the posterior probabilities of a state in intervals intersecting the external data source and PWhole be the sum of the posterior probabilities of this state over all 200-bp intervals. Then, state enrichment (E) was defined as
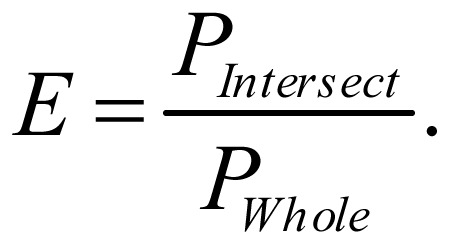 |
(8) |
Further, we studied the relative position of these states enriched in transcription start sites regions. Some of them concentrated in the upstream, and other was in the downstream. An index called “fold percentage” was defined to demonstrate this character. Let l1 be the frequency of a state present in a specific 200-bp interval of a transcription start site regions, l2 be the frequency of a state present in all intervals of transcription start site regions, l3 be the number of 200-bp intervals in transcription start site regions, and l4 be the total number of 200-bp intervals in all gene regions. Then, fold percentage was defined as
 |
(9) |
High “fold percentage” means high concentration at corresponding position. We plotted the curve of fold percentage in transcription start site regions and found the position of a state with respect to the transcription start site.
Results
Stability of the HMM and CRF models
First, we compared the stability of the HMM model and CRF model. Table 1 lists the frequency of marks found at each chromatin state using training data in the CRF model. We then used the trained model to infer states from test data and reported the resultant mark frequency in Table 2. Differences in mark frequencies between the training and test data were small, and the bias was 0.289,5 for the CRF model and 0.298,8 for the HMM. If we view these frequency matrices as the result of clustering, models with smaller bias are less over-fit and more stable.
Table 1. Mark frequency at each state revealed by the conditional random field (CRF) model on training data.
| State | H3K36me3 | H4K20me1 | H3K4me1 | H3K4me2 | H3K4me3 | H3K9ac | H3K27ac | CTCF |
| 1 | 1 | 0 | 2 | 98 | 100 | 98 | 100 | 14 |
| 2 | 0 | 0 | 0 | 16 | 100 | 57 | 84 | 29 |
| 3 | 6 | 78 | 25 | 36 | 99 | 59 | 64 | 31 |
| 4 | 0 | 39 | 88 | 100 | 100 | 80 | 100 | 16 |
| 5 | 0 | 0 | 0 | 34 | 74 | 6 | 23 | 5 |
| 6 | 16 | 100 | 98 | 90 | 87 | 16 | 51 | 5 |
| 7 | 4 | 100 | 100 | 63 | 49 | 0 | 14 | 2 |
| 8 | 0 | 100 | 100 | 0 | 0 | 0 | 0 | 0 |
| 9 | 1 | 0 | 97 | 79 | 56 | 3 | 19 | 0 |
| 10 | 4 | 0 | 99 | 3 | 1 | 3 | 9 | 3 |
| 11 | 0 | 100 | 0 | 0 | 0 | 0 | 0 | 4 |
| 12 | 2 | 98 | 0 | 28 | 82 | 2 | 4 | 4 |
| 13 | 100 | 0 | 0 | 0 | 0 | 0 | 0 | 0 |
| 14 | 100 | 100 | 0 | 0 | 0 | 0 | 0 | 0 |
| 15 | 0 | 0 | 0 | 0 | 0 | 0 | 0 | 1 |
Table 2. Mark frequency at each state revealed by the CRF model on test data.
| State | H3K36me3 | H4K20me1 | H3K4me1 | H3K4me2 | H3K4me3 | H3K9ac | H3K27ac | CTCF |
| 1 | 1 | 0 | 0 | 100 | 100 | 98 | 100 | 17 |
| 2 | 0 | 0 | 0 | 17 | 100 | 54 | 84 | 26 |
| 3 | 3 | 82 | 20 | 33 | 100 | 61 | 70 | 21 |
| 4 | 0 | 37 | 88 | 100 | 100 | 74 | 100 | 12 |
| 5 | 0 | 0 | 0 | 34 | 79 | 5 | 19 | 6 |
| 6 | 5 | 100 | 100 | 90 | 92 | 13 | 55 | 6 |
| 7 | 4 | 100 | 100 | 72 | 37 | 0 | 17 | 5 |
| 8 | 1 | 100 | 100 | 0 | 0 | 0 | 0 | 2 |
| 9 | 1 | 0 | 100 | 70 | 60 | 2 | 32 | 2 |
| 10 | 2 | 0 | 99 | 2 | 1 | 3 | 10 | 3 |
| 11 | 0 | 100 | 1 | 0 | 0 | 1 | 0 | 2 |
| 12 | 6 | 98 | 0 | 32 | 75 | 1 | 12 | 11 |
| 13 | 100 | 0 | 0 | 0 | 0 | 0 | 0 | 1 |
| 14 | 100 | 100 | 28 | 0 | 0 | 0 | 0 | 1 |
| 15 | 0 | 0 | 0 | 0 | 0 | 0 | 0 | 1 |
Chromatin state analysis
Though the states revealed by CRF and HMM are different, they could be roughly divided into four groups: promoter-associated states, enhancer-associated states, transcribed region-associated states, and low-signal states.
Promoter-associated states
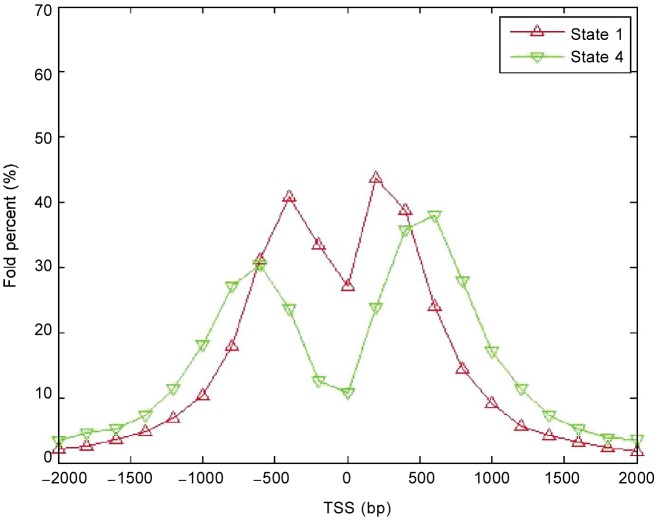
For states determined with the CRF model, the first group (states 1–5), especially states 1–4, were highly enriched in promoter regions. As shown in Figure 2, these four states were concentrated in transcription start site regions according to Refseq. Enrichment in these regions ranged from 56% to 73% (Figure 2C), whereas enrichment was only 14% in gene regions. This result agrees with the frequency matrix from which we found these states corresponding to strong signal of H3K4me3. In addition to transcription start site regions, we also computed the enrichment of each state in DNase I hypersensitivity regions, which is an accurate method of identifying the location of gene regulatory elements, especially promoters[22]. Figure 2D shows that states 1–4 have significant enrichments for DNase I sites, which improves the credibility of our results. State 5 showed weak signal for H3K4me3 (Table 1), which was annotated as a poised promoter. Further, we researched the positions of these four promoter states with respect to the transcription start site using fold percentage, and found that they could be divided into two groups based on the shape of the curves. Group 1 contained states 2 and 3 (Figure 3), which had one peak and centered at the transcription start site, whereas group 2 contained states 1 and 4 (Figure 4), which had dual peaks: one upstream and the other downstream.
Figure 2. Results of CRF.
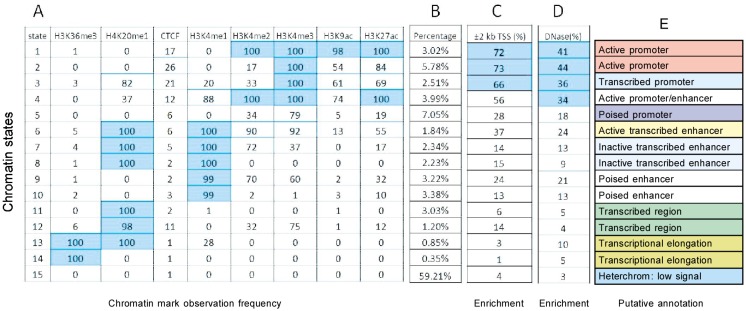
A, chromatin states learned by CRF models and the frequency with which a mark is found at each of these states. B, the percentages of these states in whole gene regions. C, enrichment of each chromatin state in transcription start site (TSS) regions. D, enrichment of each chromatin state in DNase I hypersensitivity regions. E, putative annotations for each chromatin state.
Figure 3. Fold percentage of states 2 and 3 in the TSS region retrieved by CRF.
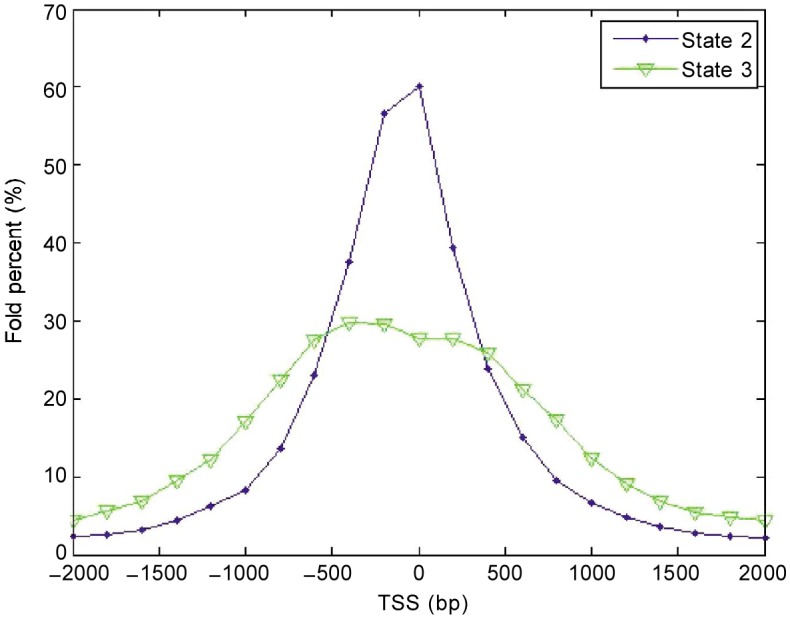
The higher the fold percentage, the higher the concentration of a state at corresponding location. The states are concentrated at the transcription start sites.
Figure 4. Fold percentage of states 1 and 4 in the TSS region retrieved by CRF.
The higher the fold percentage, the higher the concentration of a state at corresponding location. The states are enriched upstream and downstream of the transcription start site.
The promoter-associated states revealed by HMM were very different from those revealed by the CRF model (Figure 5). With the HMM, five states showed stronger signal in promoters than other states. State 1 was the most enriched in transcription start site and DNase I hypersensitivity regions and represented a high frequency of H3K4me3 and H3k27ac (Table 2), and was accordingly annotated as active promoter. In gene regions, state 1 covered 6.28% of 200-bp intervals, which was lower than active promoters retrieved by CRF. State 2 was a mix of enhancers and promoters, like state 4 in the CRF model. Furthermore, though state 3 showed a strong signal of H3K4me3, the frequencies of H3k9ac and H3k27ac were low, suggesting a weak promoter.
Figure 5. The result summary of hidden Markov model.
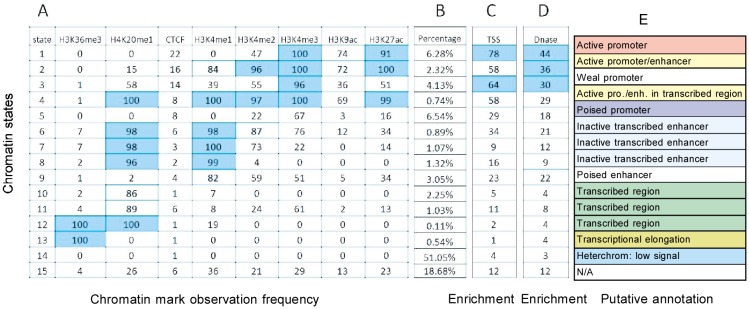
A, chromatin states learned by HMM and the frequency with which a mark is found at each of these states. B, the percentages of these states in whole gene regions. C, enrichment of each chromatin state in TSS regions. D, enrichment of each chromatin state in DNase I hypersensitivity regions. E, putative annotations for each chromatin state. N/A, there was insufficient information for annotation.
Enhancer-associated states
In the second group of states found using the CRF model, states 6–10, the frequency of H3K4me1 was high, which is a high credibility mark of enhancers[5],[21]. Some of these states were also hypersensitive to DNase I, though not as much as promoter states. We divided these six states into three subgroups according their putative annotations: actively transcribed enhancers, which showed a high frequency of H3K27ac, a mark that distinguishes active enhancers from inactive/poised enhancers containing H3K4me1 alone[6]; states 7 and 8, which showed a low frequency of H3K27ac, high frequency of H4K20me1, and localization both downstream of transcription start sites and throughout the entire transcribe region; and finally, poised enhancers, which showed high H3K4me1 signal but lacked H3K27ac.
Enhancer-associated states (states 6–9) from HMM were divided into two subgroups (inactive transcribed enhancer and poised enhancer). The total percentage of these states in all gene regions was 6.42%, only half the percentage revealed by CRF (13%). Furthermore, the CRF model did not find active enhancers, but state 9 was annotated as a poised enhancer. Nevertheless, H3K4me1 frequency corresponding to state 9 in HMM was smaller than that for states 9 and 10 in the CRF model, and the percentage of poised enhancers retrieved by HMM was half that retrieved by CRF. In short, these findings show that HMM found less putative enhancer regions than CRF.
Transcribed region–associated states
Transcribed region–associated states (states 11–14 in CRF and states 10–13 in HMM) were divided into two subgroups: transcribed regions and transcriptional elongation. These states were all far from the transcription start site and DNase I hypersensitivity regions. The first subgroup showed a strong signal for H3K20me1 in the CRF model (Figure 2). However, in HMM, the percentage of H3K20me1 was lower, suggesting some intervals marked as states 10 and 11 by HMM do not have H3K20me1 signal. This shows the HMM results to be less credible. The second subgroup contained states related to transcriptional elongation. These states presented a strong signal for H3K36me3 in the CRF model. However, HMM retrieved fewer transcriptional elongation–associated intervals.
Low-signal states
The CRF revealed that 59% of 200-bp non-overlapping intervals in gene regions had almost no signal of histone modification, whereas the HMM result was 51%. These states were far from the transcription start site and DNase I hypersensitivity regions. State 15 in HMM was annotated as N/A (no available) because there was insufficient information for annotation. State 15 has the second largest percentage among all states revealed by HMM, but presents weak signals of combination of several histone modifications (Figure 5), whereas the states retrieved by CRF could all be annotated with high credibility. From this perspective, CRF is more effective in regulatory element detection.
Discussion
In this study, we used two graphic models to identify the regulatory elements near gene regions. These two models first retrieved hidden states and then these states can be annotated by analyzing their mark combination frequencies and enrichment in two sets of external data: Refseq transcription start site and DNase I hypersensitivity. The results demonstrate that both the CRF model and HMM revealed chromatin states that may correspond to enhancers and promoters, transcribed regions, transcriptional elongation, and low-signal regions. However, compared with HMM, CRF was more effective in distinguishing regulatory elements (promoter-, enhancer- and transcriptional elongation-associated regions) from other states. About 20% of intervals could not be annotated using HMM, and there are two possible reasons: first, HMMs are generative, making them less effective than discriminative models like CRF when applied to classification; and second, HMMs assume that the current observation depends only on the current hidden state, which is impractical in many applications. In further studies, we can verify the advantage of CRF in more applications. Furthermore, to improve the accuracy of our results and make annotation even reliable, we need more external data. For regulary element detection, in addition to models, external data, like DNase I, are good complement to be used as features or for positive control.
Acknowledgments
We would like to acknowledge the members of Translational Biosystems Lab for the valuable discussions. This work is partially funded by grants from the NIH R01LM010185-03 (Zhou), NIH U01HL111560-01 (Zhou), NIH 1R01DE022676-01 (Zhou), and DoD TATRC (Zhou).
References
- 1.Suganuma T, Workman JL. Signals and combinatorial functions of histone modifications. Annu Rev Biochem. 2011;80:473–499. doi: 10.1146/annurev-biochem-061809-175347. [DOI] [PubMed] [Google Scholar]
- 2.Jaenisch R, Bird A. Epigenetic regulation of gene expression: how the genome integrates intrinsic and environmental signals. Nature genetics. 2003;33:245–254. doi: 10.1038/ng1089. [DOI] [PubMed] [Google Scholar]
- 3.Grewal SIS, Moazed D. Heterochromatin and epigenetic control of gene expression. Science. 2003;301:798–802. doi: 10.1126/science.1086887. [DOI] [PubMed] [Google Scholar]
- 4.Jenuwein T, Allis CD. Translating the histone code. Science. 2001;293:1074–1080. doi: 10.1126/science.1063127. [DOI] [PubMed] [Google Scholar]
- 5.Heintzman ND, Stuart RK, Hon G, et al. et al. Distinct and predictive chromatin signatures of transcriptional promoters and enhancers in the human genome. Nat Genet. 2007;39:311–318. doi: 10.1038/ng1966. [DOI] [PubMed] [Google Scholar]
- 6.Creyghton MP, Cheng AW, Welstead GG, et al. et al. Histone H3K27ac separates active from poised enhancers and predicts developmental state. Proc Natl Acad Sci USA. 2010;107:21931–21936. doi: 10.1073/pnas.1016071107. [DOI] [PMC free article] [PubMed] [Google Scholar]
- 7.Guenther MG, Levine SS, Boyer LA, et al. et al. A chromatin landmark and transcription initiation at most promoters in human cells. Cell. 2007;130:77–88. doi: 10.1016/j.cell.2007.05.042. [DOI] [PMC free article] [PubMed] [Google Scholar]
- 8.Kouzarides T. Chromatin modifications and their function. Cell. 2007;128:693–705. doi: 10.1016/j.cell.2007.02.005. [DOI] [PubMed] [Google Scholar]
- 9.Krogan NJ, Kim M, Tong A, et al. et al. Methylation of histone H3 by Set2 in saccharomyces cerevisiae is linked to transcriptional elongation by RNA polymerase II. Mol Cell Biol. 2003;23:4207–4218. doi: 10.1128/MCB.23.12.4207-4218.2003. [DOI] [PMC free article] [PubMed] [Google Scholar]
- 10.Li J, Moazed D, Gygi SP. Association of the histone methyltransferase Set2 with RNA polymerase II plays a role in transcription elongation. J Biol Chem. 2002;277:49383–49388. doi: 10.1074/jbc.M209294200. [DOI] [PubMed] [Google Scholar]
- 11.Barski A, Cuddapah S, Cui K, et al. et al. High-resolution profiling of histone methylations in the human genome. Cell. 2007;129:823–837. doi: 10.1016/j.cell.2007.05.009. [DOI] [PubMed] [Google Scholar]
- 12.Wang Z, Zang C, Rosenfeld JA, et al. et al. Combinatorial patterns of histone acetylations and methylations in the human genome. Nat Genet. 2008;40:897–903. doi: 10.1038/ng.154. [DOI] [PMC free article] [PubMed] [Google Scholar]
- 13.Cuddapah S, Jothi R, Schones DE, et al. et al. Global analysis of the insulator binding protein CTCF in chromatin barrier regions reveals demarcation of active and repressive domains. Genome Res. 2009;19:24–32. doi: 10.1101/gr.082800.108. [DOI] [PMC free article] [PubMed] [Google Scholar]
- 14.Heath H, Ribeiro de Almeida C, Sleutels F, et al. et al. CTCF regulates cell cycle progression of alphabeta T cells in the thymus. EMBO J. 2008;27:2839–2850. doi: 10.1038/emboj.2008.214. [DOI] [PMC free article] [PubMed] [Google Scholar]
- 15.Mikkelsen TS, Ku M, Jaffe DB, et al. et al. Genome-wide maps of chromatin state in pluripotent and lineage-committed cells. Nature. 2007;448:553–560. doi: 10.1038/nature06008. [DOI] [PMC free article] [PubMed] [Google Scholar]
- 16.Ernst J, Kellis M. Discovery and characterization of chromatin states for systematic annotation of the human genome. Nat Biotechnol. 2010;28:817–825. doi: 10.1038/nbt.1662. [DOI] [PMC free article] [PubMed] [Google Scholar]
- 17.Ernst J, Kheradpour P, Mikkelsen TS, et al. et al. Mapping and analysis of chromatin state dynamics in nine human cell types. Nature. 2011;473:43–49. doi: 10.1038/nature09906. [DOI] [PMC free article] [PubMed] [Google Scholar]
- 18.Lafferty JD, McCallum A, Pereira FCN. Conditional random fields: probabilistic models for segmenting and labeling sequence data. Proceedings of the Eighteenth International Conference on Machine Learning. 2001:282–289. [Google Scholar]
- 19.Sutton C, McCallum A. MIT Press; 2006. An introduction to conditional random fields for relational learning: introduction to statistical relational learning. [Google Scholar]
- 20.Pruitt KD, Tatusova T, Maglott DR. NCBI reference sequences (RefSeq): a curated non-redundant sequence database of genomes, transcripts and proteins. Nucleic Acids Res. 2007;35(Database issue):D61–D65. doi: 10.1093/nar/gkl842. [DOI] [PMC free article] [PubMed] [Google Scholar]
- 21.Birney E, Stamatoyannopoulos JA, Dutta A, et al. et al. Identification and analysis of functional elements in 1% of the human genome by the encode pilot project. Nature. 2007;447:799–816. doi: 10.1038/nature05874. [DOI] [PMC free article] [PubMed] [Google Scholar]
- 22.Crawford GE, Holt IE, Whittle J, et al. et al. Genome-wide mapping of DNase hypersensitive sites using massively parallel signature sequencing (MPSS) Genome Res. 2006;16:123–131. doi: 10.1101/gr.4074106. [DOI] [PMC free article] [PubMed] [Google Scholar]


