Abstract
Immunophenotype is critical for diagnosing common B-cell acute lymphoblastic leukemia (common ALL) and detecting minimal residual disease. We developed a protocol to explore the immunophenotypic profiles of common ALL based on the expression levels of the antigens associated with B lymphoid development, including IL-7Rα (CD127), cytoplasmic CD79a (cCD79a), CD19, VpreB (CD179a), and sIgm, which are successive and essential for progression of B cells along their developmental pathway. Analysis of the immunophenotypes of 48 common ALL cases showed that the immunophenotypic patterns were highly heterogeneous, with the leukemic cell population differing from case to case. Through the comprehensive analysis of immunophenotypic patterns, the profiles of patient-specific composite leukemia cell populations could provide detailed information helpful for the diagnosis, therapeutic monitoring, and individualized therapies for common ALL.
Keywords: Common B-cell acute lymphoblastic leukemia, immunophenotype, diagnosis, heterogeneity, flow Cytometry
B-cell acute lymphoblastic leukemia (B-ALL) is a clonal malignant disease that originates from a single cell and is characterized by the accumulation of blast cells that then suppresses normal hematopoiesis[1]. Immunophenotypes identified with flow Cytometry can be used to determine the origin of leukemia cells and the maturational stage at which leukemia cells accumulate, as well as to provide basic information for diagnosis and therapeutic protocols[2]–[4]. Based on reactivity with antigens present on the surface or in the cytoplasm of leukemia cells, B-ALL can be divided into four subtypes according to its stage of differentiation: pro-B, common B, pre-B, and immature B subtypes[5].
Common B-ALL (common ALL) is the major immunological subtype in adult B-ALL and represents more than 50% of adult B-ALL cases[6]. The blast cells are positive for CD10, CD19, cytoplasmic CD79a (cCD79a), and CD34, but are negative for surface and cytoplasmic immunoglobulins[5]. Common ALL has a good prognosis in childhood B-ALL cases, but the prognosis of adult common ALL patients are inconsistent[7]. The reasons for this phenomenon still require investigation.
Immunophenotyping of common ALL with flow Cytometry is essential to define cell lineage and to establish a correct diagnosis[8],[9]. As we have recapitulated, there is a great deal of evidence now suggesting that human B-ALLs are heterogeneous tissues in which cancer stem cells have the ability to recreate the heterogeneity of the original tumor[10]. Heterogeneity in antigen marker expression is also well known in B-ALL[11], but has rarely been studied in adult common ALL. Therefore, a 7-color-panel strategy was designed to detect phenotypic heterogeneity in adult common ALL using a combination of monoclonal antibodies, including IL-7Rα (CD127), cCD79a, CD19, VpreB (CD179a), and sIgm, which are sequentially expressed during B-cell developmental progression. CD127 is expressed from common lymphoid progenitor (CLP) to pro-B cells (CD34+CD10+CD19+) upon the onset of human B-cell development[12]. The binding of interleukin-7 (IL-7) to CD127 activates multiple pathways that regulate B-cell survival, glucose uptake, proliferation, and differentiation[13]–[15]. CD79a is identified as the B-cell antigen that is present across the developmental spectrum, from pre-B cells to plasma cells. CD179a, a member of the Ig gene superfamily, is expressed on the surface of early pre-B cells and non-covalently associates with CD179b (λ5) to form surrogate light chains, which pair with the variable region of µHC (the first isotype of immunoglobulin heavy chain) to form the pre-B-cell receptor complex[16]–[18]. CD179a expression is a key marker that is a characteristic of lymphocytes making the pro-B to pre-B transition[19]. While all these markers have been routinely used to exclusively characterize B-ALU[1],[5],[20], the relationships among these antigens and their significance in adult common ALL patients remain unclear.
In this study, we determined whether investigation of certain features of composite immunophenotyping at diagnosis in a common ALL cohort would provide further data for diagnosis and prognosis. We found that adult common ALL has immunophenotypically heterogeneous leukemia cell populations that have distinct subpopulations with bimodal marker expression or populations with broad marker expression. The results showed that the phenotypic patterns of common ALL patients had significant heterogeneity and were able to provide individualized information concerning the leukemia cell population for each patient.
Materials and Methods
Patients and samples
Six bone marrow (BM) samples from healthy donors were obtained as controls. Forty-eight adult common ALL patients treated at the West China Hospital were enrolled between May 2008 and March 2011. There were no differences in the distribution of characteristics [sex, age, white blood cell (WBC), platelet (PLT), hemoglobin (Hb), BCR-ABL fusion gene] between the groups A, B, C, and D (P > 0.05 for all comparisons), except for the response to 4-week induction chemotherapy (Table 1). These patients had been given a definite diagnosis of common ALL in accordance with the 2008 World Health Organization (WHO) classification[5]. All patients were treated with 4 weeks of induction chemotherapy, which based on vincristine, prednisone/dexamethasone, and/or adding anthracycline, asparaginase, or both. When BCR-ABL fusion gene was positive, imatinib was added. The study was conducted according to Institutional Ethical Committee requirements. Informed consent was obtained from each volunteer and patient.
Table 1. Basic information for adult common acute lymphoblastic leukemia (ALL) patients tested.
| Characteristic | Group A | Group B | Group C | Group D | P |
| Age (years) | 0.4823 | ||||
| < 45 | 24 | 3 | 5 | 5 | |
| ≥ 45 | 7 | 1 | 0 | 3 | |
| Gender | 0.2772 | ||||
| Male | 20 | 2 | 5 | 4 | |
| Female | 11 | 2 | 0 | 4 | |
| White blood cell (× 109/L) | 0.0639 | ||||
| < 50 | 24 | 3 | 5 | 3 | |
| ≥ 50 | 7 | 1 | 0 | 5 | |
| Platelet (× 109/L) | 0.1243 | ||||
| < 30 | 9 | 3 | 1 | 1 | |
| ≥ 30 | 22 | 1 | 4 | 7 | |
| Hemoglobin (g/L) | 0.0721 | ||||
| < 60 | 5 | 3 | 1 | 2 | |
| ≥ 60 | 26 | 1 | 4 | 6 | |
| BCR-ABL fusion gene | 0.1593 | ||||
| Positive | 15 | 1 | 0 | 3 | |
| Negative | 10 | 3 | 3 | 2 | |
| Response | 0.0376 | ||||
| CR | 23 | 4 | 5 | 3 | |
| NR | 8 | 0 | 0 | 5 |
CR, complete remission; NR, no remission. The phenotypic patterns of 48 common ALL patients were divided into four groups (group A, group B, group C, and group D) according to the distribution of major leukemia populations. Differences in the baseline characteristics across the four groups were evaluated using the Chi-square test.
Flow Cytometry
A 7-color combination (FITC/PE/PE-Cy7/APC/APC-Cy7/AmCyan/DAPI) was used for the assay. Two tubes were set up for the examination: tube 1 contained CD179a/CD34/CD19/sIgm/CD10/CD45/DAPI, whereas tube 2 contained CD127/CD34/CD19/cCD79a/CD10/CD45/DAPI. CD127 and CD10 were obtained from BioLegend, CD179a was purchased from AbD Serotec, and the remaining antibodies were from Becton Dickinson (BD). Each antibody was titrated by serial dilutions. Red blood cells (RBCs) were lysed with ammonium chloride solution, and 1 × 10⁶ cells were used for each test. For tube 1, the surface antibodies were incubated for 30 min at 4°C, followed by viability staining with DAPI (Sigma Aldrich) for 5 min. For tube 2, after the surface antibodies were stained as in tube 1, the cells were fixed and permeabilized using FACS™ Permeabilizing Solution 2 (BD) and incubated for 30 min at room temperature. Subsequently, cCD79a was added and incubated for 30 min at 4°C before data were acquired using FACSAria (BD).
Data acquisition and analysis
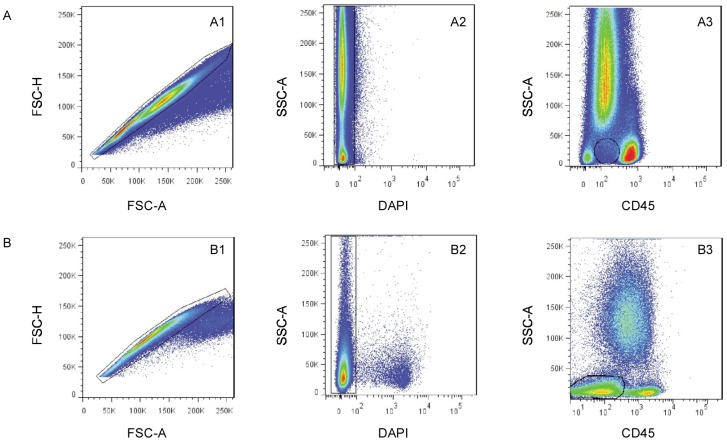
Data were acquired on a FACSAria cytometer equipped with FACS Diva 5.0 software (BD), and analyzed using FlowJo software (Tree Star). The instrument setup was standardized to reduce batch-to-batch shifting by daily monitoring with Rainbow beads (BD). A minimum of 100,000 events was acquired. The boundary between positive and negative cells was placed using fluorescence-minus-one controls and an internal control [21],[22]. Figure 1 illustrates the sequential gating strategy used in this study to mark leukemia cells for intensive analysis. At least 20% of leukemia cells were considered positive for each cellular population. Intraleukemia heterogeneity was shown in 3-D bubble plot viewers (in FlowJo; red: CD34; green: CD19; blue: CD10; size: CD34). Events that are more positive for a given parameter will appear brighter for that parameter's specified color. Event size will scale based on how positive/negative events are for a specified parameter. More positive events will appear larger, whereas those that are less positive will appear smaller. Distinct subpopulations were defined as separate populations, with each having their own peak in contour plots (in FlowJo; resolution: 128; percentage: 10) and histograms (described as bimodal expression). We defined broad expression of a marker to occur when a population had only one peak—using the outer line of the 10% contour plot as the boundary—that extended from one score into the middle of the neighboring score[23].
Figure 1. The sequential gating strategy applied for analysis of B-cell immunophenotypes excludes clumped and dead cells and debris.
A, the gating strategy as used in the control subjects. The side scatter vs. CD45 plot shows better separation of immature precursors. B, the gating strategy as used in B-cell acute lymphoblastic leukemia (B-ALL) patients. The leukemia cells were gated for further characterization.
Statistical analysis
For statistical analysis, SPSS (version 11.5, SPSS Inc., Chicago, IL, USA) was used for Chi-square test and nonparametric tests. Only cases with a P value less than 0.05 were considered significant. The data are presented as percentage (%) or mean ± standard deviation (SD).
Results
Phenotypic characterization of B lymphocytic lineage in normal and abnormal BM
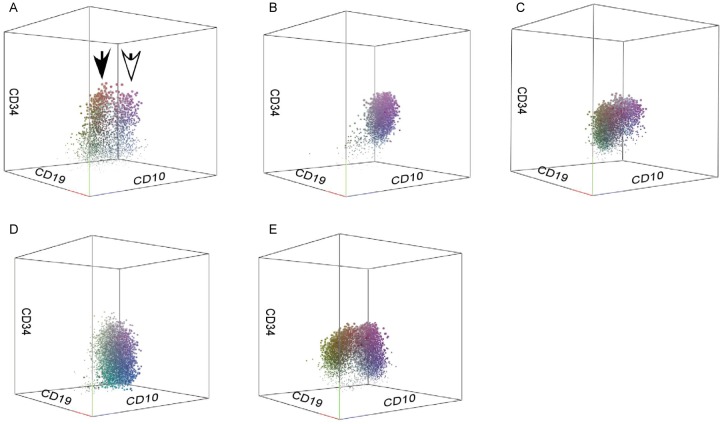
During B-cell development, the sequential and intensive patterns of antigen expression were virtually identical in the control group. The consecutive maturation stages from pre-B cells to mature B cells could be monitored by the coordinated acquisition and loss of leukocyte differentiation antigens. CD34+ cells were (0.65 ± 0.34)% and the CD34+CD19+CD10+CD179a−sIgm− population was (0.32 ± 0.22)% in normal BM (Figure 2A, open arrow). The CD34−CD19+CD10+CD179a−sIgm− population was easily observed in normal BM and represented (2.24 ± 1.02)% (range, 0.65% to 3.43%) of live cells (Figure 2A, solid arrow). Although B-cell blast populations were seen both in common ALL and normal hematogones, the immunophenotypic patterns of common ALL patients differed from that seen for the normal B-cell lineage in 3-D plots. The latter showed a continuum of marker expression and displayed a reproducible pattern of acquisition and loss of normal antigens during B-cell maturation. As compared with the immunophenotypic patterns of normal B-lymphoid lineage, common ALL patients had leukemia cells with the normal B-cell developmental immunophenotype, but each patient mostly had heterogeneous proportions of cell subpopulations (Table 2). These 3-D plots displayed substantial intraleukemia heterogeneity in all distinguishable immunophenotypic features, with various dot colors and sizes for each immunophenotype (Figure 2). Furthermore, the leukemia cells exhibited maturation arrest (without expression of sIgm) as well as over-, under-, and asynchronous expression of antigens observed on normal B-cell precursors. These features were useful for distinguishing neoplastic cells from normal B cells at different developmental stages according to the frequencies and immunophenotypic patterns.
Figure 2. 3-D analysis of common acute lymphoblastic leukemia (ALL) cells compared to normal bone marrow precursors.
As in the gating strategy illustrated in Figure 1, leukemia cells and normal immature precursors are indicated in the 3-D plot. Events more positive for CD34 will appear larger, whereas those less positive will appear smaller. A, the CD34+CD19+CD10+CD179a−sIgm− population is [(0.32 ± 0.22)% ] of live cells in normal bone marrow (open arrow), and the CD34−CD19+CD10+CD179a−sIgm− population is [(2.24 ± 1.02)%] of live cells (solid arrow). B–E, 3-D plots show four different individual immunophe-notypic patterns.
Table 2. Distribution of leukemia cell subpopulations in 48 patients with adult common ALL.
| Subpopulation | Number of patients |
|||
| 1% ≤ x* < 5% | 5% ≤ x < 10% | 10% ≤ x < 20% | x ≥ 20% | |
| CD19+CD34−CD179a+sIgm−CD10+ | 14 | 5 | 1 | 1 |
| CD19+CD34−CD179a+sIgm−CD10− | 1 | 0 | 0 | 0 |
| CD19+CD34−CD179a+sIgm+CD10+ | 2 | 1 | 0 | 0 |
| CD19+CD34−CD179a+sIgm+CD10− | 1 | 0 | 0 | 0 |
| CD19+CD34−CD179a−sIgm−CD10+ | 19 | 6 | 15 | 4 |
| CD19+CD34−CD179a−sIgm−CD10− | 29 | 1 | 2 | 1 |
| CD19+CD34−CD179a−sIgm+CD10+ | 4 | 0 | 0 | 0 |
| CD19+CD34−CD179a−sIgm+CD10− | 5 | 0 | 0 | 0 |
| CD19+CD34+CD179a+sIgm−CD10+ | 17 | 9 | 8 | 3 |
| CD19+CD34+CD179a+sIgm−CD10− | 4 | 0 | 1 | 0 |
| CD19+CD34+CD179a+sIgm+CD10+ | 7 | 1 | 0 | 0 |
| CD19+CD34+CD179a+sIgm+CD10− | 1 | 0 | 0 | 0 |
| CD19+CD34+CD179a−sIgm−CD10+ | 0 | 0 | 7 | 41 |
| CD19+CD34+CD179a−sIgm−CD10− | 11 | 4 | 6 | 2 |
| CD19+CD34+CD179a−sIgm+CD10+ | 4 | 1 | 0 | 0 |
| CD19+CD34+CD179a−sIgm+CD10− | 0 | 0 | 0 | 0 |
| CD19−CD34+CD179a+sIgm−CD10+ | 14 | 7 | 3 | 1 |
| CD19−CD34+CD179a+sIgm−CD10− | 5 | 0 | 0 | 0 |
| CD19−CD34+CD179a+sIgm+CD10+ | 3 | 0 | 0 | 0 |
| CD19−CD34+CD179a+sIgm+CD10− | 0 | 0 | 0 | 0 |
| CD19−CD34+CD179a−sIgm−CD10+ | 16 | 10 | 5 | 12 |
| CD19−CD34+CD179a−sIgm−CD10− | 25 | 2 | 1 | 0 |
| CD19−CD34+CD179a−sIgm+CD10+ | 1 | 0 | 0 | 0 |
| CD19−CD34+CD179a−sIgm+CD10− | 0 | 0 | 0 | 0 |
| CD19+CD34−CD127+CD79a−CD10+ | 2 | 0 | 0 | 0 |
| CD19+CD34−CD127+CD79a−CD10− | 1 | 0 | 0 | 0 |
| CD19+CD34−CD127+CD79a+CD10+ | 7 | 1 | 0 | 0 |
| CD19+CD34−CD127+CD79a+CD10− | 0 | 0 | 0 | 0 |
| CD19+CD34−CD127−CD79a−CD10+ | 23 | 3 | 4 | 2 |
| CD19+CD34−CD127−CD79a−CD10− | 14 | 1 | 0 | 1 |
| CD19+CD34−CD127−CD79a+CD10+ | 15 | 8 | 7 | 5 |
| CD19+CD34−CD127−CD79a+CD10− | 16 | 2 | 1 | 0 |
| CD19+CD34+CD127+CD79a−CD10+ | 9 | 1 | 0 | 0 |
| CD19+CD34+CD127+CD79a−CD10− | 3 | 1 | 0 | 1 |
| CD19+CD34+CD127+CD79a+CD10+ | 16 | 3 | 3 | 2 |
| CD19+CD34+CD127+CD79a+CD10− | 6 | 1 | 0 | 0 |
| CD19+CD34+CD127−CD79a−CD10+ | 16 | 14 | 11 | 4 |
| CD19+CD34+CD127−CD79a−CD10− | 20 | 4 | 4 | 2 |
| CD19+CD34+CD127−CD79a+CD10+ | 0 | 1 | 11 | 35 |
| CD19+CD34+CD127−CD79a+CD10− | 18 | 6 | 2 | 2 |
| CD19−CD34+CD127+CD79a−CD10+ | 6 | 1 | 0 | 1 |
| CD19−CD34+CD127+CD79a−CD10− | 4 | 0 | 0 | 0 |
| CD19−CD34+CD127+CD79a+CD10+ | 6 | 2 | 1 | 0 |
| CD19−CD34+CD127+CD79a+CD10− | 0 | 0 | 0 | 0 |
| CD19−CD34+CD127−CD79a−CD10+ | 19 | 11 | 9 | 1 |
| CD19−CD34+CD127−CD79a−CD10− | 20 | 7 | 3 | 0 |
| CD19−CD34+CD127−CD79a+CD10+ | 19 | 11 | 18 | 4 |
| CD19−CD34+CD127−CD79a+CD10− | 12 | 2 | 3 | 0 |
“x” represents percentage of the subpopulations in leukemia cells.
Immunophenotypic patterns of common ALL
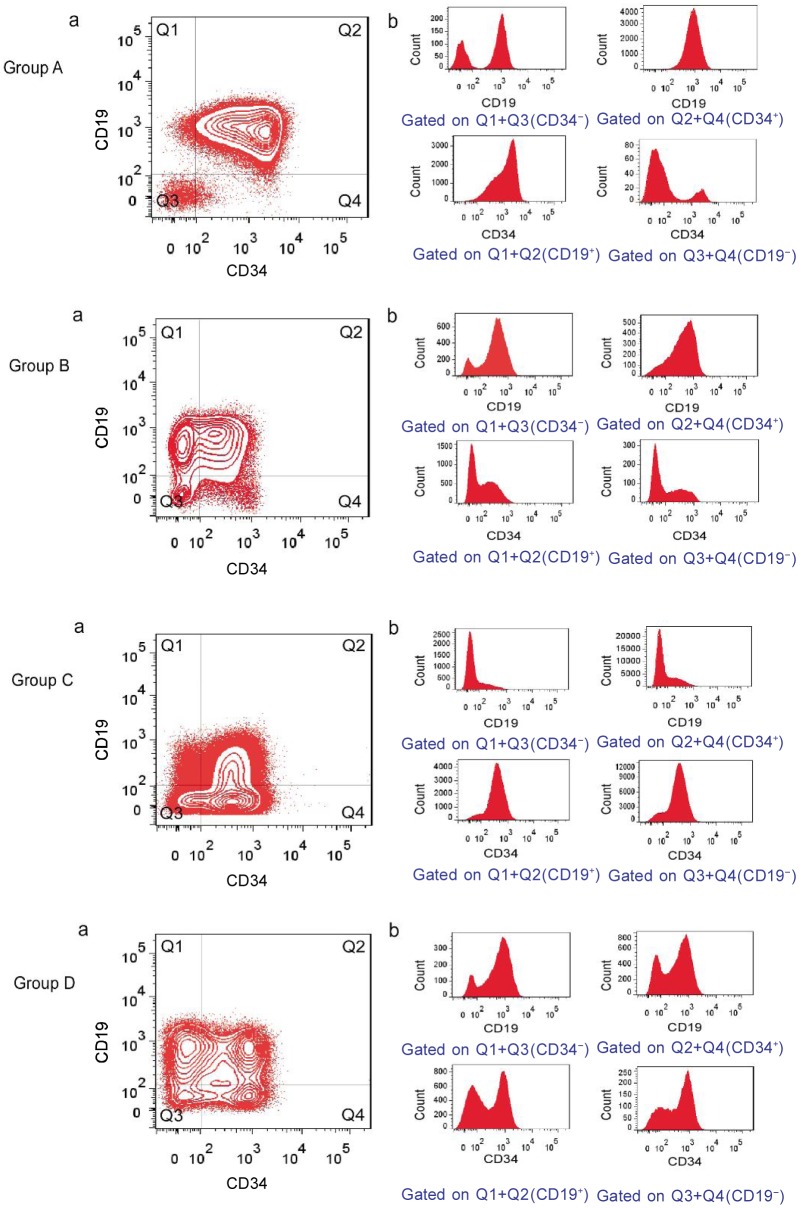
In analyzing immunophenotypic marker expression in blast populations at diagnosis, more than half (25/48) of patients in this study had immunophenotypically distinct subpopulations as defined by their bimodal antigen expression, which often comprised more than 10% oftotal blast cells (Table 3, Figure 3). The subpopulations were characterized by a bimodal expression of CD34 (20/48), CD10 (17/48), and CD19 (11/48), with 4 patients showing bimodal expression of CD34, CD10, and CD19, 7 showing bimodal expression of CD34 and CD19, and 9 showing bimodal expression of CD34 and CD10. Several examples of bimodal expression for other markers were also observed, including cCD79a (2 patients), CD127 (2 patients), and CD45 (2 patients). In the cases displaying bimodal CD19 expression, higher or lower expression was random in the major cell population as compared to normal lymphocytes in the same sample. There was no tendency towards bimodal expression for one marker that could be specifically correlated with bimodal expression of another specific marker.
Table 3. Number of patients showing bimodal and/or broad marker expression.
| Marker | Patients with bimodal expression | Patients with broad expression |
| CD34 | 20 | 28 |
| CD19 | 11 | 37 |
| CD10 | 17 | 31 |
| cCD79a | 2 | 46 |
| CD179a | 0 | 11 |
| CD127 | 2 | 3 |
| CD45 | 2 | 32 |
| sIgm | 0 | 0 |
Figure 3. Examples of immunophenotypic patterns and heterogeneous antigen expression at the time of diagnosis for adult common ALL.
The contour plots (a) are all gated on leukemia cells (as shown in Figure 1). The histograms (b) are gated on selected fractions of leukemia cells as described below each plot. Immunophenotypic patterns were defined as groups A, B, C, and D, respectively.
Broad expression, as defined above, of one or more markers was observed in all patients. The markers involved were most commonly CD34 (28 patients), CD19 (37 patients), CD10 (31 patients), cCD79a (46 patients), and CD45 (32 patients) (Table 3, Figure 3). These positive markers were of bimodal or broad expression, randomly, and had different fluorescence intensity.
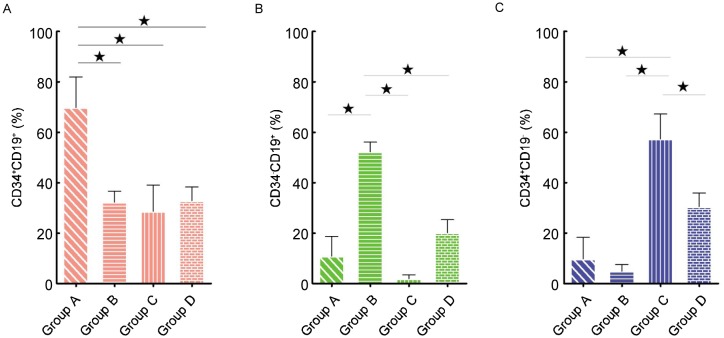
Although the leukemia cell populations were different on a patient-to-patient basis (Table 2), the major leukemic populations were of regular distribution in CD19 vs. CD34 plots. According to the major leukemic population distribution, 48 common ALL patients showed four phenotypic patterns, which were named group A, B, C, and D (Figures 3 and 4). The main leukemic population in group A (31 cases) was CD34+CD19+ [(69.83 ± 12.15)%]; group B (4 cases) was CD34−CD19+ [(52.30 ± 3.82)%]; group C (5 cases) was 0034+0019−[(57.31 ± 9.95)% ]; and group D (8 cases) was CD34+CD19+ [(32.85 ± 5.44)%], CD34−CD19+ [(20.15 ± 5.18)%], and CD34+CD19− [(30.45% ± 5.47)%]. The proportion of CD34+CD19+ cells in group A was significantly different from those in groups B, C, and D (Figure 5A, P < 0.05); in comparison, there were significant differences in the ratios of CD34−CD19+ cells in group B (Figure 5B, P < 0.05). Furthermore, the ratios of CD34+CD19− cells in group C were obviously different from those in groups A, B, and D (Figure 5C, P < 0.05).
Figure 4. The ratio of CD34+ CD19+, CD34−CD19+, and CD34+ CD19− subpopulations to total leukemia cells for the four immunophenotypic patterns.
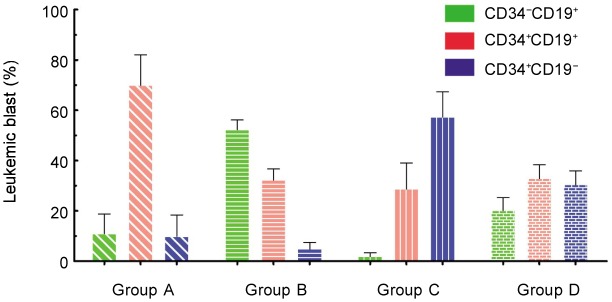
The ratio is defined as the percentage of indicated leukemia cells. The histogram represents the mean, and error bars represent the standard deviation.
Figure 5. The major population of each group was compared with that of the others, and each difference was significant by the Kruskal-Wallis test (* P < 0.05).
A, CD34+CD19+ population; B, CD34−CD19+ population; C, CD34+CD19− population. The histogram represents the mean, and error bars represent the standard deviation.
Clinical and biological characteristics of common ALL
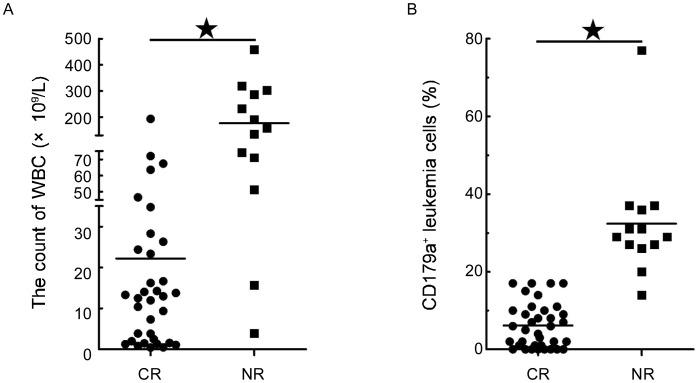
The response to 4-week induction chemotherapy differed among adult common ALL patients, some of whom had no complete remission (CR). Of the 48 patients, 13 were not in CR after 4 weeks of induction chemotherapy: 8 were group A patients with a WBC level of (176.91 ± 137.39) × 109/L, whereas 5 were group D patients with a WBC level of (236.06 ± 64.28) × 109/L. Of these 13 patients, the WBC level was significantly higher than that of the sensitive patients (Figure 6A, P < 0.001). In addition, the CD179a+ population of patient having no CR was also significantly higher than that of the patients who achieved CR (Figure 6B, P < 0.001). However, treatment response did not correlate with age, gender, gene, Hb, or PLT.
Figure 6. Clinical features differ in early treatment response.
There were significant differences in WBC count (A) and CD179a+ populations (B) when complete remission (CR) patients were compared with no complete remission (NR) patients. This difference was significant as determined by the Kruskal-Wallis test (*P < 0.001).
Group A common ALL patients (23/31) whose major leukemic population was CD34+CD19+CD10+CD127−CD179a− were sensitive to induction chemotherapy, independent of Ph+ or high WBC count. For group D patients who were CD127+ and also had WBCs that were more than 100 × 109/L, none (0/5) were in CR after 4 weeks of induction treatment. This group A patient (case 3) was CD127+ and CD179a−, and had a normal WBC count, but this patient had no CR in response to 4 weeks of induction chemotherapy. With bimodal CD34, CD10, and CD127 expression, the major leukemia population of case 3 was CD34+CD19+CD10+CD127+. Case 18 with bimodal CD34 and CD10 expression was also a group A member, and was positive for CD127 and CD179a, and had a WBC count of 15.7 × 10⁹/L. This patient had no CR after induction chemotherapy. Interestingly, case 15 had two distinct leukemia clones with different CD45 expression: the major and minor leukemia populations were CD45− and CD45+, respectively, and this patient attained CR after induction chemotherapy.
Of 19 patients with Ph+ common ALL, 13 achieved CR after induction treatment with imatinib, and their major leukemia cells were CD34+CD10+0019+00127−CD179a−. In the 6 patients who had no CR, WBCs were all more than 50 × 109/L and leukemia cells had asynchronous CD179a expression; only case 15 was positive for CD127. Only 3 of 24 patients with Ph−common ALL were not in CR after induction treatment: case 18 with CD127+ and CD179a+, case 22 with CD179a+ and a WBC of 50 × 109/L, and case 48 in group D with a high WBC count.
Discussion
B-ALL is well known to display significant heterogeneity in cell morphology, gene expression (including cell surface markers), genetic aberrations, and response to therapy[10]. As such, detection of only 3 to 4 antigens could lead to confusion about classifying B-ALL into subgroups[1]. To resolve this problem, we defined the patterns of antigen expression in common ALL patients using seven B-cell developmental antigens (CD34, CD127, CD10, cCD79a, CD19, CD179a, and sIgm). In the present study, normal B lymphocytes always expressed a continuous and complete maturation spectrum as measured by 7-color flow Cytometry using two 6-antibody combinations, without aberrant antigen expression as previous reports[23]. We observed that only one or two subpopulations could be used for diagnosing common ALL according to the 2008 WHO classification by simultaneous examination of the six antigens. The rest of the windows (the other antibody combinations in 2-D plot) provide additional information about leukemia cell populations that were previously ignored in a high percentage of leukemia cells in patients, information that could be used to sub-classify common ALL patients[24]. Our results suggest that the protocol described here permitted diagnosis and sub-classification of B-ALL patients.
The previously reported relationships between immunophenotype and clinical features of common ALL were based upon conventional markers[25]–[27]. However, relationships between WBC count and CD179a or CD127 expression in common ALL were not found. A high WBC count at diagnosis is known to be associated with poor prognosis[8]. In our 48 patients, those having no CR after the 4-week induction chemotherapy had a high WBC count and CD179a expression, suggesting that CD179a expression may affect WBC count in peripheral blood. Moreover, CD179a had asynchronous expression with CD34 and was not co-expressed with cytoplasmic IgM. The mechanisms responsible for these findings require further clarification.
The immunophenotypic patterns seen in common ALL provide important biological information for classifying and designing treatments for this disease[28],[29]. CD10+ is associated with favorable outcomes for pediatric B-ALL patients[30]. However, CD127 contributes to B-cell oncogenesis, and CD127+ common ALL cells have higher expression levels of Ki-67 and Bcl-2 compared to their CD127− counterparts[15],[31]. Our results indicate that CD127+ common ALL patients did not attain CR after induction chemotherapy. In this sense, CD34+ CD10+CD19+CD127−CD179a− common ALL leukemia cells might be cleared by induction chemotherapy.
B-ALL patients with Ph+ required extended therapy to attain initial CR in the pre-imatinib era[32],[33]. According to our data, CD34+CD10+CD19+CD127−CD179a− common ALL Ph+ patients having a WBC count less than 100 × 109/L could soon attain CR. Patients who rapidly attained CR have an improved outcome compared with patients who showed a slow response[34]–[36]. However, we did not monitor the natural evolution of human common ALL after chemotherapy. As our data reveal many immunophenotypic patterns in de novo common ALL patients, the leukemic cell populations that are sensitive or resistant to chemotherapy could be easily monitored during the therapeutic program.
Bimodal expression and broad expression of antigen markers in ALL could reflect two different biological phenomena. The observed broad expression patterns of some markers resemble the maturation spectrum seen for normal pre-B cells. In a study of 41 childhood patients with B-cell precursor ALL, Obro et al.[11] reported that broad expression involved CD34 (8 patients), CD10 (10 patients), CD79a (5 patients), and CD45 (14 patients). In our study, broad expression also commonly involved CD34 (28 patients), CD10 (31 patients), cCD79a (46 patients), and CD45 (32 patients) (Table 3, Figure 3). These results confirm that B-ALL has significant heterogeneity and that there are differences between the immunophenotypes of adult common ALL and childhood B-cell precursor ALL.
Bimodal expression in ALL might reflect the coexistence of genetically distinct subpopulations that are generated early in oncogenesis, possibly due to genomic instability. CD34 was reported to have bimodal expression in subpopulations in childhood B-cell precursor ALL (18/41), with this expression having a random pattern. Bimodal expression of other markers was occasionally observed for CD127 (2 patients), CD45 (2 patients), whereas cCD79a had no bimodal expression. Obro et al.[11] thought these differences might have epigenetic origins, such as changes in DNA methylation and chromatin remodeling. In our 48 common ALL patients, the subpopulations included bimodal expression of CD34 (20 patients), with 4 patients showing bimodal expression of CD34, CD10, and CD19. Bimodal expression of other markers, cCD79a (2 patients) and CD45 (2 patients), was also observed. In the cases with bimodal CD19 expression, whether the major population had high or low expression was random. These populations must have evolved from a common clonal origin. Although the origin of B-ALL is unclear, populations from CLP to pro-B are able to reconstitute the complete B-ALL immunophenotype[1],[37]. B-ALL blasts at different stages of maturation display stem cell potential and possess malleability[38],[39]. Therefore, to define the role of leukemic stem cells in ALL, there must first be an understanding of how the cellular context of tumors affects cancer-specific genetic and epigenetic pathways[40], which should drive new therapeutic advances.
In conclusion, the immunophenotypic profiles determined by flow Cytometry using developmental antigens yield a better understanding of the complex biologic features of common ALL and improve the ability to further classify the disease and detect minimal residual disease, which together better characterize individualized leukemia cell populations. Moreover, this strategy can provide clues for developing individualized therapies for common ALL patients. Nevertheless, to better understand the immunophenotypic profiles of common ALL and their correlation with prognosis, further research is needed to investigate more cases and to identify their molecular mechanisms.
Acknowledgments
We thank the participants for their kind cooperation, generosity, and patience. This work was supported by grants from the National Basic Research Program of China (No. 2007CB947802), the Natural Science Foundation of China to H.X. (No. 30771228) and to X.M. (No. 30771227).
References
- 1.Cobaleda C, Sanchez-Garcia I. B-cell acute lymphoblastic leukaemia: towards understanding its cellular origin. Bioessays. 2009;31:600–609. doi: 10.1002/bies.200800234. [DOI] [PubMed] [Google Scholar]
- 2.Bene MC, Bernier M, Castoldi G, et al. et al. Impact of immunophenotyping on management of acute leukemias. Haematologica. 1999;84:1024–1034. [PubMed] [Google Scholar]
- 3.Bassan R, Hoelzer D. Modern therapy of acute lymphoblastic leukemia. J Clin Oncol. 2011;29:532–543. doi: 10.1200/JCO.2010.30.1382. [DOI] [PubMed] [Google Scholar]
- 4.Ling JY, Sun XF, Yan SL, et al. et al. Bone marrow immunophenotypes of 112 cases of lymphoid system malignant diseases. Chin J Cancer. 2007;26:418–422. [in Chinese] [PubMed] [Google Scholar]
- 5.Borowitz MJ, Chan JK. Precursor lymphoid neoplasms. In: Swerdlow SH, Campo E, Harris NL, et al., editors. WHO classification of tumours of haematopoietic and lymphoid tissues. 4th edition. Lyon, France: International Agency for Research on Cancer; 2008. pp. 167–178. [Google Scholar]
- 6.Han X, Bueso-Ramos CE. Advances in the pathological diagnosis and biology of acute lymphoblastic leukemia. Ann Diagn Pathol. 2005;9:239–257. doi: 10.1016/j.anndiagpath.2005.07.001. [DOI] [PubMed] [Google Scholar]
- 7.Primo D, Tabernero MD, Perez JJ, et al. et al. Genetic heterogeneity of BCR/ABL+ adult B-cell precursor acute lymphoblastic leukemia: impact on the clinical, biological and immu-nophenotypical disease characteristics. Leukemia. 2005;19:713–720. doi: 10.1038/sj.leu.2403714. [DOI] [PubMed] [Google Scholar]
- 8.Pui CH, Robison LL, Look AT. Acute lymphoblastic leukaemia. Lancet. 2008;371:1030–1043. doi: 10.1016/S0140-6736(08)60457-2. [DOI] [PubMed] [Google Scholar]
- 9.Sun XF, He LR, Feng HL, et al. et al. The value of multiparameter flow Cytometry in diagnosis of lymphocytic leukemia and bone marrow involvement of non-Hodgkin's lymphoma. Chin J Cancer. 2003;22:1232–1236. [in Chinese] [PubMed] [Google Scholar]
- 10.Marusyk A, Polyak K. Tumor heterogeneity: causes and consequences. Biochim Biophys Acta. 2010;1805:105–117. doi: 10.1016/j.bbcan.2009.11.002. [DOI] [PMC free article] [PubMed] [Google Scholar]
- 11.Obro NF, Marquart HV, Madsen HO, et al. et al. Immunophenotype-defined sub-populations are common at diagnosis in childhood B-cell precursor acute lymphoblastic leukemia. Leukemia. 2011;25:1652–1657. doi: 10.1038/leu.2011.136. [DOI] [PubMed] [Google Scholar]
- 12.Blom B, Spits H. Development of human lymphoid cells. Annu Rev Immunol. 2006;24:287–320. doi: 10.1146/annurev.immunol.24.021605.090612. [DOI] [PubMed] [Google Scholar]
- 13.Ryan DH, Nuccie BL, Ritterman I, et al. et al. Expression of interleukin-7 receptor by lineage-negative human bone marrow progenitors with enhanced lymphoid proliferative potential and B-lineage differentiation capacity. Blood. 1997;89:929–940. [PubMed] [Google Scholar]
- 14.Parrish YK, Baez I, Milford TA, et al. et al. IL-7 dependence in human B lymphopoiesis increases during progression of ontogeny from cord blood to bone marrow. J Immunol. 2009;182:4255–4266. doi: 10.4049/jimmunol.0800489. [DOI] [PMC free article] [PubMed] [Google Scholar]
- 15.Sasson SC, Smith S, Seddiki N, et al. et al. IL-7 receptor is expressed on adult pre–B-cell acute lymphoblastic leukemia and other B-cell derived neoplasms and correlates with expression of proliferation and survival markers. Cytokine. 2010;50:58–68. doi: 10.1016/j.cyto.2009.12.001. [DOI] [PubMed] [Google Scholar]
- 16.Nishimoto N, Kubagawa H, Ohno T, et al. et al. Normal pre-B cells express a receptor complex of mu heavy chains and surrogate light-chain proteins. Proc Natl Acad Sci USA. 1991;88:6284–6288. doi: 10.1073/pnas.88.14.6284. [DOI] [PMC free article] [PubMed] [Google Scholar]
- 17.Morstadt L, Bohm A, Yuksel D, et al. et al. Engineering and characterization of a single chain surrogate light chain variable domain. Protein Sci. 2008;17:458–465. doi: 10.1110/ps.073269808. [DOI] [PMC free article] [PubMed] [Google Scholar]
- 18.Mårtensson I-L, Almqvist N, Grimsholm O, et al. et al. The pre-B cell receptor checkpoint. FEBS Lett. 2010;584:2572–2579. doi: 10.1016/j.febslet.2010.04.057. [DOI] [PubMed] [Google Scholar]
- 19.Monroe JG, Dorshkind K. Fate decisions regulating bone marrow and peripheral B lymphocyte development. Adv Immunol. 2007;95:1–50. doi: 10.1016/S0065-2776(07)95001-4. [DOI] [PubMed] [Google Scholar]
- 20.Digiuseppe JA. Acute lymphoblastic leukemia: diagnosis and detection of minimal residual disease following therapy. Clin Lab Med. 2007;27:533–549, vi. doi: 10.1016/j.cll.2007.05.005. [DOI] [PubMed] [Google Scholar]
- 21.Ratei R, Karawajew L, Lacombe F, et al. et al. Normal lymphocytes from leukemic samples as an internal quality control for fluorescence intensity in immunophenotyping of acute leukemias. Cytometry B Clin Cytom. 2006;70:1–9. doi: 10.1002/cyto.b.20075. [DOI] [PubMed] [Google Scholar]
- 22.Tung JW, Heydari K, Tirouvanziam R, et al. et al. Modern flow Cytometry: a practical approach. Clin Lab Med. 2007;27:453–468, v. doi: 10.1016/j.cll.2007.05.001. [DOI] [PMC free article] [PubMed] [Google Scholar]
- 23.McKenna RW, Washington LT, Aquino DB, et al. et al. Immuno-phenotypic analysis of hematogones (B-lymphocyte precursors) in 662 consecutive bone marrow specimens by 4-color flow Cytometry. Blood. 2001;98:2498–2507. doi: 10.1182/blood.v98.8.2498. [DOI] [PubMed] [Google Scholar]
- 24.Peters JM, Ansari MQ. Multiparameter flow Cytometry in the diagnosis and management of acute leukemia. Arch Pathol Lab Med. 2011;135:44–54. doi: 10.5858/2010-0387-RAR.1. [DOI] [PubMed] [Google Scholar]
- 25.Ludwig WD, Seibt-Jung H, Teichmann JV, et al. et al. Clinicopathological features and prognostic implications of immunopheno-typic subgroups in childhood ALL: experience of the BFM-ALL Study 83. Haematol Blood Transfus. 1989;32:51–57. doi: 10.1007/978-3-642-74621-5_7. [DOI] [PubMed] [Google Scholar]
- 26.Hoelzer D, Thiel E, Loffler H, et al. et al. Prognostic factors in a multicenter study for treatment of acute lymphoblastic leukemia in adults. Blood. 1988;71:123–131. [PubMed] [Google Scholar]
- 27.Borowitz MJ, Shuster J, Carroll AJ, et al. et al. Prognostic significance of fluorescence intensity of surface marker expression in childhood B-precursor acute lymphoblastic leukemia. A pediatric oncology group study. Blood. 1997;89:3960–3966. [PubMed] [Google Scholar]
- 28.Uckun FM, Sather H, Gaynon P, et al. et al. Prognostic significance of the CD10+CD19+CD34+ B-progenitor immunophenotype in children with acute lymphoblastic leukemia: a report from the Children's Cancer Group. Leuk Lymphoma. 1997;27:445–457. doi: 10.3109/10428199709058311. [DOI] [PubMed] [Google Scholar]
- 29.Schabath R, Ratei R, Ludwig WD. The prognostic significance of antigen expression in leukaemia. Best Pract Res Clin Haematol. 2003;16:613–628. doi: 10.1016/s1521-6926(03)00087-2. [DOI] [PubMed] [Google Scholar]
- 30.Cutrona G, Tasso P, Dono M, et al. et al. CD10 is a marker for cycling cells with propensity to apoptosis in childhood ALL. Br J Cancer. 2002;86:1776–1785. doi: 10.1038/sj.bjc.6600329. [DOI] [PMC free article] [PubMed] [Google Scholar]
- 31.Qazi S, Uckun FM. Gene expression profiles of infant acute lymphoblastic leukaemia and its prognostically distinct subsets. Br J Haematol. 2010;149:865–873. doi: 10.1111/j.1365-2141.2010.08177.x. [DOI] [PubMed] [Google Scholar]
- 32.Ravandi F, Kebriaei P. Philadelphia chromosome-positive acute lymphoblastic leukemia. Hematol Oncol Clin North Am. 2009;23:1043–1063, vi. doi: 10.1016/j.hoc.2009.07.007. [DOI] [PMC free article] [PubMed] [Google Scholar]
- 33.Meng FY, Zheng WY, Liu XL, et al. et al. Glivec in combination with HA regimen for treatment of 20 patients with Ph chromosome positive acute leukemia. Chin J Cancer. 2003;22:840–843. [in Chinese] [PubMed] [Google Scholar]
- 34.Schrappe M, Arico M, Harbott J, et al. et al. Philadelphia chromosome-positive (Ph+) childhood acute lymphoblastic leukemia: good initial steroid response allows early prediction of a favorable treatment outcome. Blood. 1998;92:2730–2741. [PubMed] [Google Scholar]
- 35.Roy A, Bradburn M, Moorman AV, et al. et al. Early response to induction is predictive of survival in childhood Philadelphia chromosome positive acute lymphoblastic leukaemia: results of the Medical Research Council ALL 97 trial. Br J Haematol. 2005;129:35–44. doi: 10.1111/j.1365-2141.2005.05425.x. [DOI] [PubMed] [Google Scholar]
- 36.Hoelzer D. Therapy and prognostic factors in adult acute lymphoblastic leukaemia. Baillieres Clin Haematol. 1994;7:299–320. doi: 10.1016/s0950-3536(05)80204-5. [DOI] [PubMed] [Google Scholar]
- 37.Vormoor HJ. Malignant stem cells in childhood acute lymphoblastic leukemia: the stem cell concept revisited. Cell Cycle. 2009;8:996–999. doi: 10.4161/cc.8.7.7984. [DOI] [PubMed] [Google Scholar]
- 38.Kong Y, Yoshida S, Saito Y, et al. et al. CD34+CD38+CD19+ as well as CD34+CD38−CD19+ cells are leukemia-initiating cells with self-renewal capacity in human B-precursor ALL. Leukemia. 2008;22:1207–1213. doi: 10.1038/leu.2008.83. [DOI] [PubMed] [Google Scholar]
- 39.le Viseur C, Hotfilder M, Bomken S, et al. et al. In childhood acute lymphoblastic leukemia, blasts at different stages of immunophenotypic maturation have stem cell properties. Cancer Cell. 2008;14:47–58. doi: 10.1016/j.ccr.2008.05.015. [DOI] [PMC free article] [PubMed] [Google Scholar]
- 40.Chen H, Huang Q, Dong J, et al. et al. Cancer initiating cell theory: popularity and controversies. Chin J Cancer. 2006;25:779–784. [in Chinese] [PubMed] [Google Scholar]


