



Abstract
Animal olfactory systems have a critical role for the survival and reproduction of individuals. In insects, the odorant-binding proteins (OBPs) are encoded by a moderately sized gene family, and mediate the first steps of the olfactory processing. Most OBPs are organized in clusters of a few paralogs, which are conserved over time. Currently, the biological mechanism explaining the close physical proximity among OBPs is not yet established. Here, we conducted a comprehensive study aiming to gain insights into the mechanisms underlying the OBP genomic organization. We found that the OBP clusters are embedded within large conserved arrangements. These organizations also include other non-OBP genes, which often encode proteins integral to plasma membrane. Moreover, the conservation degree of such large clusters is related to the following: 1) the promoter architecture of the confined genes, 2) a characteristic transcriptional environment, and 3) the chromatin conformation of the chromosomal region. Our results suggest that chromatin domains may restrict the location of OBP genes to regions having the appropriate transcriptional environment, leading to the OBP cluster structure. However, the appropriate transcriptional environment for OBP and the other neighbor genes is not dominated by reduced levels of expression noise. Indeed, the stochastic fluctuations in the OBP transcript abundance may have a critical role in the combinatorial nature of the olfactory coding process.
Keywords: chemosensory system, olfactory reception, gene cluster constraint, expression noise, chromatin domain
Introduction
Animal olfactory systems allow for the detection of food, predators, and mates, and thus demonstrating a critical role for the survival and reproduction of individuals (Krieger and Ross 2002; Matsuo et al. 2007). In Drosophila, the early steps of odor processing occur in chemosensory hairs (i.e., the sensilla), which are located in the third antennal segment and the maxillary palp. The main biochemical events include the uptake of volatile molecules through the cuticle pores, transport across the sensilla lymph, and interaction with olfactory receptors. The latter steps are mediated by the odorant-binding proteins (OBPs), which may have an active role in olfactory coding such as contributing to odor discrimination (Swarup et al. 2011) and receptor activation (Laughlin et al. 2008; Biessmann et al. 2010). OBPs are small (10–30 kDa; 130–220 aa long), highly abundant, globular, and water-soluble proteins (Kruse et al. 2003; Tegoni et al. 2004). These molecules are encoded by a moderately sized multigene family (in the 12 Drosophila species, the number of OBP members range from 41 to 62), with an evolution that is consistent with the birth-and-death model (Vieira et al. 2007).
In arthropods, most OBP genes are organized in clusters of a few paralogs (Hekmat-Scafe et al. 2002; Foret and Maleszka 2006), an arrangement that is moreover conserved over time (Vieira and Rozas 2011). Nevertheless, it is not well established whether the conservation of these OBP clusters represent the outcome of an uneven distribution of chromosomal rearrangement breakpoints, or rather they are constrained by natural selection for some functional meaning (Zhou et al. 2009; Sanchez-Gracia and Rozas 2011; Vieira and Rozas 2011). For example, functionally linked genes, such as those encoding subunits of the same complex (Chamaon et al. 2002), proteins of the same pathway (Lee and Sonnhammer 2003), or genes with expression patterns restricted to the head, embryo, or testes (Boutanaev et al. 2002) are often clustered in the Drosophila melanogaster genome. As clusters of functionally linked genes may include nonhomologous members, the OBP gene organization may be preserved by functional constraints imposed from neighboring genes.
The presence of shared cis-regulatory elements, such as bidirectional promoters or pleiotropic enhancers, may explain the OBP gene organization (Li et al. 2006; Yang and Yu 2009). For example, central regions of some Drosophila syntenic clusters are enriched for highly conserved noncoding elements that regulate the transcription of genes with the appropriate composition of core promoter elements (CPEs) (Engstrom et al. 2007). Notably, the CPE composition and expression pattern are two features characterizing the broad and peaked promoter architectures (a classification based on the distribution of transcription start sites) (Hoskins et al. 2011). Although genes with peaked promoters are often expressed in specific tissues or developmental stages, those with broad promoters usually have constitutive transcription (Kharchenko et al. 2011; Rach et al. 2011). Therefore, shared cis-regulatory elements may differentially restrict the movement of genes with particular promoter architectures or transcriptional patterns.
Chromatin conformation (Filion et al. 2010; Kharchenko et al. 2011) could also affect gene organization given its role in the regulation of gene expression (i.e., the so-called position effect). For example, human unfolded chromatin (30-nm chromatin fibers) encompasses high-density gene regions (Gilbert et al. 2004), which usually exhibit elevated expression breadth (EB) (Caron et al. 2001; Lercher et al. 2002). Interestingly, transcriptional activation after chromatin unfolding induces stochastic fluctuations in transcript abundance (i.e., expression noise [EN]) (Becskei et al. 2005). Such EN is often deleterious, particularly for broadly expressed genes, because it yields imbalances in the stoichiometry of proteins (Fraser et al. 2004). These features led Batada and Hurst (2007) to hypothesize that broadly expressed genes are clustered in regions of constitutively unfolded chromatin to minimize EN. Several lines of thought support this model. For example, as head-to-head gene pairs share their promoter regions, a chromatin unfolding event can facilitate the transcriptional activation of both genes. Therefore, chromatin unfolding events will be less frequent in head-to-head than other gene pair arrangements, leading to reduced levels of EN (Wang et al. 2010). Because EN is often deleterious, natural selection may favor the maintenance of the head-to-head gene pair organization in clusters.
Chromosomal proteins determining the chromatin state, such as nuclear membrane (Capelson et al. 2010; Vaquerizas et al. 2010), insulators (Maeda and Karch 2007; Wallace et al. 2009; Negre et al. 2010), and chromatin remodeling (Kalmykova et al. 2005; Li and Reinberg 2011) proteins, may therefore play a relevant role in maintaining gene clusters. In this regard, the function of the JIL-1 protein kinase deserves special attention for its role in defining the decondensed interbands of polytene chromosomes, which characterize active and unfolded chromatin (Jin et al. 1999; Regnard et al. 2011; Kellner et al. 2012). Moreover, JIL-1 kinase, which phosphorylates Serine 10 and 28 at Histone 3, physically interacts with the lamin Dm0 (a structural nuclear membrane protein) (Bao et al. 2005) and Chromator (localized in the spindle matrix of the nucleosketeleton) (Gan et al. 2011) proteins. Recently, the lamin Dm0 protein has been shown to colocalize with conserved microsynteny in Drosophila (Ranz et al. 2011), whereas Chromator changes the chromatin folding state (Rath et al. 2006). Therefore, high-order regulatory mechanisms involving chromatin conformation may underlie the conservation of some gene clusters.
Here, we analyzed the mechanisms underlying the OBP genomic organization. We found that the OBP clusters are embedded within large arrangements, which also include other non-OBP genes. The conservation degree of such large arrangements is moreover related to a number of functional and expression features, such as a transcriptional environment not dominated by reduced levels of EN. Indeed, the stochastic fluctuations in the OBP transcript abundance may have a critical role in the combinatorial nature of the olfactory coding process.
Materials and Methods
DNA Sequence Data and Assignment of Orthologous Groups
We downloaded the D. melanogaster gene and protein sequences and their orthologous relationships (release fb_2011_04) with the additional 11 Drosophila species (Drosophila 12 Genomes 2007) from FlyBase (release 5.40). The orthology data set contains predicted and curated pairwise relationships between the Drosophila species (i.e., one-to-one, one-to-many, and many-to-many relationships). We clustered these ortholog pairs into groups with multiple species using the Markov Clustering Algorithm software with default parameters (inflation = 2 and scheme = 7).
Gene Clustering
We define a conserved cluster as a group of neighbor genes maintained over time; this definition allowed us to study clusters of linked genes, regardless whether they are homologous. To infer such conserved gene clusters, we used the MCMuSeC software (Ling et al. 2009), which permits that clusters can undergo internal rearrangement events (Luc et al. 2003), as well as tandem gene duplications (recent duplicates originated from members of the same cluster). For each inferred cluster, we measured the conservation level as the branch length score (BLS), that is, the total divergence time (Tamura et al. 2004) since the cluster origin. The larger the BLS value, the more ancient the gene cluster.
We evaluated the significance of each BLS value separately for each cluster size (n). Indeed, small-sized clusters (with a low number of genes) have a lower probability to be disrupted by chromosomal rearrangements than larger ones. For each cluster size, we generated an empirical null distribution of the expected BLS value by randomly sampling 10,000 groups of n contiguous D. melanogaster genes, and the BLS values were computed across the information of the 12 Drosophila species. We defined the probability of an observed BLS value (pBLS) as the fraction of sampled clusters with a BLS value lower than or equal to the observed (supplementary table S1, Supplementary Material online).
We also used computer simulations to examine whether the chromatin and expression factors that correlate with the pBLS value (e.g., JIL-1 binding intensity or EN) are specific constraints of the OBP gene organization, or correspond to genome-wide characteristics. We generated null empirical distributions by randomly sampling 10,000 replicates of 31 D. melanogaster clusters without OBP genes, but with the same number of genes and similar pBLS (±0.01) as that observed for clusters including OBP genes. For each replicate, we calculated the correlation between the characteristic chromatin and expression factors and the pBLS value. The probability of an observed correlation (P value) was estimated as the proportion of samples with correlation values higher than the observed. A low probability (i.e., P < 0.05) value indicates that the surveyed factor is not as common among the genome-wide Drosophila gene clusters as it is in the clusters including OBP genes.
Expression Data
We obtained gene expression data for all of the D. melanogaster genes from FlyAtlas (Chintapalli et al. 2007). We used the whole fly expression intensity (EI) information, and all of the 26 conditions incorporated in FlyAtlas, including larval and adult tissues. We considered that a gene is transcribed if the present call value was greater than zero. In addition to the EI value, we also computed the EB as the fraction of tissues where the gene is transcribed (regardless of the expression level in a given tissue), the sex-specific expression (SSE) as the transcription in sexual tissues (i.e., testis, ovary, male accessory glands, virgin spermateca, and mated spermateca) relative to the rest of tissues, and the EN as the coefficient of variation (COV) of the EI values. As the FlyAtlas expression data were determined from highly inbred flies (the Canton-S stock) reared at homogeneous conditions (22 °C with a 12 h:12 h light regime), the COV values are not explained by differences in the genetic or environmental background, but rather represent an excellent proxy to evaluate the stochastic fluctuations in transcript abundance (EN). The mean expression measures for each cluster were calculated as the average expression values of the spanned genes.
Functional Genomic Data
The ChIP-chip binding intensity for the JIL-1 protein and the nine chromatin states defined in Kharchenko et al. (2011) were downloaded from the modENCODE project database (BG3 D. melanogaster cell line). The nine-state chromatin model classifies each D. melanogaster nucleotide position into one out of nine chromatin states (i.e., Promoter and TSS, Transcription elongation [TE], Regulatory regions, Open chromatin, Active genes on the male X chromosome, Polycomb-mediated repression, Pericentromeric heterochromatin, Heterochromatin-like embedded in euchromatin, and Transcriptionally silent, intergenic) on the basis of the combinatorial profile of 18 histone marks (Kharchenko et al. 2011). The promoter architecture information, which integrates cap analysis of gene expression (CAGE), RNA ligase mediated rapid amplification of cDNA ends (RLM-RACE) and cap-trapped expressed sequence tags data, was obtained from Hoskins et al. (2011). We performed the promoter analysis using all promoter annotations, but also confirmed the results by restricting the analysis to promoters with only validated support (evidence from two or more data types; e.g., CAGE and RLM-RACE).
We used the FlyBase Gene Ontology (GO) annotation (release fb_2011_04) to gauge whether genes clustered with OBP genes are functionally related. We analyzed the GO overrepresentation using the Topology-Elim algorithm (Grossmann et al. 2007), which considers the hierarchical dependencies of the GO terms, and was implemented in the Ontologizer 2.0 software (Bauer et al. 2008).
Phylogeny-Based Analysis
The age of the genes (the divergence time since its origin) is a relevant factor to be considered when analyzing the mechanisms involved in gene cluster conservation. For example, recent gene duplications usually evolve faster than older ones (Luz et al. 2006) and often exhibit an SSE pattern. Moreover, the maximum BLS value of a particular cluster depends on the age of the encompassed genes. We inferred the maximum BLS cluster value as the minimum age of the encompassed genes, using the topological dating approach (Huerta-Cepas and Gabaldon 2011) with the BadiRate software (Librado et al. 2012).
Statistical Multivariate Analysis
We examined the relationships among the pBLS and a number of genomic and gene expression factors by different association tests (supplementary table S2, Supplementary Material online). On the one hand, we analyzed bivariate associations by using the following: 1) the Wilcoxon exact test, 2) the Pearson correlation coefficient, 3) the Spearman’s rank correlation coefficient, and 4) the maximal information coefficient (MIC) (Reshef et al. 2011). We used the Wilcoxon exact test to compare clusters with low (<0.90) and high (>0.99) pBLS values. As this test requires a categorization of a continuous variable (the pBLS value), it is often conservative. For this reason, we also computed the Pearson correlation coefficient, which captures the linear continuous dependence between variables. Nevertheless, the Pearson correlation coefficient is very sensitive to outliers and skewed distributions, which may generate spurious associations between variables. Indeed, the assumptions required to calculate the probability associated to the Pearson correlation coefficient may not hold in our data; for instance, the pBLS values are not normally distributed (Kolmogorov–Smirnov test: P < 2.2e−16). In such case, the Spearman’s rank correlation coefficient is recommendable. This test, however, is not without problems, such as the use of the midrank approach for handling ties. The MIC-based test does not assume normality of the data and allows detecting a wide range of bivariate associations, including monotonic (e.g., linear, exponential) and nonmonotonic (e.g., sinusoidal) relationships. However, the P value of the MIC score can only be obtained by simulations. Currently only a few precomputed tables are available, which precludes computing exact P values, especially for our genome-wide data set (sample size of 3,434). Given these pros and cons, we reported the Spearman’s rank correlation coefficient throughout the manuscript. In addition, it is worth noting that all conclusions extracted from the Spearman’s rank correlation coefficient were also supported by other tests, especially the main findings (supplementary table S2, Supplementary Material online). On the other hand, as the examined variables are clearly intercorrelated, we also conducted a partial correlation and a path analysis. We assessed the goodness of fit of our empirical data to the underlying path model by evaluating the chi-squared significance.
The Wilcoxon exact test, the Pearson, and the Spearman’s correlation coefficients, as well as the partial correlation and the path analysis were performed using the R programming language (version 2.7.2). The MIC score was computed using the Java binary provided by the authors, and its P values were determined using the precomputed tables available at the MINE web site. We conducted the multiple testing correction using the Benjamini–Hochberg procedure (Benjamini and Hochberg 1995) at a 5% of false discovery rate (FDR), which was implemented in the multtest package of the R programming language. We also used in-house developed Perl scripts for handling all genomic and expression data files.
Results
Gene Cluster Identification
We inferred a total of 31 conserved clusters that include both OBP and other nonhomologous genes (see Materials and Methods; table 1). These 31 clusters are maintained, on average, in 5.9 Drosophila species, comprise a mean of 8.3 genes and, more importantly, recover most of the OBP clusters defined in Vieira et al. (2007). For example, the cluster with highest gene density comprises four OBP genes (Obp19a, Obp19b, Obp19c, and Obp19d; cluster 1 in Vieira et al. [2007]) and one non-OBP gene in 7,330 bp. This cluster has been detected in 11 species, having a pBLS (cluster constraint probability) value of 0.995, and an adjusted pBLS (after correcting for the FDR [Benjamini and Hochberg 1995]) of 0.977 (table 1). In total, 14 of these clusters are significant (pBLS > 0.95), although only 10 remain after correcting for multiple testing (adjusted pBLS > 0.95). Therefore, these clusters are likely to be under functional constraints.
Table 1.
The Drosophila melanogaster Clusters Including OBP Genes
| D. melanogaster Gene Cluster Region | No. of Genes | No. of OBPs | No. of Genomes Conserved | pBLS | Adjusted pBLS | |
|---|---|---|---|---|---|---|
| Obp8a | X:9100153 … 9111401 | 4 | 1 | 8 | 0.925719 | 0.872071 |
| Obp18a | X:19029114 … 19064675 | 3 | 1 | 2 | 0.733075 | 0.714666 |
| Obp19a-d | X:20284679 … 20292009 | 5 | 4 | 11 | 0.995459 | 0.976539* |
| Obp22a | 2L:1991705 … 2008966 | 4 | 1 | 4 | 0.734812 | 0.714666 |
| Obp28a | 2L:7426866 … 7497360 | 10 | 1 | 3 | 0.930950 | 0.874085 |
| Obp44a | 2R:4018938 … 4022588 | 2 | 1 | 12 | 0.921412 | 0.871778 |
| Obp46a | 2R:6194535 … 6209405 | 4 | 1 | 9 | 0.945767 | 0.887918 |
| Obp47a | 2R:6785747 … 6829206 | 4 | 1 | 5 | 0.893760 | 0.843170 |
| Obp47b | 2R:7189426 … 7197334 | 4 | 1 | 12 | 0.992088 | 0.964959* |
| Obp49a | 2R:8574114 … 8645028 | 10 | 1 | 7 | 0.997471 | 0.983415* |
| Obp50a-c | 2R:10257836 … 10260511 | 3 | 3 | 6 | 0.799992 | 0.753622 |
| Obp50d | 2R:10257836 … 10261264 | 4 | 1 | 5 | 0.793360 | 0.753622 |
| Obp50e | 2R:10262077 … 10299077 | 5 | 1 | 5 | 0.834610 | 0.786371 |
| Obp51a | 2R:10911880 … 10943746 | 2 | 1 | 4 | 0.603538 | 0.603538 |
| Obp56a-c | 2R:15585228 … 15588573 | 3 | 3 | 11 | 0.937764 | 0.879417 |
| Obp56d-f | 2R:15573111 … 15602373 | 9 | 3 | 3 | 0.895767 | 0.843170 |
| Obp56g | 2R:15656966 … 15671525 | 2 | 1 | 9 | 0.747767 | 0.714666 |
| Obp56h | 2R:15703059 … 15720473 | 2 | 1 | 10 | 0.840740 | 0.786371 |
| Obp56i | 2R:15703059 … 15768425 | 4 | 1 | 3 | 0.687717 | 0.676687 |
| Obp57a-c | 2R:16391061 … 16426819 | 10 | 3 | 4 | 0.951438 | 0.892469 |
| Obp57d-e | 2R:16413832 … 16449834 | 15 | 2 | 2 | 0.959350 | 0.903065 |
| Obp58b-d; Obp59a | 2R:18554661 … 18595219 | 11 | 4 | 5 | 0.988070 | 0.958908* |
| Obp69a | 3L:12332216 … 12410803 | 7 | 1 | 9 | 0.990356 | 0.962628* |
| Obp73a | 2R:5950890 … 6004962 | 6 | 1 | 9 | 0.986228 | 0.957306* |
| Obp76a | 3L:19561538 … 19683092 | 20 | 1 | 3 | 0.999983 | 0.999483* |
| Obp83a-b | 3R:1786045 … 1852962 | 6 | 2 | 4 | 0.839688 | 0.786371 |
| Obp83cd; Obp83ef; Obp83g | 3R:1880432 … 2129375 | 29 | 3 | 3 | 0.999967 | 0.999483* |
| Obp84a | 3R:3050136 … 3113354 | 12 | 1 | 6 | 0.998575 | 0.985275* |
| Obp93a | 3R:16774436 … 16966087 | 33 | 1 | 2 | 0.997325 | 0.983415* |
| Obp99a | 3R:25456026 … 25501141 | 7 | 4 | 5 | 0.976460 | 0.933660 |
| Obp99b-d | 3R:25444756 … 25548111 | 17 | 3 | 2 | 0.97025 | 0.923146 |
| Average | 8.3 | 1.7 | 5.9 |
Note.—The “no. of genes” and “no. of OBPs” columns indicate the total number of protein coding and OBP genes in the clusters, respectively. The “no. of genomes conserved” column represents the number of Drosophila species where the gene cluster region is identified.
*Significant clusters (adjusted pBLS > 0.95).
To determine specific features of the OBP gene organization, we compared clusters including OBP genes with all clusters identified in the Drosophila genomes. We inferred a total of 3,434 clusters (supplementary table S1, Supplementary Material online) that, on average, are conserved in 5.9 Drosophila species and encompass 6.4 genes (fig. 1). A total of 1,290 of the 3,434 clusters have a pBLS higher than 0.95, although only 58 remain significant after controlling for FDR. Because the FDR correction constitutes a conservative criterion (i.e., FDR methodologies reduce its statistical power as the number of tests increases [Carvajal-Rodriguez et al. 2009]), the actual number of clusters under functional constraint is likely to be higher than these 58 cases. Given that the raw pBLS value, which is not adjusted for multiple testing, is a continuous estimate of the cluster constraint strength, classifying clusters into significant and nonsignificant unbalanced categories will yield a further loss of statistical power (Pearson 1913). To avoid the negative effects of categorization, we analyzed the effect of competing factors on raw pBLS estimates using different association measures (supplementary table S2, Supplementary Material online), although only the values of the Spearman’s rank correlation coefficient are reported throughout the manuscript.
Fig. 1.—

Frequency distribution of the 3,434 Drosophila clusters. Frequency distribution of the 3,434 Drosophila clusters, which is conditioned on the cluster size (i.e., number of genes per cluster) and the BLS value (total time of cluster conservation in million years ago). The 58 significant clusters after correcting for multiple testing are depicted in red.
Genes Clustered with OBP Genes Encode Plasma Membrane Proteins
We studied the existence of functional relationships among the genes clustered with OBPs by GO enrichment analysis (in total, 198 non-OBP genes). We compared the functionally annotated non-OBP genes in the 31 focal clusters (162 out of the 198 genes have GO annotations) with those present in all of the 3,434 Drosophila clusters (9,353 out of 11,811 genes). We found that the most characteristic GO terms among the genes clustered with OBPs are regulation of neurotransmitter transport, sodium channel activity, axon, neurotransmitter receptor activity, and integral to plasma membrane. After multiple testing correction (Benjamini and Hochberg 1995), only the latter category remained significant (hypergeometric test, P = 1.34e−15; table 2). As this analysis does not take into account the pBLS value of the clusters, we also separately reanalyzed the data from three different pBLS bins, each containing a similar number of genes. Notably, we found that the integral to plasma membrane GO term is enriched among the genes most conserving their neighborhood with the OBP genes.
Table 2.
The 15 GO Terms Most Overrepresented among Genes Clustered with OBPs
| GO Term | No. of Population Count | No. of Sample Count | P Value | Adjusted P Value |
|---|---|---|---|---|
| Integral to plasma membrane | 180 | 22 | 6.78e−14 | 1.06e−10* |
| Sodium channel activity | 35 | 4 | 0.0022 | 0.4634 |
| GTPase activator activity | 62 | 5 | 0.0030 | 0.4634 |
| Retinal binding | 6 | 2 | 0.0036 | 0.4634 |
| Phototransduction | 41 | 4 | 0.0040 | 0.4634 |
| Metal ion transport | 130 | 7 | 0.0047 | 0.4634 |
| Monovalent inorganic cation transport | 137 | 7 | 0.0062 | 0.4634 |
| Locomotion | 253 | 10 | 0.0071 | 0.4634 |
| Neurotransmitter receptor activity | 49 | 4 | 0.0075 | 0.4634 |
| Locomotory behavior | 144 | 7 | 0.0081 | 0.4634 |
| Axon | 52 | 4 | 0.0093 | 0.4634 |
| Regulation of neurotransmitter secretion | 10 | 2 | 0.0104 | 0.4634 |
| Regulation of neurotransmitter transport | 10 | 2 | 0.0104 | 0.4634 |
| Sodium ion transport | 56 | 4 | 0.0120 | 0.4634 |
| Calcium-dependent phospholipid binding | 11 | 2 | 0.0126 | 0.4634 |
Note.—The “Population Count” and “Sample Count” columns indicate the number of genes with GO annotation in the population (9,353 genes in the 3,434 Drosophila clusters) and sample (162 in genes clustered with OBPs), respectively. The “P value” column indicates the probability of observing such number of genes in the sample, given the number of genes in the population. *Overrepresented GO terms (adjusted P < 0.05).
The Cluster Conservation Correlates with the Type of Cis-Regulatory Elements
We analyzed the relevance of cis-regulatory elements in maintaining clusters including OBP genes. In particular, we examined whether the pBLS value of such clusters is associated with the promoter architecture of the confined genes (i.e., the peaked or broad promoters as a proxy for the type of CPEs [Hoskins et al. 2011]). We found a significant correlation (Spearman’s rank correlation coefficient: ρ = 0.415, P = 0.044; table 3), that is, the higher the pBLS value, the higher the proportion of broad-type promoters. Remarkably, this trend is also observed for all of the 3,434 Drosophila clusters (Spearman’s rank correlation coefficient: ρ = 0.044, P = 0.016), indicating that gene clusters may have distinctive cis-regulatory elements.
Table 3.
Summary of the Associations between pBLS and EB, EI, and EN
| OBP Clusters |
Clusters with OBPs |
All Clusters | |||
|---|---|---|---|---|---|
| BC | PC | BC | PA | PA | |
| EB | ρ = 0.099 (P = 0.596) | t = 1.770 (P = 0.089) | ρ = 0.548 (P = 0.001) | β = 0.423 (P = 0.004) | β = 0.114 (P = 2.3e−9) |
| EI | ρ = −0.197 (P = 0.288) | t = −2.831 (P = 0.009) | ρ = 0.087 (P = 0.641) | β = −0.032 (P = 0.821) | β = 0.201 (P < 2e−16) |
| EN | ρ = 0.138 (P = 0.458) | t = 2.382 (P = 0.025) | ρ = 0.403 (P = 0.024) | β = 0.290 (P = 0.043) | β = 0.011 (P = 0.489) |
Note.—Relationship between pBLS and the EB, EI, and EN. The “OBP clusters,” “Clusters with OBPs” and “All clusters” columns show results for clusters of OBP genes, for clusters including OBP genes, and for all 3,434 Drosophila clusters, respectively. “BC,” “PC,” and “PA” stand for bivariate correlation, partial correlation, and path analysis, respectively.
The presence of the cis-regulatory elements shared among genes can restrict the movement of the target genes. For example, genes transcribed from shared promoters are common in many species, resulting in an excess of head-to-head gene pair arrangements (Trinklein et al. 2004; Kensche et al. 2008; Xu et al. 2009). We analyzed whether clusters including OBP genes have distinctive head-to-head, tail-to-tail, or head-to-tail gene pair organizations, but we detected no significant correlation with their pBLS value (Spearman’s rank correlation coefficient, P > 0.05; supplementary fig. S1A–C, Supplementary Material online). In contrast, the results of the genome-wide analysis (including all 3,434 Drosophila clusters) were all significant (Spearman’s rank correlation coefficient: ρ = −0.095, P = 4.85e−8; ρ = 0.214, P < 2e−16; ρ = 0.110, P < 2.92e−10 for the head-to-tail, tail-to-tail and head-to-head gene pair arrangements, respectively). Therefore, the sharing of cis-regulatory elements between contiguous genes is not a major factor in explaining the maintenance of OBP gene organization.
EB and EN Are Associated with the Conservation of Clusters That Include OBP Genes
As genes with broad-type promoters are often broadly expressed (Hoskins et al. 2011), we examined expression pattern effects on cluster conservation. We found that the pBLS value of the clusters including OBP genes significantly correlates with EB (Spearman’s rank correlation coefficient: ρ = 0.548, P = 0.001) and EN (Spearman’s rank correlation coefficient: ρ = 0.403, P = 0.024), but not with EI (Spearman’s rank correlation coefficient: ρ = 0.087, P = 0.641) (table 3). Nevertheless, these variables are highly intercorrelated: broadly expressed genes often exhibit high EI (Newman et al. 2006) and low EN (Lehner 2008). In addition, other factors, such as gene age (GA), may also hinder the causes of cluster conservation. For example, newly arising genes exhibit low EI and high gene loss rates (Wolf et al. 2009).
We determined the causal relationships among the factors involved in the OBP gene organization using path analysis (fig. 2), and assigning GA as the exogenous variable (i.e., not affected by factors of the underlying model). After factoring out the intercorrelated variables, EB (β = 0.423, P = 0.004) and EN (β = 0.290, P = 0.043) remained significant, that is, clusters including OBP genes are expressed in many tissues, exhibiting high stochastic fluctuations in transcript abundance, regardless of their EI (β = −0.032, P = 0.821). Interestingly, this result differs from the genome-wide analyses (3,434 clusters), where the pBLS value is affected by the EI (β = 0.201, P < 2e−16) and EB (β = 0.114, P = 2e−9), but not by the EN (β = 0.011, P = 0.489). However, the transcriptional effects on both data sets (including or not OBP genes) are not directly comparable, because they contain a different number and type of clusters. To evaluate whether EI and EN are specific features of the OBP gene organization, we thus performed computer simulations. We found that the EN effect (path coefficient from EN to pBLS) is higher for clusters including OBP genes than for random samples of 31 comparable clusters (P = 0.035), whereas the EI effect is lower (P = 0.034). Unlike comparable genome-wide clusters, clusters with OBP genes are not only influenced by EB but also by the EN, which does not support the clustering model of EN minimization.
Fig. 2.—
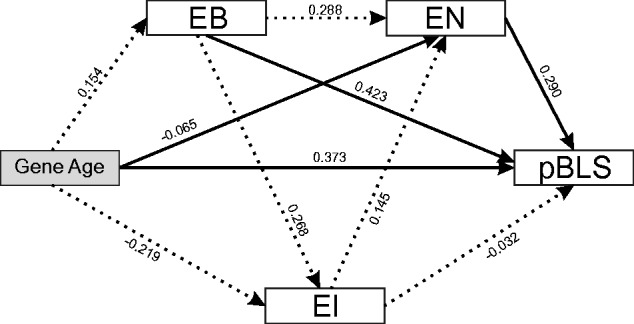
Transcriptional environment in clusters that include OBP genes. Path analysis model for the causal relationships among cluster constraint probability (pBLS), the minimum age of a gene in the cluster (GA), the EB, the EI, and the EN. The GA is the exogenous variable. The numbers on the lines indicate the path coefficients. Solid and dashed arrows represent significant and nonsignificant relationships.
OBP Genes in Conserved Clusters Also Exhibit Elevated Levels of EN
We analyzed whether the positive relationship between EN and cluster conservation remains significant after excluding non-OBP genes from the 31 conserved clusters. For that, we controlled for intercorrelated expression features. For example, we found that OBP genes in clusters with low pBLS, such as the Obp22a and Obp50a genes, are often transcribed in sexual tissues, which may suggest that the OBP gene organization has an SSE component (Spearman’s rank correlation coefficient: ρ = −0.420, P = 0.017; fig. 3A). However, we found that this association is just a by-product of the OBP GA (partial correlation analysis, t = −1.262, P = 0.219; fig. 3B), supporting the observation that newly arising genes often exhibit an SSE pattern (Yeh et al. 2012). Actually, only the EI and EN of the OBP genes are directly associated with cluster conservation (partial correlation analysis, t = −2.831 and t = 2.382, P = 0.009 and P = 0.025, respectively). Overall, it supports the idea that EN may play a major role in shaping the OBP gene organization.
Fig. 3.—
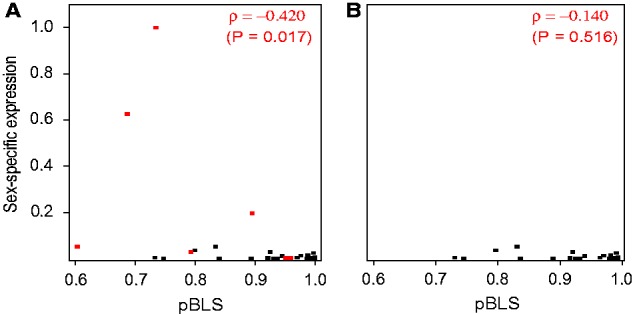
Genomic features of OBP genes. Relationship between pBLS and the SSE value using (A) all OBP genes and (B) after removing the recent OBP duplicates (red points).
Clusters Including OBP Genes Exhibit Distinctive Transcriptional Regulation by High-Order Chromatin Structures
We studied the effect of high-order chromatin structures (i.e., the nine specific chromatin states defined in Kharchenko et al. [2011]) on the conservation of clusters including OBP genes. We found a significant positive relationship between the pBLS value of these clusters and the proportion of nucleotides in the TE chromatin state (Spearman’s rank correlation coefficient: ρ = 0.480, P = 0.006; fig. 4A). This chromatin state exhibits a distinct composition of proteins and histone marks (Kharchenko et al. 2011). As JIL-1 kinase is preferentially localized at the coding (Regnard et al. 2011) and promoter (Kellner et al. 2012) regions of the regulated genes, we analyzed its binding intensity separately for the coding, untranslated region, intergenic and intronic regions of the 31 focal clusters. We observed a strong positive correlation between the pBLS value and the JIL-1 binding intensity, though, after correcting by multiple testing, only remains statistically significant for the coding regions (Spearman’s rank correlation coefficient: ρ = 0.617; P = 2e−4; fig. 4B). Taken together, these results suggest that the transcriptional regulation by high-order chromatin structures maintains the OBP gene organization to chromatin domains with the appropriate transcriptional environment (supplementary fig. S2, Supplementary Material online).
Fig. 4.—

Chromatin features of the clusters that include OBP genes. Relationships between the cluster constraint probability (pBLS) and (A) the proportion of nucleotides annotated as TE and (B) JIL-1 binding intensity in coding regions. The ρ values are the correlation coefficients of these associations. Distribution of the correlation coefficients between pBLS values and (C) the proportion of TE and (D) JIL-1 binding intensities in Drosophila clusters obtained by computer simulations (10,000 replicates of 31 clusters). The arrow indicates the correlation coefficients observed for clusters including OBP genes (P < 1e−5 and P = 0.010, for the TE proportion and JIL-1 binding intensity, respectively). The shaded area in the right tail represents the 5% of the total distribution area.
We further examined whether the high JIL-1 binding intensity and TE chromatin state represent particular features of clusters including OBP genes. Remarkably, the genome-wide cluster data set also shows significant correlation between the pBLS values and the JIL-1 binding intensities (Spearman’s rank correlation coefficient: ρ = 0.305; P < 2e−16) and TE chromatin state (Spearman’s rank correlation coefficient: ρ = 0.312; P < 2e−16). However, our computer simulations show that the correlation strengths are much higher for clusters including OBP than for random groups of 31 comparable clusters (P < 1e−5 and P = 0.010; fig. 4C and D for the TE chromatin state and for JIL-1), which suggests that the JIL-1 binding intensity and TE chromatin state are relevant factors explaining the conservation of clusters including OBP genes.
Discussion
Cluster Inference
Several methods have been developed to detect gene clusters conserved across a phylogeny (Lathe et al. 2000; Tamames 2001; Zheng et al. 2005). These methods differ in their underlying biological assumptions; therefore, their appropriateness depends on the biological question to be addressed. For example, the Synteny Database (Catchen et al. 2009) uses synteny information (i.e., it requires the same gene order and orientation across two genomes) to infer ortholog and paralog relationships, whereas the original version of the OperonDB algorithm (Ermolaeva et al. 2001) searches for clusters of physically close gene pairs conserved across different species to predict operons. The latter version of OperonDB (Pertea et al. 2009) improves the sensibility of the method by allowing rearrangement events inside the candidate cluster regions. There is compelling evidence indicating that some functional clusters can undergo internal rearrangements without transcriptional consequences (Itoh et al. 1999; Lathe et al. 2000); this observation led to the formation of the gene team model (Luc et al. 2003), which we applied here to infer Drosophila clusters.
Nevertheless, the gene team model implemented in the MCMuSeC software (Ling et al. 2009) also has some statistical problems. First, the inferred clusters can contain overlapping information, that is, a particular gene may be present in more than one cluster. Because such a feature violates the independence premise assumed for most statistical tests, we have confirmed that all of our conclusions hold after excluding overlapping clusters (1,634 out of 3,434 clusters have nonoverlapping information, and 25 of these encompass OBP genes). Second, the statistical power to estimate conserved gene clusters increases with the species divergence time. Indeed, the 12 Drosophila species (Drosophila 12 Genomes 2007) used in this study are not divergent enough to detect small clusters (i.e., up to three genes). To detect such small clusters, it would be more appropriate to use more divergent species. However, the 12 Drosophila genomes provide a reasonable tradeoff between the quality of the assemblies and annotations (e.g., identification of orthologous and low sequence fragmentation in scaffolds) and the statistical power. This issue has important implications because two main classes of clusters have been described (Weber and Hurst 2011): small clusters of highly coexpressed genes (likely constrained by shared CREs) and large clusters of housekeeping and unrelated (i.e., nonhomologous) genes. Despite using genome data from 12 Drosophila species small-size clusters may be underestimated, this bias should not be relevant for the second cluster class. Thus, our results do not discard a relevant role of shared CREs in shaping genome architecture, but rather highlight the importance of high-order chromatin coregulatory mechanisms in the OBP gene organization. We mostly found large clusters (an average of 6.4 and 8.3 genes for clusters with and without OBP genes, respectively), which comprise a number of nonhomologous genes that exhibit high gene EB; features that characterize housekeeping gene clusters (i.e., the large-size cluster class).
Clusters Including OBP Genes Are Conserved by Functional Constraints
We identified 31 clusters including—at least—one OBP gene, and ten remained significant after correcting for multiple testing (table 1). Although natural selection may appear as the most immediate explanation for the conservation of the OBP genome organization, it could also represent a by-product of the uneven distribution of rearrangements along chromosomes (Ranz et al. 2001; Pevzner and Tesler 2003; Ruiz-Herrera et al. 2006; Bhutkar et al. 2008). Indeed, orthologous chromosome regions affected by a reduced number of rearrangements may maintain their cluster-like structure in the absence of functional constraints (von Grotthuss et al. 2010). However, such an explanation is unlikely to be the main reason for the maintenance of clusters including OBP genes. Indeed, homologous chromosome regions depleted in rearrangement breakpoints (and hence in rearrangements) are not common across Drosophila species (Ranz et al. 2001; Bhutkar et al. 2008; Schaeffer et al. 2008). In fact, the recombination rate, which is highly associated with the rearrangement rate, widely varies among closely related species (True et al. 1996). Consistently, we found no association between the recombination rate (Comeron et al. 2012) and pBLS values across the 31 focal clusters (Spearman’s rank correlation coefficient: ρ = −0.14, P = 0.47), or across all 3,434 Drosophila clusters (Spearman’s rank correlation coefficient: ρ = 0.02, P = 0.16) (supplementary fig. S3, Supplementary Material online). This lack of association results from the fact that we evaluated the statistical significance of the clusters using the observed divergence time of microsynteny conservation as null distribution. As this empirical null distribution depends upon the mode of chromosome evolution, it already captures the information of the uneven rearrangement distribution observed along Drosophila chromosomes. Therefore, it is unlikely that the OBP gene organization was a by-product of the rearrangement rate heterogeneity. In contrast, it may be constrained by natural selection for some functional meaning.
As conserved clusters of functionally or transcriptionally linked genes may include nonparalogous members, we defined a cluster as a group of genes that maintain their neighborhood across species regardless of whether they are homologous. This approximation is different from that used by Vieira and Rozas (2011) who only consider clusters of OBP paralogs. These authors observed that OBP genes are found physically closer than expected by chance, although OR (odorant receptors) are not. In contrast, we found that some ORs are clustered with other nonhomologous genes (supplementary tables S1 and S3, Supplementary Material online). Similarly, clusters of OBP paralogs are conserved, but embedded within large arrangements that also include other non-OBP genes (table 1). For example, one of the most conserved Drosophila clusters includes lush (table 1 and fig. 5), which encodes an OBP involved in social aggregation and mating behavior (Xu et al. 2005), but also Shal (a potassium channel), ash1 (involved in the ovoposition and oogenesis), asf1 (dendrite morphogenesis), and tey (synaptic target recognition). Noticeably, the genes within this cluster also exhibit similar patterns of transcription across different developmental stages (fig. 5; Graveley et al. 2011). Overall, it suggests that some functional and transcriptional links maintain the lush genome cluster.
Fig. 5.—

The cluster including the lush (Obp76a) gene. The cluster (pBLS value of 0.999983) including lush (Obp76a) and other 19 non-OBP genes (blue boxes). The coordinates (from 19,570 k to 19,680 k) correspond to the 3L chromosome of Drosophila melanogaster. The intensity peaks below the genes indicate the EI values across 30 developmental stages (in different colors).
High-Order Chromatin Regulatory Mechanisms Provide the Appropriate Transcriptional Environment for Cluster Maintenance
Chromatin domains may restrict the location of genes to regions having the appropriate transcriptional environment (Noordermeer et al. 2011; Thomas et al. 2011), which may maintain the OBP gene organization. Nonhistone chromatin proteins regulating the chromatin state are therefore of particular interest. For example, lamin Dm0, which physically interacts with JIL-1 kinase (Bao et al. 2005), binds to gene clusters conserved across Drosophila species (Ranz et al. 2011). Remarkably, we found a strong association between the JIL-1 binding intensity and the maintenance of clusters including OBP genes (Spearman’s rank correlation coefficient: ρ = 0.617, P = 0.010; fig. 4D). Moreover, genes regulated by JIL-1 kinase exhibit elevated levels of EB (Regnard et al. 2011) and EN (JIL-1 releases the paused RNA polymerase II at the proximal-promoter (Kellner et al. 2012), favoring transcriptional elongation bursts that increase EN [Becskei et al. 2005; Kaern et al. 2005; Rajala et al. 2010]). Consistent with this idea, we have shown that the OBP gene organization is associated with elevated levels of EB (P = 0.004) and EN (P = 0.043).
It has been shown that housekeeping genes may be particularly confined to chromosome regions possessing the appropriate transcriptional environment; indeed, mutations that alter their location may exert important deleterious pleiotropic effects in diverse tissues and developmental stages (Wang and Zhang 2010). Batada and Hurst (2007) have suggested that broadly expressed genes are located in chromosome regions with low stochastic transcriptional fluctuations to minimize the deleterious effects of EN. However, the functional constraints underlying the conservation of the OBP gene organization do not support this hypothesis. First, clusters with OBP genes often exhibit a high proportion of broad-type promoters, which yield elevated levels of EB. Although these two features (broad-promoters and EB) are associated with reduced levels of EN (Tirosh and Barkai 2008; Wang and Zhang 2010; Xi et al. 2011), we detected a positive relationship between the stochastic transcriptional fluctuation (EN) and the pBLS value of these clusters (table 3). Second, although EN can be alleviated by increasing EI (Lehner 2008), the most conserved clusters include OBP genes not only with the highest EN (partial correlation analysis, P = 0.025) but also with the lowest EI (partial correlation analysis; P = 0.009; table 3). In fact, the EI effect on pBLS is lower for clusters with OBP genes than for random samples of 31 comparable clusters (P = 0.034). Finally, even though head-to-head gene pair arrangements can minimize EN (Wang et al. 2011), clusters with OBP genes do not exhibit a significant correlation between the pBLS value and the proportion of head-to-head gene pair frequency. Therefore, a suitable transcriptional environment need not always have reduced levels of EN; indeed, a clustering model based on elevated EN levels may explain the OBP gene organization.
Some theoretical models predict that, under certain circumstances, EN can even be beneficial as a source for natural variation, particularly for proteins acting in changing environments (e.g., stress response proteins such as oxidative kinases [Dong et al. 2011]). Some empirical results are consistent with this model. In yeast, for example, the elevated EN of plasma-membrane transporters appears to be driven by positive selection (Zhang et al. 2009). The genes clustered with OBPs also encode membrane proteins and, interestingly, many of these proteins have transporter activity (table 2). In fact, the extensive transcriptional diversification of the OBPs suggests that, apart from transporting odorants of the external environment, some OBPs also act as general carriers of hydrophobic molecules through the extracellular matrix (Arya et al. 2010). Therefore, higher EN levels may allow for the detection of wider ranges of concentrations of hydrophobic molecules. Fluctuations in OBP transcript abundance may represent an important mechanism to increase phenotypic plasticity. Mutations affecting OBP mRNA stability (Wang et al. 2007) and reduced OBP expression levels (Swarup et al. 2011) can actually elicit different Drosophila behaviors to particular odorants, that is, fluctuations in OBP transcript abundance can play a key role in the combinatorial nature of the olfactory coding process. Therefore, natural selection may have favored assembling OBP genes in chromosomal regions with high EN, which in turn may have led to the observed structure of OBP genes in clusters of functionally and transcriptionally related genes.
Supplementary Material
Supplementary tables S1–S3 and figures S1–S3 are available at Genome Biology and Evolution online (http://www.gbe.oxfordjournals.org/).
Acknowledgments
J.R. conceived and supervised all research. P.L. developed the bioinformatics tools, analyzed the data, and wrote the first version of the manuscript. Both the authors approved the final manuscript. The authors thank J.M. Ranz, F.G. Vieira, and three anonymous reviewers for their comments and suggestions on the manuscript. This work was supported the Ministerio de Ciencia e Innovación of Spain grants BFU2007-62927 and BFU2010-15484, the Comissió Interdepartamental de Recerca I Innovació Tecnològica of Spain grant 2009SGR-1287, and the ICREA Acadèmia (Generalitat de Catalunya) grant to J.R. (partially supported).
Literature Cited
- Arya GH, et al. Natural variation, functional pleiotropy and transcriptional contexts of odorant binding protein genes in Drosophila melanogaster. Genetics. 2010;186:147–1485. doi: 10.1534/genetics.110.123166. [DOI] [PMC free article] [PubMed] [Google Scholar]
- Bao X, et al. The JIL-1 kinase interacts with lamin Dm0 and regulates nuclear lamina morphology of Drosophila nurse cells. J Cell Sci. 2005;118:5079–5087. doi: 10.1242/jcs.02611. [DOI] [PubMed] [Google Scholar]
- Batada NN, Hurst LD. Evolution of chromosome organization driven by selection for reduced gene expression noise. Nat Genet. 2007;39:945–949. doi: 10.1038/ng2071. [DOI] [PubMed] [Google Scholar]
- Bauer S, Grossmann S, Vingron M, Robinson PN. Ontologizer 2.0—a multifunctional tool for GO term enrichment analysis and data exploration. Bioinformatics. 2008;24:1650–1651. doi: 10.1093/bioinformatics/btn250. [DOI] [PubMed] [Google Scholar]
- Becskei A, Kaufmann BB, van Oudenaarden A. Contributions of low molecule number and chromosomal positioning to stochastic gene expression. Nat Genet. 2005;37:937–944. doi: 10.1038/ng1616. [DOI] [PubMed] [Google Scholar]
- Benjamini Y, Hochberg Y. Controlling the false discovery rate: a practical and powerful approach to multiple testing. J Royal Stat Soc B. 1995;57:289–300. [Google Scholar]
- Bhutkar A, et al. Chromosomal rearrangement inferred from comparisons of 12 Drosophila genomes. Genetics. 2008;179:1657–1680. doi: 10.1534/genetics.107.086108. [DOI] [PMC free article] [PubMed] [Google Scholar]
- Biessmann H, et al. The Anopheles gambiae odorant binding protein 1 (AgamOBP1) mediates indole recognition in the antennae of female mosquitoes. PLoS One. 2010;5:e9471. doi: 10.1371/journal.pone.0009471. [DOI] [PMC free article] [PubMed] [Google Scholar]
- Boutanaev AM, Kalmykova AI, Shevelyov YY, Nurminsky DI. Large clusters of co-expressed genes in the Drosophila genome. Nature. 2002;420:666–669. doi: 10.1038/nature01216. [DOI] [PubMed] [Google Scholar]
- Capelson M, et al. Chromatin-bound nuclear pore components regulate gene expression in higher eukaryotes. Cell. 2010;140:372–383. doi: 10.1016/j.cell.2009.12.054. [DOI] [PMC free article] [PubMed] [Google Scholar]
- Caron H, et al. The human transcriptome map: clustering of highly expressed genes in chromosomal domains. Science. 2001;291:1289–1292. doi: 10.1126/science.1056794. [DOI] [PubMed] [Google Scholar]
- Carvajal-Rodriguez A, de Una-Alvarez J, Rolan-Alvarez E. A new multitest correction (SGoF) that increases its statistical power when increasing the number of tests. BMC Bioinformatics. 2009;10:209. doi: 10.1186/1471-2105-10-209. [DOI] [PMC free article] [PubMed] [Google Scholar]
- Catchen JM, Conery JS, Postlethwait JH. Automated identification of conserved synteny after whole-genome duplication. Genome Res. 2009;19:1497–1505. doi: 10.1101/gr.090480.108. [DOI] [PMC free article] [PubMed] [Google Scholar]
- Comeron JM, Ratnappan R, Bailin S. The many landscapes of recombination in Drosophila melanogaster. PLoS Genet. 2012;8:e1002905. doi: 10.1371/journal.pgen.1002905. [DOI] [PMC free article] [PubMed] [Google Scholar]
- Chamaon K, Smalla KH, Thomas U, Gundelfinger ED. Nicotinic acetylcholine receptors of Drosophila: three subunits encoded by genomically linked genes can co-assemble into the same receptor complex. J Neurochem. 2002;80:149–157. doi: 10.1046/j.0022-3042.2001.00685.x. [DOI] [PubMed] [Google Scholar]
- Chintapalli VR, Wang J, Dow JA. Using FlyAtlas to identify better Drosophila melanogaster models of human disease. Nat Genet. 2007;39:715–720. doi: 10.1038/ng2049. [DOI] [PubMed] [Google Scholar]
- Dong D, Shao X, Deng N, Zhang Z. Gene expression variations are predictive for stochastic noise. Nucleic Acids Res. 2011;39:403–413. doi: 10.1093/nar/gkq844. [DOI] [PMC free article] [PubMed] [Google Scholar]
- Drosophila 12 Genomes C, et al. Evolution of genes and genomes on the Drosophila phylogeny. Nature. 2007;450:203–218. doi: 10.1038/nature06341. [DOI] [PubMed] [Google Scholar]
- Engstrom PG, Ho Sui SJ, Drivenes O, Becker TS, Lenhard B. Genomic regulatory blocks underlie extensive microsynteny conservation in insects. Genome Res. 2007;17:1898–1908. doi: 10.1101/gr.6669607. [DOI] [PMC free article] [PubMed] [Google Scholar]
- Ermolaeva MD, White O, Salzberg SL. Prediction of operons in microbial genomes. Nucleic Acids Res. 2001;29:1216–1221. doi: 10.1093/nar/29.5.1216. [DOI] [PMC free article] [PubMed] [Google Scholar]
- Filion GJ, et al. Systematic protein location mapping reveals five principal chromatin types in Drosophila cells. Cell. 2010;143:212–224. doi: 10.1016/j.cell.2010.09.009. [DOI] [PMC free article] [PubMed] [Google Scholar]
- Foret S, Maleszka R. Function and evolution of a gene family encoding odorant binding-like proteins in a social insect, the honey bee (Apis mellifera) Genome Res. 2006;16:1404–1413. doi: 10.1101/gr.5075706. [DOI] [PMC free article] [PubMed] [Google Scholar]
- Fraser HB, Hirsh AE, Giaever G, Kumm J, Eisen MB. Noise minimization in eukaryotic gene expression. PLoS Biol. 2004;2:e137. doi: 10.1371/journal.pbio.0020137. [DOI] [PMC free article] [PubMed] [Google Scholar]
- Gan M, Moebus S, Eggert H, Saumweber H. The Chriz-Z4 complex recruits JIL-1 to polytene chromosomes, a requirement for interband-specific phosphorylation of H3S10. J Biosci. 2011;36:425–438. doi: 10.1007/s12038-011-9089-y. [DOI] [PubMed] [Google Scholar]
- Gilbert N, et al. Chromatin architecture of the human genome: gene-rich domains are enriched in open chromatin fibers. Cell. 2004;118:555–566. doi: 10.1016/j.cell.2004.08.011. [DOI] [PubMed] [Google Scholar]
- Graveley BR, et al. The developmental transcriptome of Drosophila melanogaster. Nature. 2011;471:473–479. doi: 10.1038/nature09715. [DOI] [PMC free article] [PubMed] [Google Scholar]
- Grossmann S, Bauer S, Robinson PN, Vingron M. Improved detection of overrepresentation of gene-ontology annotations with parent child analysis. Bioinformatics. 2007;23:3024–3031. doi: 10.1093/bioinformatics/btm440. [DOI] [PubMed] [Google Scholar]
- Hekmat-Scafe DS, Scafe CR, McKinney AJ, Tanouye MA. Genome-wide analysis of the odorant-binding protein gene family in Drosophila melanogaster. Genome Res. 2002;12:1357–1369. doi: 10.1101/gr.239402. [DOI] [PMC free article] [PubMed] [Google Scholar]
- Hoskins RA, et al. Genome-wide analysis of promoter architecture in Drosophila melanogaster. Genome Res. 2011;21:182–192. doi: 10.1101/gr.112466.110. [DOI] [PMC free article] [PubMed] [Google Scholar]
- Huerta-Cepas J, Gabaldon T. Assigning duplication events to relative temporal scales in genome-wide studies. Bioinformatics. 2011;27:38–45. doi: 10.1093/bioinformatics/btq609. [DOI] [PubMed] [Google Scholar]
- Itoh T, Takemoto K, Mori H, Gojobori T. Evolutionary instability of operon structures disclosed by sequence comparisons of complete microbial genomes. Mol Biol Evol. 1999;16:332–346. doi: 10.1093/oxfordjournals.molbev.a026114. [DOI] [PubMed] [Google Scholar]
- Jin Y, et al. JIL-1: a novel chromosomal tandem kinase implicated in transcriptional regulation in Drosophila. Mol Cell. 1999;4:129–135. doi: 10.1016/s1097-2765(00)80195-1. [DOI] [PubMed] [Google Scholar]
- Kaern M, Elston TC, Blake WJ, Collins JJ. Stochasticity in gene expression: from theories to phenotypes. Nat Rev Genet. 2005;6:451–464. doi: 10.1038/nrg1615. [DOI] [PubMed] [Google Scholar]
- Kalmykova AI, Nurminsky DI, Ryzhov DV, Shevelyov YY. Regulated chromatin domain comprising cluster of co-expressed genes in Drosophila melanogaster. Nucleic Acids Res. 2005;33:1435–1444. doi: 10.1093/nar/gki281. [DOI] [PMC free article] [PubMed] [Google Scholar]
- Kellner WA, Ramos E, Van Bortle K, Takenaka N, Corces VG. Genome-wide phosphoacetylation of histone H3 at Drosophila enhancers and promoters. Genome Res. 2012;22:1081–1088. doi: 10.1101/gr.136929.111. [DOI] [PMC free article] [PubMed] [Google Scholar]
- Kensche PR, Oti M, Dutilh BE, Huynen MA. Conservation of divergent transcription in fungi. Trends Genet. 2008;24:207–211. doi: 10.1016/j.tig.2008.02.003. [DOI] [PubMed] [Google Scholar]
- Kharchenko PV, et al. Comprehensive analysis of the chromatin landscape in Drosophila melanogaster. Nature. 2011;471:480–485. doi: 10.1038/nature09725. [DOI] [PMC free article] [PubMed] [Google Scholar]
- Krieger MJ, Ross KG. Identification of a major gene regulating complex social behavior. Science. 2002;295:328–332. doi: 10.1126/science.1065247. [DOI] [PubMed] [Google Scholar]
- Kruse SW, Zhao R, Smith DP, Jones DNM. Structure of a specific alcohol-binding site defined by the odorant binding protein LUSH from Drosophila melanogaster. Nat Struct Mol Biol. 2003;10:694. doi: 10.1038/nsb960. [DOI] [PMC free article] [PubMed] [Google Scholar]
- Lathe WC, 3rd, Snel B, Bork P. Gene context conservation of a higher order than operons. Trends Biochem Sci. 2000;25:474–479. doi: 10.1016/s0968-0004(00)01663-7. [DOI] [PubMed] [Google Scholar]
- Laughlin JD, Ha TS, Jones DNM, Smith DP. Activation of pheromone-sensitive neurons is mediated by conformational activation of pheromone-binding protein. Cell. 2008;133:1255–1265. doi: 10.1016/j.cell.2008.04.046. [DOI] [PMC free article] [PubMed] [Google Scholar]
- Lee JM, Sonnhammer EL. Genomic gene clustering analysis of pathways in eukaryotes. Genome Res. 2003;13:875–882. doi: 10.1101/gr.737703. [DOI] [PMC free article] [PubMed] [Google Scholar]
- Lehner B. Selection to minimise noise in living systems and its implications for the evolution of gene expression. Mol Syst Biol. 2008;4:170. doi: 10.1038/msb.2008.11. [DOI] [PMC free article] [PubMed] [Google Scholar]
- Lercher MJ, Urrutia AO, Hurst LD. Clustering of housekeeping genes provides a unified model of gene order in the human genome. Nat Genet. 2002;31:180–183. doi: 10.1038/ng887. [DOI] [PubMed] [Google Scholar]
- Li G, Reinberg D. Chromatin higher-order structures and gene regulation. Curr Opin Genet Dev. 2011;21:175–186. doi: 10.1016/j.gde.2011.01.022. [DOI] [PMC free article] [PubMed] [Google Scholar]
- Li YY, et al. Systematic analysis of head-to-head gene organization: evolutionary conservation and potential biological relevance. PLoS Comput Biol. 2006;2:e74. doi: 10.1371/journal.pcbi.0020074. [DOI] [PMC free article] [PubMed] [Google Scholar]
- Librado P, Vieira FG, Rozas J. BadiRate: estimating family turnover rates by likelihood-based methods. Bioinformatics. 2012;28:279–281. doi: 10.1093/bioinformatics/btr623. [DOI] [PubMed] [Google Scholar]
- Ling X, He X, Xin D. Detecting gene clusters under evolutionary constraint in a large number of genomes. Bioinformatics. 2009;25:571–577. doi: 10.1093/bioinformatics/btp027. [DOI] [PubMed] [Google Scholar]
- Luc N, Risler JL, Bergeron A, Raffinot M. Gene teams: a new formalization of gene clusters for comparative genomics. Comput Biol Chem. 2003;27:59–67. doi: 10.1016/s1476-9271(02)00097-x. [DOI] [PubMed] [Google Scholar]
- Luz H, Staub E, Vingron M. About the interrelation of evolutionary rate and protein age. Genome Inform. 2006;17:240–250. [PubMed] [Google Scholar]
- Maeda RK, Karch F. Making connections: boundaries and insulators in Drosophila. Curr Opin Genet Dev. 2007;17:394–399. doi: 10.1016/j.gde.2007.08.002. [DOI] [PubMed] [Google Scholar]
- Matsuo T, Sugaya S, Yasukawa J, Aigaki T, Fuyama Y. Odorant-binding proteins OBP57d and OBP57e affect taste perception and host-plant preference in Drosophila sechellia. PLoS Biol. 2007;5:e118. doi: 10.1371/journal.pbio.0050118. [DOI] [PMC free article] [PubMed] [Google Scholar]
- Negre N, et al. A comprehensive map of insulator elements for the Drosophila genome. PLoS Genet. 2010;6:e1000814. doi: 10.1371/journal.pgen.1000814. [DOI] [PMC free article] [PubMed] [Google Scholar]
- Newman JR, et al. Single-cell proteomic analysis of S. cerevisiae reveals the architecture of biological noise. Nature. 2006;441:840–846. doi: 10.1038/nature04785. [DOI] [PubMed] [Google Scholar]
- Noordermeer D, et al. The dynamic architecture of Hox gene clusters. Science. 2011;334:222–225. doi: 10.1126/science.1207194. [DOI] [PubMed] [Google Scholar]
- Pearson K. On the measurement of the influence of “broad categories” on correlation. Biometrika. 1913;9:116–139. [Google Scholar]
- Pertea M, Ayanbule K, Smedinghoff M, Salzberg SL. OperonDB: a comprehensive database of predicted operons in microbial genomes. Nucleic Acids Res. 2009;37:D479–D482. doi: 10.1093/nar/gkn784. [DOI] [PMC free article] [PubMed] [Google Scholar]
- Pevzner P, Tesler G. Human and mouse genomic sequences reveal extensive breakpoint reuse in mammalian evolution. Proc Natl Acad Sci U S A. 2003;100:7672–7677. doi: 10.1073/pnas.1330369100. [DOI] [PMC free article] [PubMed] [Google Scholar]
- Rach EA, et al. Transcription initiation patterns indicate divergent strategies for gene regulation at the chromatin level. PLoS Genet. 2011;7:e1001274. doi: 10.1371/journal.pgen.1001274. [DOI] [PMC free article] [PubMed] [Google Scholar]
- Rajala T, Hakkinen A, Healy S, Yli-Harja O, Ribeiro AS. Effects of transcriptional pausing on gene expression dynamics. PLoS Comput Biol. 2010;6:e1000704. doi: 10.1371/journal.pcbi.1000704. [DOI] [PMC free article] [PubMed] [Google Scholar]
- Ranz JM, Casals F, Ruiz A. How malleable is the eukaryotic genome? Extreme rate of chromosomal rearrangement in the genus Drosophila. Genome Res. 2001;11:230–239. doi: 10.1101/gr.162901. [DOI] [PMC free article] [PubMed] [Google Scholar]
- Ranz JM, Diaz-Castillo C, Petersen R. Conserved gene order at the nuclear periphery in Drosophila. Mol Biol Evol. 2011;29:13–16. doi: 10.1093/molbev/msr178. [DOI] [PubMed] [Google Scholar]
- Rath U, et al. The chromodomain protein, Chromator, interacts with JIL-1 kinase and regulates the structure of Drosophila polytene chromosomes. J Cell Sci. 2006;119:2332–2341. doi: 10.1242/jcs.02960. [DOI] [PubMed] [Google Scholar]
- Regnard C, et al. Global analysis of the relationship between JIL-1 kinase and transcription. PLoS Genet. 2011;7:e1001327. doi: 10.1371/journal.pgen.1001327. [DOI] [PMC free article] [PubMed] [Google Scholar]
- Reshef DN, et al. Detecting novel associations in large data sets. Science. 2011;334:1518–1524. doi: 10.1126/science.1205438. [DOI] [PMC free article] [PubMed] [Google Scholar]
- Ruiz-Herrera A, Castresana J, Robinson TJ. Is mammalian chromosomal evolution driven by regions of genome fragility? Genome Biol. 2006;7:R115. doi: 10.1186/gb-2006-7-12-r115. [DOI] [PMC free article] [PubMed] [Google Scholar]
- Sanchez-Gracia A, Rozas J. Molecular population genetics of the OBP83 genomic region in Drosophila subobscura and D. guanche: contrasting the effects of natural selection and gene arrangement expansion in the patterns of nucleotide variation. Heredity. 2011;106:191–201. doi: 10.1038/hdy.2010.26. [DOI] [PMC free article] [PubMed] [Google Scholar]
- Schaeffer SW, et al. Polytene chromosomal maps of 11 Drosophila species: the order of genomic scaffolds inferred from genetic and physical maps. Genetics. 2008;179:1601–1655. doi: 10.1534/genetics.107.086074. [DOI] [PMC free article] [PubMed] [Google Scholar]
- Swarup S, Williams TI, Anholt RR. Functional dissection of odorant binding protein genes in Drosophila melanogaster. Genes Brain Behav. 2011;10:648–657. doi: 10.1111/j.1601-183X.2011.00704.x. [DOI] [PMC free article] [PubMed] [Google Scholar]
- Tamames J. Evolution of gene order conservation in prokaryotes. Genome Biol. 2001;2:RESEARCH0020. doi: 10.1186/gb-2001-2-6-research0020. [DOI] [PMC free article] [PubMed] [Google Scholar]
- Tamura K, Subramanian S, Kumar S. Temporal patterns of fruit fly (Drosophila) evolution revealed by mutation clocks. Mol Biol Evol. 2004;21:36–44. doi: 10.1093/molbev/msg236. [DOI] [PubMed] [Google Scholar]
- Tegoni M, Campanacci V, Cambillau C. Structural aspects of sexual attraction and chemical communication in insects. Trends Biochem Sci. 2004;29:257–264. doi: 10.1016/j.tibs.2004.03.003. [DOI] [PubMed] [Google Scholar]
- Thomas S, et al. Dynamic reprogramming of chromatin accessibility during Drosophila embryo development. Genome Biol. 2011;12:R43. doi: 10.1186/gb-2011-12-5-r43. [DOI] [PMC free article] [PubMed] [Google Scholar]
- Tirosh I, Barkai N. Two strategies for gene regulation by promoter nucleosomes. Genome Res. 2008;18:1084–1091. doi: 10.1101/gr.076059.108. [DOI] [PMC free article] [PubMed] [Google Scholar]
- Trinklein ND, et al. An abundance of bidirectional promoters in the human genome. Genome Res. 2004;14:62–66. doi: 10.1101/gr.1982804. [DOI] [PMC free article] [PubMed] [Google Scholar]
- True JR, Mercer JM, Laurie CC. Differences in crossover frequency and distribution among three sibling species of Drosophila. Genetics. 1996;142:507–523. doi: 10.1093/genetics/142.2.507. [DOI] [PMC free article] [PubMed] [Google Scholar]
- Vaquerizas JM, et al. Nuclear pore proteins nup153 and megator define transcriptionally active regions in the Drosophila genome. PLoS Genet. 2010;6:e1000846. doi: 10.1371/journal.pgen.1000846. [DOI] [PMC free article] [PubMed] [Google Scholar]
- Vieira FG, Rozas J. Comparative genomics of the odorant-binding and chemosensory protein gene families across the Arthropoda: origin and evolutionary history of the chemosensory system. Genome Biol Evol. 2011;3:476–490. doi: 10.1093/gbe/evr033. [DOI] [PMC free article] [PubMed] [Google Scholar]
- Vieira FG, Sanchez-Gracia A, Rozas J. Comparative genomic analysis of the odorant-binding protein family in 12 Drosophila genomes: purifying selection and birth-and-death evolution. Genome Biol. 2007;8:R235. doi: 10.1186/gb-2007-8-11-r235. [DOI] [PMC free article] [PubMed] [Google Scholar]
- von Grotthuss M, Ashburner M, Ranz JM. Fragile regions and not functional constraints predominate in shaping gene organization in the genus Drosophila. Genome Res. 2010;20:1084–1096. doi: 10.1101/gr.103713.109. [DOI] [PMC free article] [PubMed] [Google Scholar]
- Wallace HA, Plata MP, Kang HJ, Ross M, Labrador M. Chromatin insulators specifically associate with different levels of higher-order chromatin organization in Drosophila. Chromosoma. 2009;119:177–194. doi: 10.1007/s00412-009-0246-0. [DOI] [PMC free article] [PubMed] [Google Scholar]
- Wang GZ, Lercher MJ, Hurst LD. Transcriptional coupling of neighboring genes and gene expression noise: evidence that gene orientation and noncoding transcripts are modulators of noise. Genome Biol Evol. 2010;3:320–331. doi: 10.1093/gbe/evr025. [DOI] [PMC free article] [PubMed] [Google Scholar]
- Wang GZ, Lercher MJ, Hurst LD. Transcriptional coupling of neighboring genes and gene expression noise: evidence that gene orientation and noncoding transcripts are modulators of noise. Genome Biol Evol. 2011;3:320–331. doi: 10.1093/gbe/evr025. [DOI] [PMC free article] [PubMed] [Google Scholar]
- Wang P, Lyman RF, Shabalina SA, Mackay TF, Anholt RR. Association of polymorphisms in odorant-binding protein genes with variation in olfactory response to benzaldehyde in Drosophila. Genetics. 2007;177:1655–1665. doi: 10.1534/genetics.107.079731. [DOI] [PMC free article] [PubMed] [Google Scholar]
- Wang Z, Zhang J. Impact of gene expression noise on organismal fitness and the efficacy of natural selection. Proc Natl Acad Sci U S A. 2010;108:E67–E76. doi: 10.1073/pnas.1100059108. [DOI] [PMC free article] [PubMed] [Google Scholar]
- Weber CC, Hurst LD. Support for multiple classes of local expression clusters in Drosophila melanogaster, but no evidence for gene order conservation. Genome Biol. 2011;12:R23. doi: 10.1186/gb-2011-12-3-r23. [DOI] [PMC free article] [PubMed] [Google Scholar]
- Wolf YI, Novichkov PS, Karev GP, Koonin EV, Lipman DJ. The universal distribution of evolutionary rates of genes and distinct characteristics of eukaryotic genes of different apparent ages. Proc Natl Acad Sci U S A. 2009;106:7273–7280. doi: 10.1073/pnas.0901808106. [DOI] [PMC free article] [PubMed] [Google Scholar]
- Xi Y, Yao J, Chen R, Li W, He X. Nucleosome fragility reveals novel functional states of chromatin and poises genes for activation. Genome Res. 2011;21:718–724. doi: 10.1101/gr.117101.110. [DOI] [PMC free article] [PubMed] [Google Scholar]
- Xu P, Atkinson R, Jones DN, Smith DP. Drosophila OBP LUSH is required for activity of pheromone-sensitive neurons. Neuron. 2005;45:193–200. doi: 10.1016/j.neuron.2004.12.031. [DOI] [PubMed] [Google Scholar]
- Xu Z, et al. Bidirectional promoters generate pervasive transcription in yeast. Nature. 2009;457:1033–1037. doi: 10.1038/nature07728. [DOI] [PMC free article] [PubMed] [Google Scholar]
- Yang L, Yu J. A comparative analysis of divergently-paired genes (DPGs) among Drosophila and vertebrate genomes. BMC Evol Biol. 2009;9:55. doi: 10.1186/1471-2148-9-55. [DOI] [PMC free article] [PubMed] [Google Scholar]
- Yeh S-D, et al. Functional evidence that a recently evolved Drosophila sperm-specific gene boosts sperm competition. Proc Natl Acad Sci U S A. 2012;109:2043–2048. doi: 10.1073/pnas.1121327109. [DOI] [PMC free article] [PubMed] [Google Scholar]
- Zhang Z, Qian W, Zhang J. Positive selection for elevated gene expression noise in yeast. Mol Syst Biol. 2009;5:299. doi: 10.1038/msb.2009.58. [DOI] [PMC free article] [PubMed] [Google Scholar]
- Zheng Y, Anton BP, Roberts RJ, Kasif S. Phylogenetic detection of conserved gene clusters in microbial genomes. BMC Bioinformatics. 2005;6:243. doi: 10.1186/1471-2105-6-243. [DOI] [PMC free article] [PubMed] [Google Scholar]
- Zhou S, Stone EA, Mackay TF, Anholt RR. Plasticity of the chemoreceptor repertoire in Drosophila melanogaster. PLoS Genet. 2009;5:e1000681. doi: 10.1371/journal.pgen.1000681. [DOI] [PMC free article] [PubMed] [Google Scholar]
Associated Data
This section collects any data citations, data availability statements, or supplementary materials included in this article.