Abstract
Sarcoma is a very rare disease that is heterogeneous in nature, all hampering the development of new therapies. Sarcoma patients are ideal candidates for personalized medicine after stratification, explaining the current interest in developing a reproducible and low-cost xenotransplant model for this disease. The chick chorioallantoic membrane is a natural immunodeficient host capable of sustaining grafted tissues and cells without species-specific restrictions. In addition, it is easily accessed, manipulated and imaged using optical and fluorescence stereomicroscopy. Histology further allows detailed analysis of heterotypic cellular interactions.
This protocol describes in detail the in ovo grafting of the chorioallantoic membrane with fresh sarcoma-derived tumor tissues, their single cell suspensions, and permanent and transient fluorescently labeled established sarcoma cell lines (Saos-2 and SW1353). The chick survival rates are up to 75%. The model is used to study graft- (viability, Ki67 proliferation index, necrosis, infiltration) and host (fibroblast infiltration, vascular ingrowth) behavior. For localized grafting of single cell suspensions, ECM gel provides significant advantages over inert containment materials. The Ki67 proliferation index is related to the distance of the cells from the surface of the CAM and the duration of application on the CAM, the latter determining a time frame for the addition of therapeutic products.
Keywords: Cancer Biology, Issue 77, Medicine, Cellular Biology, Molecular Biology, Biomedical Engineering, Bioengineering, Developmental Biology, Anatomy, Physiology, Oncology, Surgery, Adipose Tissue, Connective Tissue, Neoplasm, Muscle Tissue, Sarcoma, Animal Experimentation, Cell Culture Techniques, Neoplasms, Experimental, Neoplasm Transplantation, Biological Assay, Sarcomas, CAM-assay, CAM, assay, xenograft, proliferation, invasion, cancer, tumor, in ovo, animal model
Introduction
Sarcoma is a rare tumor of the connective tissues with a high mortality due to therapy resistance1,2. Progress in patient survival is hampered by their low annual incidence, their broad diversity, and the fact that sarcoma cells are reported to be hard to culture in vitro3,4.
The use of cultured cells for preclinical therapy evaluation has revealed that new, apparently active molecules in vitro do not always reflect results in the clinical setting. Furthermore, genome aberrations revealed by gene expression arrays are not always correlated to tumor behavior characteristics in the individual patient5-7. In order to try and solve these problems, personalized medicine has gained in importance, which is reflected in the increased search for xenograft models8-12.
An in vivo assay has the advantage of reflecting the complex interplay between cancer cells and the host tissue environment in solid tumors, necessary for cancer proliferation and invasion13. Currently we study the use of the Chorio-Allantoic Membrane assay (CAM-assay) as a reproducible xenograft model for sarcoma14,15. This assay is widely used for the study of tumor angiogenesis16,17. In literature, however, we have found different protocols for this assay, while other studies observed a marked difference in growth or angiogenesis according to different protocols18,19.
In this article we investigate the effect of varying conditions of the CAM-assay on cell behavior using tumor grafts, tumor-derived single cell suspensions and established sarcoma cell cultures.
Protocol
See Figure 1 for an overview.
Tumor material
1. Obtaining and Preparing Tumor Samples
For the use of patient material, approval of the Ethical Committee is necessary, and informed consent has to be obtained from the patient.
Harvest representative material (minimum 1 cm3) at the time of intervention, either a biopsy or a resection of a sarcoma. The proper site of biopsy is defined using dynamic-contrast MRI.
Place the material immediately in a sterile vial containing DMEM supplemented with 1,000 U Penicillin and 1 mg/ml streptomycin.
Transport the vial immediately (30 - 90 min) to the lab.
All following procedures are performed under laminar flow.
Pour the contents of the vial into a sterile Petri dish.
Put the tumor sample into small parts of maximally 1 mm3 using a sterile scalpel. Remove all calcified parts as they tend to impair further processing of the tissue.
Randomly take 10 tumor grafts for application on the CAM.
2. Preparation of Tumor-derived Single Cell Suspensions
Approximate duration: 3 hr.
Weigh the remaining tissue of the sample.
Put 2 - 4 g of tissue in a dissociator tube, more than one tube may be required to digest all the remaining tumor tissue.
For digestion of 2 - 4 g of tissue, add 2.5 ml collagenase 2 solution (500 U/ml RPMI 1640) and 2.5 ml DNase solution (22 KU/ml RPMI 1640).
Process the tissue according to the dissociator h_tumor protocol. This involves 2 cycles of incubation at 37 °C in CO2 incubator while the tube is shaken gently for 30 min.
Filter the remaining suspension through a 150 μm cell strainer.
Centrifuge the lysate at 1,000 rpm for 5 min.
Remove the supernatant.
Resuspend the pellet in 10 ml of erythrocyte lysis buffer (ELB), allowing 10 min of incubation with regular suspension.
Note: erythrocyte lysis buffer is manufactured as follows: Add 0.037 g EDTA, 0.99 g K2HPO4, 8.29 g NH4Cl to 1,000 ml aqua, use 10 N NaOH to adjust the pH to 7.3, filter under pressure through a 0.22 μm filter. Store at 4 °C.
Add 25 ml of culture medium (DMEM supplemented with 10% fetal bovine serum, 100 U/ml penicillin, and 100 μg/ml streptomycin) to stop the reaction.
Centrifuge the suspension at 1,000 rpm for 5 min. The color of the pellet should be white now.
Remove the supernatant.
Add 5 ml of medium to the pellet. Filter the suspension through a 70 μm cell strainer.
Count the number of live cells/ml by means of an automatic cell counter.
3. Cancer Cell Lines
SAOS2 osteosarcoma cells (ATCC number: HTB-85) expressing enhanced green fluorescent protein were electroporated by peGFP-C1 vector using the Cell Line Nucleofector Kit V according to the manufacturer's protocol. To establish stable cell lines, transfected cells were selected in G418 (1 mg/ml) for 4 weeks in line with previous established protocol20. In addition sorting was performed by fluorescence activated cell sorting (FACS) according to the manufacturer's instructions.
Cells from the SW1353 chondrosarcoma cell line (ATCC number: HTB-94) or freshly prepared tumor single cell suspensions are labeled using a red fluorescent lipophilic membrane stain.
Remove the cells from the culture flask in a classical way using Trypsin (0.5% wt/vol) ethylenediaminetetraacetic acid (EDTA; 0.2% wt/vol) solution.
Centrifuge the cell suspension for 5 min at 1,000 rpm.
Remove the supernatant.
Add 1 ml of serum-free medium and 5 μl DiI (Vybrant Red)/106 cells.
Wrap the vial in aluminum foil and put it in the CO2 incubator for 10 min at 37 °C.
Centrifuge again for 5 min at 1,000 rpm and remove the supernatant.
Chorioallantoic membrane assay
1. Egg Incubation
Fertilized eggs from a local commercial hatchery guaranteeing 95% fertilisation of the eggs are required.
Fertilized eggs can be stored at RT up to 10 days.
Note: before starting incubation, dirt, feathers and excrement are carefully removed from the eggshells mechanically by dry wiping with paper towels, which have a rough rather than a soft surface structure. Wiping the eggs with 70% denatured ethanol or any other cleaning reagent significantly reduces the survival rate of the chick embryos.
Put the eggs in the incubator on one side, marking the upper surface. The day on which the eggs are put in the incubator is designated day 0 of embryonic development.
Set the incubation temperature at 37.8 °C, and the humidity at 47%. Make sure the automatic rotation option is switched off.
2. Opening of the Eggs
Duration: ± 60 min for 25 eggs.
On development day 3, the eggs are opened under laminar airflow. Opening the eggs at a further developmental stage results in damage to the CAM, as the membrane tends to stick to the shell. An infrared lamp is used to keep the eggs warm during the procedure. To improve sterility, we recommend the use of hand gloves.
Place the egg in the eggcup, with the marked side facing upwards.
Lower the level of the CAM by removing two ml of albumen through an 18 G needle inserted at the tip of the egg. If the needle is blunt after perforating several eggshells, replace the needle. If not, too much force has to be exerted, resulting in damage to the egg yolk or fracture of the shell. Sometimes the needle is blocked by the chalazae, one of 2 spiral bands suspending the yolk in albumen. This can be solved by gently pushing the plunger back down until the block is resolved. If egg yolk is sucked into the syringe, replace the needle as well as the syringe. Sometimes the embryo dies after this event. If an insufficient amount of albumen is removed, the CAM will be damaged when the shell is removed.
Apply a semipermeable adhesive film at the marked upper side of the shell in order to prevent spilling of shell particles onto the CAM while cutting the window.
Make an introduction hole with a small awl at the surface of the egg.
Cut a window of 1 cm2 in the shell, using a pair of sterile sharp-pointed surgical scissors.
The embryo's pulsating heart and adjoining vessels can be observed at the surface of the egg yolk. Remove the non-fertilized eggs or dead embryos. An interrupted aspect of the blood vessels characterizes dead embryos.
Seal the window with a semipermeable adhesive film. It is not necessary to cover the puncture site, unless the shell has cracked during insertion of the needle.
3. Inoculation Procedure
Duration: ± 1 hr per cell line.
On chick embryonic development day 9, the eggs are inoculated under laminar airflow.
Evaluation of cancer cell spreading across the CAM requires containment of the cells to a limited surface during inoculation. Matrigel is an extracellular matrix (ECM) gel from the Engelbreth-Holm-Swarm mouse sarcoma frequently used in experimental cell culture conditions. It is a fluid when cooled, but will undergo thermally activated polymerization when brought to 20 - 40 °C, thus forming a stable gel. During the experiments, Matrigel is kept in a box containing melting ice.
Note: We insist not to use perforated coverslips. We observed attachment and growth of grafted cancer cells onto the plastic disc thus biasing growth potential of the cells on the membrane itself.
Resuspend a cell pellet in cooled ECM gel at a concentration of 106 cells/100 μl ECM gel. Keep this solution on melting ice.
Excise part of the semi-permeable membrane with a pair of sterile surgical under laminar airflow. If the adhesive film is removed completely, this will result in a larger proportion of embryonic death due to contamination.
Touch the CAM right below the shell window lightly with a sterile glass rod, in order to remove the epithelial cell layer. Touching the CAM with a sterile glass rod proves to be less traumatic than using a scalpel n° 11, which requires more handiness and experience. Small hemorrhages may occur.
Adding tumor material.
For tumor grafts: gently lower one piece of tissue onto the CAM with a pair of sterile forceps, without squeezing it.
For the ECM gel procedure: Add 4x 25 μl of the cell-ECM gel suspension to the CAM, on top of each other, allowing the ECM gel to polymerize in between the applications. In this way an adherent plaque containing the cancer cells is created.
Seal the shell window again with a semipermeable adhesive film.
4. Imaging and Harvesting of the CAM
Duration: 2 hr for 25 eggs.
On chick embryonic development day 16, the CAMs are harvested. Working under laminar airflow is not necessary.
Enlarge the window with a pair of surgical scissors. Make sure not to cut too low, otherwise the CAM will be damaged, resulting in bleeding of the injured vessels.
Add 300 - 500 μl of PBSD with a pipette onto the CAM section containing the inoculated material. If no fluorescent probes are used, buffered formaldehyde may be used as this makes the membrane stiffer, facilitating the cutting of the membrane.
Make a photograph of the CAM in the egg through a stereo fluorescence microscope, equipped with a digital color camera, using both the GFP or the DSR filter, and no filter. For the tumor grafts, all photographs are made without filters. Illumination from above by LED lights is strongly recommended during photographing (Figure 2).
Record tumor cell migration for the labeled cells. The borders of the tumors may be irregular and frayed. Scattered cells may be present near the tumor borders. In some specimens, rows of tumor cells may be observed (Figure 3).
Cut the membrane with a pair of sterile scissors at the border lying against the shell.
Place the harvested CAM in a sterile Petri dish filled with PBSD or buffered formaldehyde.
Make a photograph of both the upper side and the lower side of the CAM, both with and without filter.
Put the membrane in a labeled container with buffered formaldehyde for at least 72 hr.
Embed the CAMs in paraffin and prepare them for histological examination. Take care to cut the tumor grafts at the center of the nodule, making sure the cut surface is parallel to the bottom of the cassette. If not, the interaction between the CAM and the tumor graft will not be visible. The same strategy applies to the ECM gel plaques: the surface facing the cutting blade should be perpendicular to the plaque.
5. Histological Evaluation
Hematoxylin-Eosin staining and Ki-67 immunohistochemistry were performed for further clarification, if needed. Immunohistochemistry was performed on formalin-fixed paraffin-embedded tissue sections of 3.5 μm in thickness, using an automated slide stainer according to manufacturer's instructions. A mouse primary monoclonal antibody to Ki-67 (clone MIB-1, dilution 1/100) was used. Heat-induced epitope retrieval was performed using Cell Conditioning 1, and visualization was achieved with the Universal DAB Detection Kit, according to manufacturer's instructions. Dehydratation of the tissue sections was carried out using an automated coverslipper.
For the SAOS2 and the SW1353 cell lines, the number of Ki67-positive and Ki67-negative cell nuclei/100 μm2 were counted in three zones: one close to the border of the CAM, one close the surface and one in the center of the ECM gel plaque. This procedure was repeated 6x for each Ki-67 stained slide. The index of proliferation was determined for each slide by dividing the number of Ki67-positive cells by the total number of cells counted.
Necrosis is defined by a loss of fine dispersion of chromatin in the cell nucleus, accompanied by fading of distinct cell margins. For xenografts, necrosis is scored as complete, partial (often at the surface), or absent. Infiltration of tumor cells into the CAM is defined by the observation of tumor cells within the mesoderm of the CAM, and is scored as being present or absent.
Three items are scored for host behavior. Fibroblast infiltration is defined as elongated cells leaving the CAM and invading the tumor graft/plaque, and is scored as being present or absent. Vascular ingrowth can be observed as ingrowth of proliferating chick vessels, characterized by the presence of nucleated chick erythrocytes.
Representative Results
Evaluation of the CAM
Tumor grafts become adherent to the CAM (Figure 2A). Single cell suspensions from patient material frequently display a dried, slightly raised plaque (Figure 2D). After excision of the CAM, marked wrinkling of the membrane occurs (Figures 2E and 2F).
For the commercial cell lines the plaque becomes more opaque in time, indicating cell proliferation. Different cell lines in ECM gel have a distinct growth pattern on the CAM. SAOS2 forms a spreading plaque, with a distinct increase of the surface from day 7 after inoculation, while the GFP signal remains strong, indicating viable cells. Migration of SAOS2 cells can be visualized parallel to the vessels of the CAM (Figure 3). When observed through the stereomicroscope, blood vessels can be seen when no filter is used. Tumor cells cannot be discerned when no filter is used. It is not possible to visualize the blood vessels when a GFP filter is inserted. By turning the filter on and off, the close contact between the migrating cells and the blood vessels can be seen. Punctiform bleeding can be observed through the plaque (Figure 4,rows 1 and 2). The plaques containing SW1353 cells show a decrease in surface and tend to contract the CAM, resulting in a wrinkled membrane after harvesting it (Figure 4, rows 5 and 6). The DSR signal decreases as the fluorescent probe becomes diluted after many cell divisions. From day 7, bleeding is frequently observed. If bleeding occurs, the DSR signal also decreases.
Vascular reaction can be visualized after excision of the CAM at the lower view, showing tortuous vessels surrounding the graft or plaque (Figure 2). Vascular reaction of the CAM is observed in the tumorgraft group, the single cell suspension group (Figure 2C and 2F) and the ECM gel control group (Figure 2G), but not in cell solution control groups (Figure 2H). New tortuous vessels can be observed entering the sample, branching (Figure 2I, arrowheads) and anastomosing (Figure 2I,asterisks) with one another; also small areas of bleeding occur (Figure 2I, arrows). Neovascularization of the tumor can be quantified on H&E slides in the different zones of the tumor/tumor plaque.
Histological evidence shows that SAOS2 cells maintain a single cell appearance throughout the complete volume of ECM gel, causing an increased thickness and diameter of the plaque. They invade the mesodermal layer of the CAM (Figure 5A, arrow), thereby enlarging the distance between the endodermal and the ectodermal layers of the CAM like an opening zipper (Figure 5A, double arrow).The growth pattern of SW1353 cells and of a single cell suspension of a patient's chondrosarcoma is more clustered, with islands of cells in an expanse of ECM gel (Figure 5B, arrow). The number of cells and cell clusters increase steadily in time, and the number of non-proliferative cells increases from day 7, especially at the surface of the plaque. For SW1353, the contraction of the CAM can also be appreciated on the H&E slides when compared to the H&E slides of SAOS2.
Notwithstanding their ectopic site of growth, we found that essential features and immunohistochemical characteristics of the original sarcoma tumors were maintained in the CAM. In addition the tumor grafts become revascularized as evidenced by the appearance of nucleated chick erythrocytes, the tumor grafts become infiltrated by chick fibroblasts and tumor cells from the graft infiltrated the CAM host tissue, illustrating the reliability and robustness of the CAM assay (Figure 6, inset lower left). For further detailed information we refer to Sys et al.14.
Time of harvest
Cell counting of Ki67-positive and Ki67-negative cells shows a steady increase in the total number of cells from day 4 for both cell lines. After this day the total number of cells remains stable. Seven days after inoculation, the number of Ki67-positive cells and the total number of cells starts to decline. Concerning the number of cells, there is a significant correlation between the three zones. However, a larger proportion of Ki67-positive cells close to the CAM, and a larger proportion of Ki67-negative cells at the surface of the plaque are observed (Figure 4, rows 3, 4, 7 and 8).
The index of proliferation remains relatively stable until seven days after inoculation, whereafter it also starts to decline. The proliferation index of the SW1353 cell line is significantly lower (P < 0.05) when compared to the SAOS2 cell line.
Although there is a significant correlation between the three zones, it is essential to count fields in all three regions in the ECM gel plaque, as we observe a larger proportion of Ki67-positive cells close to the CAM and a larger proportion of Ki67-negative cells at the surface of the plaque (Figure 7).
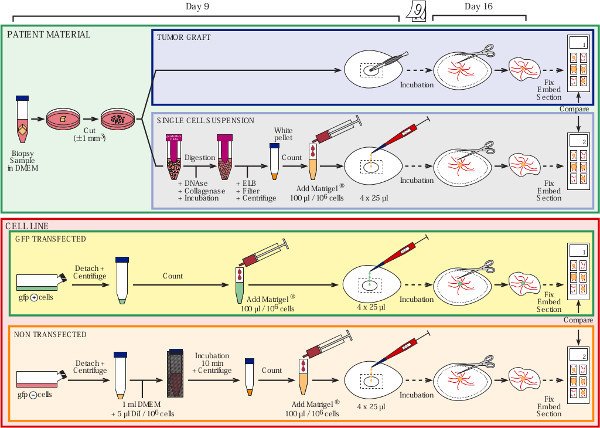 Figure 1. Overview of the protocol. Click here to view larger figure.
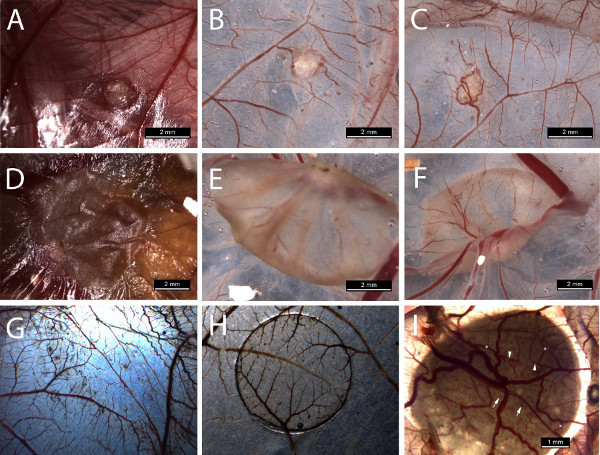 Figure 2. Photographs taken during harvest. Upper row concerns harvesting of a tumorgraft from a chondrosarcoma: A = in situ, B = upper view in Petri dish, C = lower view in Petri dish. Middle row concerns harvesting of a single cell suspension in ECM gel: D = in situ, E = upper view in Petri dish, F = lower view. Lower row G = matrigel control, H = cell solution control, I = lower view displaying branching vessels and bleeding. Click here to view larger figure.
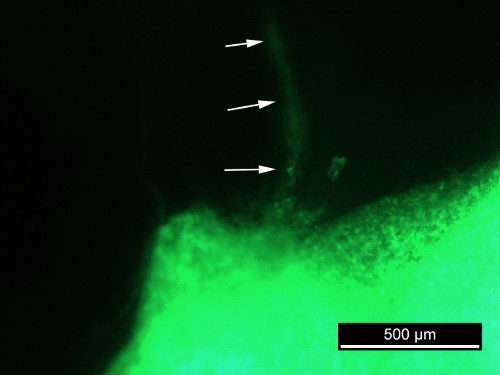 Figure 3. GFP photograph of SAOS2 in situ.
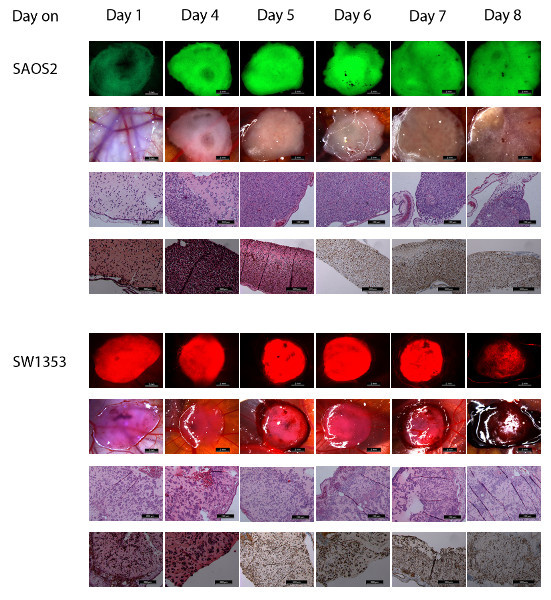 Figure 4. This figure shows photographs of both SAOS2 (upper 4 rows) and SW1353 (lower 4 rows) at day 1 to 8 after inoculation.Row 1 (scale bar 2 mm) shows the photographs of the CAM in situ through a stereomicroscope with GFP filter. Row 2 (scale bar 2 mm) shows the same samples through the stereomicroscope while illuminated by LEDs from above. Row 3 and 4 show the H&E (row 3, scale bar 200 μm) and Ki67-stained (row 4, scale bar 200 or 500 μm) histological images from the same samples. Row 5 (scale bar 2 mm) shows the photographs of the CAM in situ through a stereomicroscope with DSR filter. Row 6 (scale bar 2 mm) shows the same samples through the stereomicroscope while illuminated by LEDs from above. Row 7 and 8 show the H&E (row 7, scale bar 200 μm) and Ki67-stained (row 8, scale bar 200 and 500 μm) histological images from the same samples. Click here to view larger figure.
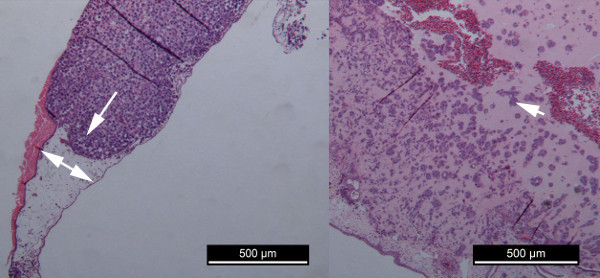 Figure 5. Comparison of tumor cell proliferation of SAOS2 and SW1353.A = growth of SAOS2 B = growth of SW1353.
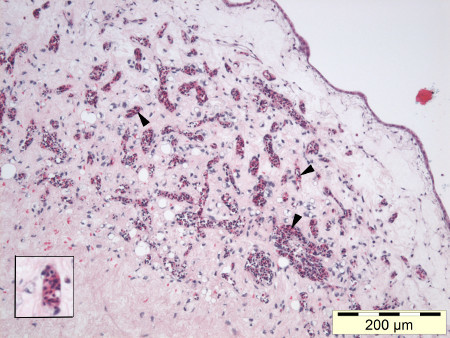 Figure 6. Nucleated chick erythrocytes can be observed in the capillaries throughout a high grade liposarcoma tumorgraft (HE, 100X), inset lower left.
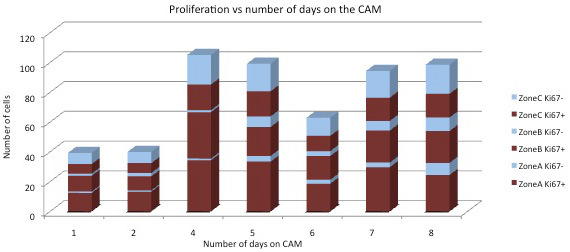 Figure 7. Graph showing Ki67+ and Ki67- cells over time according to the distance from the CAM for both cell lines.Zone A = against the CAM, zone C = surface of the plaque, zone B = in-between zone A and C.
Discussion
Time of inoculation and harvest
Timing the day of inoculation was performed using SAOS2 in ECM gel (36 CAMs) and varied between embryonic development day 5 and 10.
Before incubation day 9, the CAM was not consistently large enough to support the ECM gel we applied. At harvest, tumor cells sometimes had to be retrieved from the deeper CAM, and some ECM gel samples were lying loose in the albumen or on the CAM. On days 5 and 6, it was hard to avoid putting the tumor cells on the chick embryo, resulting in chick malformations or death. From day 9, the CAM was completely covering the surface below the window in most eggs, and ECM gel plaques proved adherent to the CAM at the moment of harvest. Therefore, we found the ideal time for inoculation to be day 9 of embryonic development.
For the determination of the ideal time of harvesting, SAOS2 and SW1353 were harvested after respectively 1, 2 (SAOS2-GFP only), 4, 5, 6, 7 and 8 days post-inoculation, or between embryonic development day 10 and 17. Following these variations, a difference in length of application on the CAM was noted from 1 - 12 days.
Knighton published marked differences in tumor growth and tumor revascularization according to the embryonic development day at the moment of tumor sample application17. Cell counting of Ki67-positive and Ki67-negative cells showed a steady increase in the total number of cells from day 4 for both cell lines. This is concordant with the finding of Ausprunk et al.21, who stated that the period needed for revascularisation takes 72 hr. After counting the number of cells and calculation of the index of proliferation, we can assume that the cells dispersed in the ECM gel are actively proliferating from day 4 until day 6 after inoculation. Based on the diameter of the plaque, the total number of cells and the index of proliferation, we suggest that the ideal time for harvest is day 16 of embryonic development, or seven days after inoculation.
The suggested time frame leaves researchers a window of six days for the application of agents while the cells are actively proliferating, either once on day 4 after inoculation or daily during the whole time frame. For topical administration, the compound is applied on the CAM surface. This route is the most commonly used one, owing to the accessibility to the CAM by simply opening the eggshell/adhesive film22,23. Although IV administration is feasible, the difficulty to insert needles into the CAM vessels is a critical limitation. Kinase inhibitors are applied on a daily basis24; chemotherapy once during the experiment. We hypothesize that adding a compound once is the equivalent of the clinical treatment with cytotoxic of cytostatic agents, which are classically administered once every 3 weeks, while adding the compound on a daily basis will reflect the daily dose of kinase inhibitors in the clinical setting. However, we must keep in mind that topical administration will show different kinetics/metabolism compared with oral or IV administration in patients.
Significance of the technique and possible future applications
Preservation of cell morphology is of prime importance when cell cultures are used in preclinical models. The use of homogeneous extracellular matrices such as collagen type I25 or ECM gel26 restores the tumor cell environment, allowing a more natural growth pattern.
Contrary to in vivo assays, in vitro assays do not contain stromal cells such as angiogenic vascular cells, infiltrating immune cells or cancer-associated fibroblastic cells necessary to reconstitute the tumorigenic microenvironment27. When the CAM-assay is used for the evaluation of tumorgrafts, we have described a typical 'invasion cone' from the CAM towards the tumorgrafts, reflecting the recruitment of stromal cells from the chick by the tumorgraft14.
The CAM-assay provides a combination of restoring the extracellular matrix by ECM gel and providing host cells for the reconstitution of the tumorigenic microenvironment. As the CAM and the tumorgraft/plaque are readily accessible, the administration of compounds is easy. In this way, the CAM-assay opens new perspectives towards the preclinical evaluation of rare tumor types such as sarcomas.
Disclosures
Authors have nothing to disclose.
Acknowledgments
Cells from the SW1353 chondrosarcoma cell line were kindly provided by Prof. Dr. P.C.W. Hogendoorn and Prof. Dr. J. Bovée of Leiden University, The Netherlands. We thank J. Mestach and G. Wagemans for excellent technical assistance, and G. De Bruyne for the professional drawing of the overview of our protocol.
References
- Mankin HJ, Hornicek FI, Rosenberg AE, Harmon DC, Gebhardt MC. Survival data for 648 patients with osteosarcoma treated at one institution. Clinical Orthopaedics and Related Research. 2004;429:286–291. doi: 10.1097/01.blo.0000145991.65770.e6. [DOI] [PubMed] [Google Scholar]
- Hoffmann J, Schmidt-Peter P, et al. Anticancer drug sensitivity and expression of multidrug resistance markers in early passage human sarcomas. Clinical Cancer Research. 1999;5:2198–2204. [PubMed] [Google Scholar]
- Greenlee RT, Hill-Harmon MB, Murray T, Thun M. Cancer statistics, 2001. CA A Cancer Journal for Clinicians. 2001;51:15–36. doi: 10.3322/canjclin.51.1.15. [DOI] [PubMed] [Google Scholar]
- Gil-Benso R, Lopez-Gines C, et al. Establishment and characterisation of a continuous human chondrosarcoma cell line, ch-2879: Comparative histologic and genetic studies with its tumor of origin. Laboratory Investigations. 2003;83:877–887. doi: 10.1097/01.lab.0000073131.34648.ea. [DOI] [PubMed] [Google Scholar]
- Taylor BS, Barretina J, et al. Advances in sarcoma genomics and new therpeutic targets. Nature Reviews Cancer. 2011;11:541–557. doi: 10.1038/nrc3087. [DOI] [PMC free article] [PubMed] [Google Scholar]
- Skubitz KM, D'Adamo DR. Sarcoma. Mayo Clinic Proceedings. 2007;82:1409–1432. doi: 10.4065/82.11.1409. [DOI] [PubMed] [Google Scholar]
- Nielsen TO, West RB. Translating gene expression into clinical cara: sarcomas as a paradigm. Journal of Clinical Oncology. 2010;28:1796–1805. doi: 10.1200/JCO.2009.26.1917. [DOI] [PubMed] [Google Scholar]
- Vaira V, Fedele G, Pyne S. Preclinical model of organotypic culture for pharmacodynamic profiling of human tumors. Proceedings of the National Academy of Science USA. 2010;107:8352–8356. doi: 10.1073/pnas.0907676107. [DOI] [PMC free article] [PubMed] [Google Scholar]
- DeRose YS, Wang G, et al. Tumor grafts derived from women with breast cancer authentically reflect tumor pathology, growth, metastasis and disease outcomes. Nature Medicine. 2011;17:1514–1520. doi: 10.1038/nm.2454. [DOI] [PMC free article] [PubMed] [Google Scholar]
- Tentler JJ, Tan AC, et al. Patient-derived tumour xenografts as models for oncology drug development. Nature Reviews Clinical Oncology. 2012;9:338–350. doi: 10.1038/nrclinonc.2012.61. [DOI] [PMC free article] [PubMed] [Google Scholar]
- Bertotti A, Migliardi G, et al. A molecularly annotated platform of patient-derived xenografts ("xenopatients") identifies HER2 as an effective therapeutic target in cetuximab-resistant colorectal cancer. Cancer Discovery. 2011;1:508–523. doi: 10.1158/2159-8290.CD-11-0109. [DOI] [PubMed] [Google Scholar]
- Decaudin D. Primary human tumor xenografted models ('tumorgrafts') for good management of patients with cancer. Anticancer Drugs. 2011;22:827–841. doi: 10.1097/CAD.0b013e3283475f70. [DOI] [PubMed] [Google Scholar]
- Hanahan D, Weinberg RA. Hallmarks of cancer: The next generation. Cell. 2011;144:646–674. doi: 10.1016/j.cell.2011.02.013. [DOI] [PubMed] [Google Scholar]
- Sys G, Van Bockstal M, et al. Tumor grafts derived from sarcoma patients tumor morphology, viability, and invasion potential and indicate disease outcomes in the chick chorioallantoic membrane model. Cancer Letters. 2012;326:69–78. doi: 10.1016/j.canlet.2012.07.023. [DOI] [PubMed] [Google Scholar]
- Armstrong PB, Quigley JP, Sidebottom E. Transepithelial invasion and intramesenchymal infiltration of the chick embryo chorioallantois by tumor cell lines. Cancer Research. 1982;42:1826–1837. [PubMed] [Google Scholar]
- Deryugina E, Quigly J. Chick embryo chorioallantoic membrane model systems to study and visualize human tumor cell metastasis. Histochemistry and Cell Biology. 2008;130:1119–1130. doi: 10.1007/s00418-008-0536-2. [DOI] [PMC free article] [PubMed] [Google Scholar]
- Knighton D, Ausprunk D, Tapper D, Folkman J. Avascular and vascular phases of tumor growth in the chick embryo. British Journal of Cancer. 1977;35:347–356. doi: 10.1038/bjc.1977.49. [DOI] [PMC free article] [PubMed] [Google Scholar]
- Dohle DS, Pasa SD, Gustmann S, Laub M, Wissler JH, Jennissen HP, Dünker N. Chick ex ovo culture and ex ovo CAM assay: how it really works. J. Vis. Exp. 2009. p. e1620. [DOI] [PMC free article] [PubMed]
- Balke M, Neumann A, et al. Morphologic characterization of osteosarcoma growth on the chick chorioallantoic membrane. BMC Research Notes. 2010;3:58. doi: 10.1186/1756-0500-3-58. [DOI] [PMC free article] [PubMed] [Google Scholar]
- Hendrix A, Maynard D, et al. Effect of the secretory small GTPase Rab27B on breast cancer growth, invasion, and metastasis. Journal of the National Cancer Institute. 2010;102:866–880. doi: 10.1093/jnci/djq153. [DOI] [PMC free article] [PubMed] [Google Scholar]
- Ausprunk D, Knighton D, Folkman J. Vascularization of normal and neoplastic tissues grafted to the chick chorioallantois: role of host and preexisting graft vessels. American Journal of Pathology. 1975;79:597–618. [PMC free article] [PubMed] [Google Scholar]
- Lokman NA, Elder ASF, Riciardelli C, Oehler MK. Chick Chorioallantoic membrane (CAM) Assay as an in vivo model to study the effect of newly identified molecules on ovarian cancer invasion and metastasis. International Journal of Molecular Sciences. 2012;13:9959–9970. doi: 10.3390/ijms13089959. [DOI] [PMC free article] [PubMed] [Google Scholar]
- Vargas A, Zeisser-Labouèbe M, Lange N, Gurny R, Delie F. The chick embryo and its chorioallantoic membrane (CAM) for the in vivo evaluation of drug delivery systems. Advanced Drug Delivery Reviews. 2007;59:1162–1176. doi: 10.1016/j.addr.2007.04.019. [DOI] [PubMed] [Google Scholar]
- Hagedorn M, Javerzat S, et al. Accessing key steps of human tumor progression in vivo by using an avian embryo model. Proceedings of the National Academy of Sciences U.S.A. 2005;102:1643–1648. doi: 10.1073/pnas.0408622102. [DOI] [PMC free article] [PubMed] [Google Scholar]
- De Wever O, Hendrix A, et al. Modeling and quantification of cancer cell invasion through collagen type I matrices. International Journal of Developmental Biology. 2010;54:887–896. doi: 10.1387/ijdb.092948ow. [DOI] [PubMed] [Google Scholar]
- Albini A, Benelli R. The chemoinvasion assay: A method to assess tumor and endothelial cell invasion and its modulation. Nature Protocols. 2007;2:504–511. doi: 10.1038/nprot.2006.466. [DOI] [PubMed] [Google Scholar]
- Hanahan D, Coussens L. Accessories to the crime: functions of cells recruited to the tumor microenvironment. Cancer Cell. 2012;21:309–322. doi: 10.1016/j.ccr.2012.02.022. [DOI] [PubMed] [Google Scholar]


