Abstract
Clinical phenotyping is an emerging research information systems capability. Research uses of electronic health record (EHR) data may require the ability to identify clinical co-morbidities and complications. Such phenotypes may not be represented directly as discrete data elements, but rather as frequency, sequential and temporal patterns in billing and clinical data. These patterns’ complexity suggests the need for a robust yet flexible extract, transform and load (ETL) process that can compute them. This capability should be accessible to investigators with limited ability to engage an IT department in data management. We have developed such a system, Eureka! Clinical Analytics. It extracts data from an Excel spreadsheet, computes a broad set of phenotypes of common interest, and loads both raw and computed data into an i2b2 project. A web-based user interface allows executing and monitoring ETL processes. Eureka! is deployed at our institution and is available for deployment in the cloud.
Background
Clinical data warehouses 1 support computing derived measures from EHR data using business intelligence tools. 2 These tools primarily leverage billing codes with standard representations. These standards have enabled use of data warehouses in epidemiology. 3 Clinical phenotyping aims to leverage systematically clinical in addition to billing data from EHRs in research. 4 Phenotyping employs categorizing billing codes, classifying numerical test results, computing frequency, sequential and other temporal patterns, and leveraging alternative data types depending on availability. 5 Phenotyping requires a comprehensive EHR with broad coverage of clinical observations and events, a requirement that is increasingly satisfied by current EHR deployments. 6
IT departments may provide EHR data access for research studies often by delivering data from their data warehouse to investigators in spreadsheets or flat files. At our institution, there has been an unmet need to provide tools for loading such data into project-specific data marts and performing clinical phenotyping. Our CTSA program addressed this need by implementing a locally developed ETL process 7 for creating i2b2 1 data marts. 8 This system extends temporal abstraction 9 software, PROTEMPA, 10 , 11 to support specifying phenotypes as the categories, classifications and patterns above. Data modelers maintain a library of phenotypes representing co-morbidities and hospital quality improvement patient characteristics that are specified in a temporal abstraction ontology 9 , 11 and are computed by the ETL system. Due to this and the complexity of accessing data warehouses that also are leveraged for hospital operations, our solution requires substantial IT and informatics support to maintain.
There remain many investigators who lack substantial IT and informatics support whose research would be accelerated by access to data marts containing phenotyped EHR and other data. To support them, we are developing user interfaces for loading data in Excel spreadsheets into i2b2 with our ETL system. Version 1.0 of this system, called Eureka! Clinical Analytics, was recently released. We anticipate continuing to provide a set of curated phenotypes while ultimately enabling investigators to define additional phenotypes that are specific to their research.
Methods
Eureka! Clinical Analytics is a web application. Users have an account that is associated with a user-specific i2b2 project. Users may upload spreadsheets containing data into their project. The project allows querying a pre-defined set of source data and derived phenotypes, and retrieving patient sets meeting specified criteria.
Supported data model
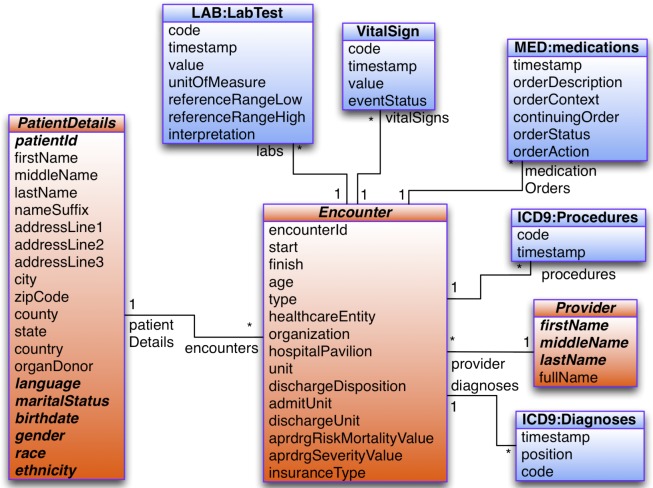
The i2b2 loader assumes a data model with a central visit (encounter) table to which all other data (patient, provider and observations) are associated. The model, an example of which is shown in Figure 1 , is represented in a frames ontology in Protégé ( http://protege.stanford.edu ) that models a subset of UML (entities, attributes and associations). An XML configuration file specifies which entities in the model correspond to i2b2’s dimensions. In Figure 1 , the PatientDetails entity corresponds to the patient dimension, Encounter corresponds to the visit dimension, and Provider corresponds to the provider dimension. The configuration file also specifies associations from the visit entity to various observation facts (e.g., vital signs, medication orders, procedures). Such a model allows associating every observation fact with i2b2’s dimensions. The configuration file additionally specifies the attributes of dimension entities that will populate the columns of i2b2’s dimension tables.
Figure 1.
UML diagram of the data model used by Eureka! Red entities correspond to i2b2 dimensions, and blue entities correspond to i2b2 observation facts.
Spreadsheet syntax and semantics
An Excel spreadsheet template mirrors the structure and semantics of the data model. It contains a tab for each of the model’s entities. An example with fake data is shown in Figure 2 . The Encounter tab contains “foreign keys” to join to patient and provider records in the Patient and Provider tabs. Tabs prefixed by “e” represent observation facts, with each record having an encounter foreign key. Attribute values of an entity are represented as columns in the entity’s tab. Column values may be numerical, string or enumerated. Tabs prefixed with “metadata” document the allowed values for enumerated attributes.
Figure 2.

Screenshot of a sample data spreadsheet suitable for upload.
Clinical phenotype specification
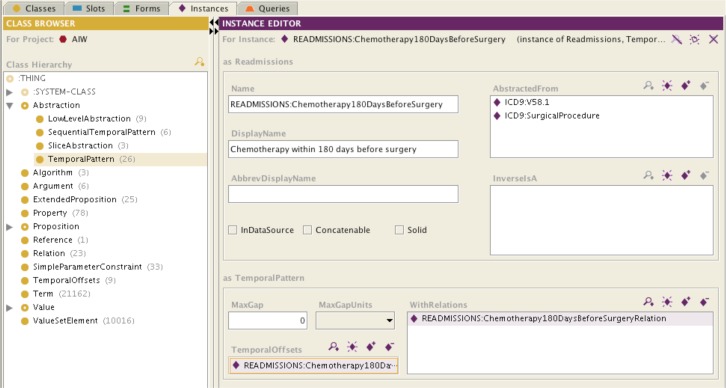
Phenotypes are specified in a centrally managed temporal abstraction ontology that is stored and edited using Protégé. See Figure 3 for an example. The ontology represents raw data definitions from the data model and four kinds of derived data definitions that together enable specifying phenotypes. Low-level abstraction definitions allow specifying thresholds on numerical data values or on the slope of sequential values. Temporal patterns allow specifying temporal relationships between raw data values and derived data such as within 6 months before , between 1 day and 1 month apart , and at the same time as . Sequential temporal patterns restrict relationship finding to sequential values, such as two sequential encounters that do not overlap and are within 30 days of each other . The Slice abstraction allows specifying the first, second, etc. interval of a raw or derived data value, such as the second elevated systolic blood pressure value . Finally, the ontology allows specifying hierarchies of raw and derived variables that may be leveraged in specifying phenotypes, such as groupings of ICD-9 codes reflecting diabetes or a class of medications reflecting treatment for hypertension. These derived and raw data definitions form nodes in a graph connected by hierarchical and temporal relationships.
Figure 3.
Screenshot of the temporal abstraction ontology in Protégé, showing the Chemotherapy 180 days before surgery temporal pattern abstraction.
Figure 3 shows the Chemotherapy 180 days before surgery temporal pattern abstraction. The AbstractedFrom slot shows that the abstraction is composed of the V58.1 ICD-9 code group and the SurgicalProcedure category of ICD-9 codes (contains all surgical procedure codes). The WithRelations slot specifies the temporal constraint between the procedure and chemotherapy encounter codes. The TemporalOffset slot specifies, together with the MaxGap , Concatenable and Solid slots, that intervals created by this abstraction should have the same temporal extent as the surgical procedure from which they are derived. The InDataSource slot is unchecked to indicate not to search for this data element in the spreadsheet (because it is computed). The ICD9:V58.1 and ICD9:SurgicalProcedure categories are specified by populating the ontology’s InverseIsA slot with lists of ICD9 codes or categories of codes.
User Workflow
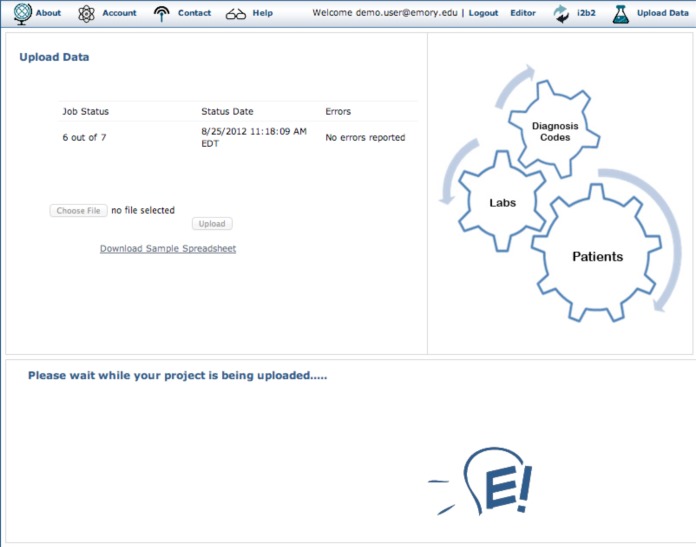
Users download a sample spreadsheet ( Figure 2 ) from the data upload page, shown in Figure 4 , and replace the data with their own. After uploading a spreadsheet, a validation step checks for proper structure and provides useful error messages. The data in the spreadsheet is loaded into a temporary database (Oracle 11g XE or Enterprise), after which the ETL process extracts the data specified in the XML configuration file and computes the specified phenotypes one patient at a time. Data and phenotypes are streamed into the fact and dimension tables of the current user’s i2b2 project. The i2b2 concept hierarchy is loaded into the user’s metadata tables as a list of hierarchies from the temporal abstraction ontology that is specified in the XML file above. Users click a link in the upper right hand corner of the Eureka! interface ( Figure 4 ) to access their i2b2 instance. Details of the ETL processing are described in an earlier paper. 8
Figure 4.
Data upload page in Eureka! showing a spreadsheet being uploaded.
Results
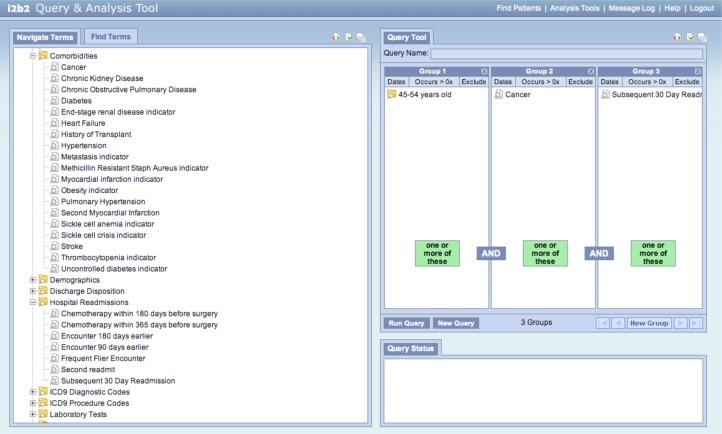
Eureka! is implemented in Java and may be deployed in either the Tomcat ( http://tomcat.apache.org ) or Glassfish ( http://glassfish.java.net ) container environment. We support i2b2 version 1.5. An example of a resulting i2b2 instance is shown in Figure 5 . The Comorbidities folder in the term browser on the left of the screen shows derived variables for a variety of diseases inferred from groups of diagnosis codes, thresholds in laboratory test results, procedure codes, and/or orders for classes of medications. Similarly, the Hospital Readmissions folder shows phenotypes computed as temporal patterns in raw and/or other derived data, such as the Chemotherapy within 180 days before surgery abstraction shown in Figure 3 . The i2b2 interface shows these phenotypes as i2b2 concepts in a flat hierarchy, thus hiding their relationships to each other and raw data for ease of use (see Discussion). These derived concepts may be dragged into the i2b2 query tool on the right of the screen along with concepts representing raw data. The query in Figure 5 is for 45–54 years old with Cancer and a hospital readmission within 30 days (the Subsequent 30 Day Readmission derived concept).
Figure 5.
The i2b2 web client, showing concepts from standard terminologies for raw data, and derived phenotypes for co-morbidities and hospital readmissions.
The software is available as open source under the Apache 2 license from http://aiw.sourceforge.net . It also is available in demonstration form at http://eureka.cci.emory.edu and as an Amazon EC2 virtual machine (Amazon Machine Image name EurekaCVRG ). Its central ontology comes with a curated set of 193 derived variables, and billing code, laboratory, vital sign and medication hierarchies. Included derived variables not shown in Figure 5 include cancer diagnoses and hypertension treatments defined in terms of billing codes and medication dispenses. The software processes and loads the provided sample spreadsheet (contains 2,555 synthetically generated encounters on 512 patients with clinical and billing data) into i2b2 in 3 minutes. We do not support modifying the ontology currently, with such support to be added in a future release.
Discussion
Eureka! fills an unmet need in research for robust but economical data management that may be configured by technologically savvy investigators. Data marts traditionally require IT and/or informatics support to create and maintain. While Eureka! does not eliminate that need, it amortizes the support requirements across multiple data marts and investigators. A centrally managed ontology of clinical phenotypes allows all investigators to leverage such phenotypes. We plan to add to Eureka! a capability for users to create custom phenotypes specific to them or their research. Deployment as an institutionally hosted service or in the Amazon EC2 cloud requires little setup by the individual researcher. Investigators generally are familiar with Excel. I2b2’s web client interface appears easy for investigators to use. Through funding from the CardioVascular Research Grid ( http://www.cvrgrid.org ), we aim for Eureka! to become a part of a cloud-based ecosystem for data management and analysis. Major EHR vendors (e.g., Cerner) are providing cloud-based deployment, and cloud solutions like Amazon EC2 provide HIPAA-compliant storage, thus we expect cloud-based research data management to be similarly attractive.
The Eureka! software allows use of clinical phenotypes in i2b2 without any source code changes to i2b2. The phenotypes are computed entirely during ETL and are loaded into i2b2 as concepts in its metadata and concept dimension tables. They may be used in queries like any other concept. A limitation of this approach is that the underlying definitions of the phenotypes are not accessible through the i2b2 web client. An analysis tool plugin could potentially access the Protégé ontology and present phenotype definitions within the web client. The i2b2 concept tool tips could potentially be populated with brief textual summaries about a phenotype during ETL. Ideally, the web client’s term hierarchy would support hyperlinking to more detailed information about a selected concept.
Implementation challenges arose during this project. I2b2’s term hierarchy does not allow multiple inheritance, but the temporal abstraction ontology does. An ICD-9 code, for example, may be in multiple categorical phenotypes in addition to the category to which it is assigned in ICD-9. To workaround this issue, the specification of the term hierarchy’s contents in the XML configuration file allows specifying an order to when sub-trees of concepts from the temporal abstraction ontology are loaded into i2b2. Standard terminologies like ICD-9 are loaded first, and phenotypes are loaded after. Categorical phenotype concepts with children that have already been added because they are in a standard terminology’s hierarchy appear as leaves in the user interface. Categorical phenotype concepts whose children are solely other derived concepts that have yet to be loaded appear as folders. Temporal pattern and numerical classification concepts appear as leaves because they have no hierarchical relationship with the data from which they are derived. Figure 5 demonstrates this strategy. The Cancer concept has ICD-9 codes as children, thus it appears as a leaf. Subsequent 30 Day Readmission is a temporal pattern, thus it appears as a leaf. We believe that this strategy yields an intuitive appearance for clinical phenotypes in the term hierarchy.
While this paper has focused on spreadsheet upload with Eureka!, the backend software also allows specifying source-to-target mappings to institutional databases for data retrieval. This capability supports i2b2 data marts at our institution used by research groups in cardiovascular disease, 8 lung cancer and lymphoma/leukemia. The software also is deployed at Kaiser Permanente Southeast for the Minority Health Grid study of the genetics of hypertension.
Conclusion
We have demonstrated the feasibility of loading clinical phenotypes reflected by complex patterns in EHR data into i2b2, thus enabling the use of such phenotypes in i2b2 web client queries. Our spreadsheet-based data upload approach may enable i2b2 to be leveraged by a broader constituency of investigators who lack an IT team to manage i2b2 and ETL from source systems. Usability evaluation of our approach and implementation is warranted.
Acknowledgments
This work was supported in part by PHS Grant UL1 RR025008, KL2 RR025009 and TL1 RR025010 from the CTSA program, NIH, NCRR; NHLBI grant R24 HL085343; NIH/ARRA grant 325011.300001.80022; and M01 RR-00039 from the GCRC program, NIH, NCRR.
References
- 1. Murphy SN , Weber G , Mendis M , Gainer V , Chueh HC , Churchill S , et al. Serving the enterprise and beyond with informatics for integrating biology and the bedside (i2b2) . J Am Med Inform Assoc . 2010 ; 17 ( 2 ): 124 – 30 . doi: 10.1136/jamia.2009.000893. [DOI] [PMC free article] [PubMed] [Google Scholar]
- 2. Ferranti JM , Langman MK , Tanaka D , McCall J , Ahmad A . Bridging the gap: leveraging business intelligence tools in support of patient safety and financial effectiveness . J Am Med Inform Assoc . 2010 ; 17 ( 2 ): 136 – 43 . doi: 10.1136/jamia.2009.002220. [DOI] [PMC free article] [PubMed] [Google Scholar]
- 3. Zekry D , Loures Valle BH , Graf C , Michel JP , Gold G , Krause KH , et al. Prospective comparison of 6 comorbidity indices as predictors of 1-year post-hospital discharge institutionalization, readmission, and mortality in elderly individuals . J Am Med Dir Assoc . 2012 ; 13 ( 3 ): 272 – 8 . doi: 10.1016/j.jamda.2010.11.011. [DOI] [PubMed] [Google Scholar]
- 4. Freimer N , Sabatti C . The human phenome project . Nat Genet . 2003 ; 34 ( 1 ): 15 – 21 . doi: 10.1038/ng0503-15. [DOI] [PubMed] [Google Scholar]
- 5. Conway M , Berg RL , Carrell D , Denny JC , Kho AN , Kullo IJ , et al. Analyzing the heterogeneity and complexity of Electronic Health Record oriented phenotyping algorithms . AMIA Annu Symp Proc . 2011 : 274 – 83 . [PMC free article] [PubMed] [Google Scholar]
- 6. Jha AK , DesRoches CM , Campbell EG , Donelan K , Rao SR , Ferris TG , et al. Use of Electronic Health Records in U.S. Hospitals . N Engl J Med . 2009 ; 360 ( 16 ): 1628 – 38 . doi: 10.1056/NEJMsa0900592. [DOI] [PubMed] [Google Scholar]
- 7. Kimball R , Ross M . The Data Warehouse Toolkit: The Complete Guide to Dimensional Modeling . 2nd ed . New York : Wiley Computer Publishing ; 2002 . [Google Scholar]
- 8. Post A , Kurc T , Overcash M , Cantrell D , Morris T , Eckerson K , et al. A Temporal Abstraction-based Extract, Transform Load Process for Creating Registry Databases for Research . AMIA Summits Transl Sci Proc . 2011 : 46 – 50 . [PMC free article] [PubMed] [Google Scholar]
- 9. Shahar Y . A framework for knowledge-based temporal abstraction . Artif Intell . 1997 ; 90 : 79 – 133 . doi: 10.1016/0933-3657(95)00036-4. [DOI] [PubMed] [Google Scholar]
- 10. Post AR , Harrison JH ., Jr PROTEMPA: A Method for Specifying and Identifying Temporal Sequences in Retrospective Data for Patient Selection . J Am Med Inform Assoc . 2007 ; 14 : 674 – 83 . doi: 10.1197/jamia.M2275. [DOI] [PMC free article] [PubMed] [Google Scholar]
- 11. Post AR , Sovarel AN , Harrison JH . Abstraction-based temporal data retrieval for a Clinical Data Repository . AMIA Annu Symp Proc . 2007 : 603 – 7 . [PMC free article] [PubMed] [Google Scholar]


