Abstract
Purpose: This article describes preparation and characterization of beads of alginate containing probiotic bacteria of Lactobacillus acidophilus DMSZ20079. Methods: Fourteen formulations using different alginate (ALG) and CaCl2 concentrations as well as hardening times were prepared using extrusion technique. The prepared beads were characterized in terms of size, morphology, encapsulation efficiency and bacterial viabilities in acid (pH 1.8, 2 hours) condition. Results: The results showed that spherical beads with narrow size distribution ranging from 1.32±0.04 to 1.70±0.07 mm were achieved with encapsulation efficiency higher than 98%. Surface response analysis revealed that alginate concentration was the important factor for the size, shape and encapsulation efficiency of prepared beads. Furthermore, survived bacteria after acid exposure in all prepared beads (63-83%) were significantly higher than those of untreated cells (39%) and enhanced by increasing alginate concentration. Surface response analysis revealed that the effect of all three factors of alginate and CaCl2 concentrations as well as hardening times were significant in acid viability, however alginate concentration played the most important role according to its regression coefficient. Conclusion: Among alginate and CaCl2 concentrations as well as hardening times, alginate concentration was the most variable in the characteristics of Alginate beads.
Keywords: Lactobacillus acidophilus, Alginate, Bead, CaCl2, Hardening time
Introduction
In line with a global trend towards naturally occurring agents, probiotics have increasingly got more attention. “Probiotics are live microorganisms (bacteria or yeasts), which when ingested or locally applied in sufficient numbers confer one or more specified demonstrated health benefits for the host”.1 Their most important benefits are categorized as maintenance of normal intestinal microflora,2 defense against enteropathogen infections,3 controlling serum cholesterol levels,4 improving lactose intolerance,5 and possessing anticarcinogenic and antimutagenic activities.6
To get the potential benefits of probiotics they should safely transit through acidic and enzymatic conditions of gastric tract and colonize and grow on the epithelium of colon in appropriate population.7 According to FAO’s guideline, probiotics should present at their active site in a minimum count of 106-7 CFU/g or ml. 1 To reach such viability different strategies have been employed so far. In this regard encapsulation of probiotics in wide variety of polymers is the most frequently applied method that is cited in numerous studies.8
Alginate, a commonly used material to encapsulate probiotics, is a naturally occurring biocompatible and biodegradable linear anionic polysaccharide. Preparation of alginate bead, with well retained bacteria in their matrix, can be easily achieved by simple techniques like extrusion or emulsion methods.9 In spite of the wide application of calcium alginate microcapsules in this area, there are not any common agreement about the conditions used and various protocol in this regard have been published so far.10 The objective of this work was to evaluate the effect of the most important parameters in the preparation of calcium alginate beads including ALG concentration, CaCl2 concentration as well as hardening time on the size, morphology, encapsulation efficiency (EE) and acid viabilities of Lactobacillus acidophilus.
Materials and Methods
Materials
L. acidophilus DSMZ20079 was obtained from DSMZ (Germany), pepsin, pancreatin, sodium alginate, MRS broth and MRS agar, sodium hydrogen phosphate, calcium chloride, sodium hydroxide and hydrochloric acid from Merck (Germany).
Methods
Preparation of inoculum
L. acidophilus was cultured in MRS broth at 37°C for 18 hours. Culture was harvested by centrifugation at 700 RCF at 4°C for 7 min and washed twice with saline and collected by centrifugation as above. The washed bacterial cells were resuspended in 7 ml saline and the cell count was determined using pour plate technique in MRS agar in triplicate. The cell suspension divided in some equal parts and consequently was used to prepare different formulations.
Preparation of beads
The extrusion technique was used to prepare ALG beads.11 Sodium alginate solution sterilized at 121°C for 15 min. The cooled ALG solution (20 ml) were mixed with bacterial inoculum and gently stirred for 30 min to obtain a homogeneous suspension. The suspensions were extruded dropwise through a 27 gage nozzle into sterile hardening solution (CaCl2). The beads were shaken at 150 rpm, isolated by aseptic filtration (Whatman No.1), washed twice with sterile water, and kept in 0.1% w/v pepton solution at 4°C. The prepared formulations are shown in Table 1.
Table 1. Compositions of the studied formulation .
| Formulation | A1 | A2 | A3 | A4 | A5 | A6 | A7 | A8 | A9 |
| ALG Conc. %w/v | 1 | 1 | 1 | 1 | 1 | 1 | 1 | 1 | 1 |
| CaCl2Conc. % w/v | 1 | 2 | 4 | 1 | 2 | 4 | 1 | 2 | 4 |
| Hardening time (min) | 15 | 15 | 15 | 30 | 30 | 30 | 60 | 60 | 60 |
| Formulation | A11 | A12 | A13 | A14 | A15 | A16 | A17 | A18 | A19 |
| ALG Conc. %w/v | 1.5 | 1.5 | 1.5 | 1.5 | 1.5 | 1.5 | 1.5 | 1.5 | |
| CaCl2Conc. % w/v | 1 | 2 | 4 | 1 | 2 | 4 | 1 | 2 | 4 |
| Hardening time (min) | 15 | 15 | 15 | 30 | 30 | 30 | 60 | 60 | 60 |
| Formulation | A21 | A22 | A23 | A24 | A25 | A26 | A27 | A28 | A29 |
| ALG Conc. %w/v | 2 | 2 | 2 | 2 | 2 | 2 | 2 | 2 | 2 |
| CaCl2Conc. % w/v | 1 | 2 | 4 | 1 | 2 | 4 | 1 | 2 | 4 |
| Hardening time (min) | 15 | 15 | 15 | 30 | 30 | 30 | 60 | 60 | 60 |
| Formulation | A31 | A32 | A33 | A34 | A35 | A36 | A37 | A38 | A39 |
| ALG Conc. %w/v | 2.5 | 2.5 | 2.5 | 2.5 | 2.5 | 2.5 | 2.5 | 2.5 | 2.5 |
| CaCl2Conc. % w/v | 1 | 2 | 4 | 1 | 2 | 4 | 1 | 2 | 4 |
| Hardening time (min) | 15 | 15 | 15 | 30 | 30 | 30 | 60 | 60 | 60 |
Size and morphological analysis
The particle size of beads was assessed using optical microscopy (Dino-lite, Taiwan) by Scion image analyzer software. Data were collected from 60 beads in each sample and mean particle size was reported.
Aspect Ratio= Major axis/Minor axis.
Encapsulation Efficiency (EE)
To determine the encapsulation efficiency, firstly prepared beads were mechanically disintegrated in phosphate buffer (pH=6.8), then the number of entrapped cells after adequate dilution were measured by pour plate method and counts were expressed as number of colony forming units (CFU), and calculated as:
EE=(Log 10N /Log 10N0) ×100
Where N is the number of viable entrapped cells released from the beads, and N0 is the number of free cells added to the biopolymer mixture immediately before the production procedure.
Viability of encapsulated and free L. acidophilus at simulated gastric pH condition
Low pH conditions was produced using 9g/L sodium chloride and 3.0 g/L of pepsin and pH adjusted to 1.8 with hydrochloric acid.12 100 mg beads with entrapped bacteria or 0.1 ml of cell suspension were mixed in 20 ml of acid solution and incubated for 120 min at 37°C with constant agitation at 50 rpm. After incubation, beads were disintegrated in phosphate buffer (pH=6.8), then 1.0 ml aliquot of the mixture removed and assayed using pour plate method.
The survival (%) of the bacteria was calculated as follow:
%Survival=(log CFU/g beads after 2 hours exposure to acidic condition/ log CFU/g beads initial count) × 100.
Statistical analyses
Statistical testing was carried out using SPSS19. All of the experiments were performed in triplicates. Data are presented as mean ± SD. The One Way ANOVA test was performed to assess the difference between different beads and control groups and P < 0.05 considered as a statistically significant difference. Also surface response analysis using Minitab 16 software to evaluate the impact of each parameter in the responses was applied.
Results and discussion
Size and morphology of prepared beads:
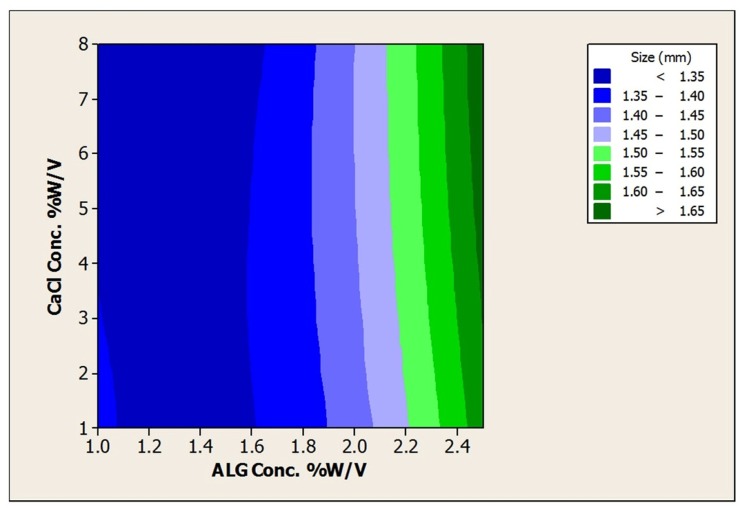
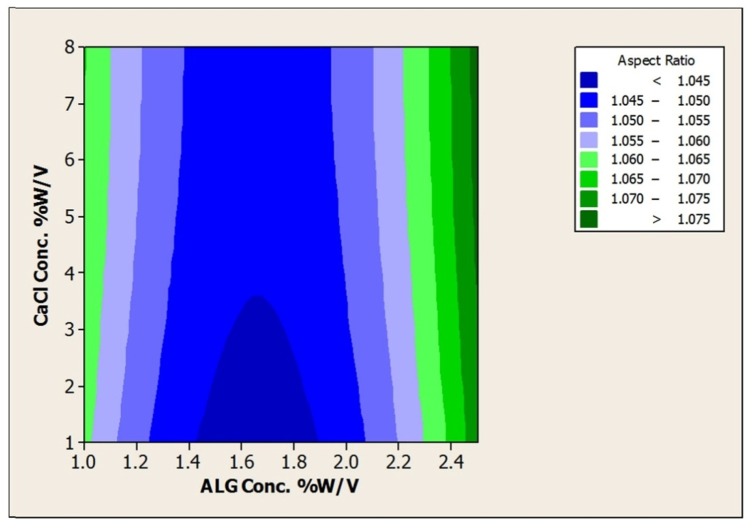
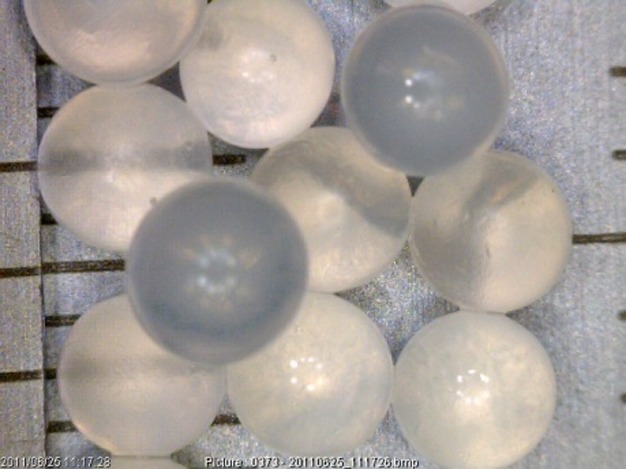
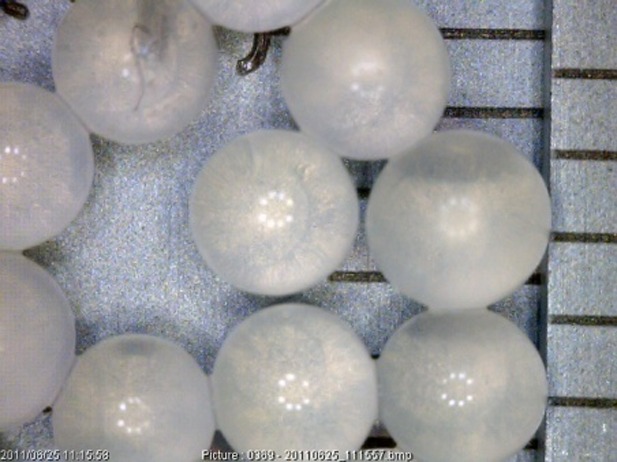
In the present study using different concentrations of ALG (1 to 2.5% w/v), CaCl2 as hardening solution (1 to 4% w/v) as well as hardening time (15 to 60 min) beads prepared by extrusion method (Figure 1) and the effect of these parameters on the size, morphology, encapsulation efficiency and acid viability were examined. The results are shown in Table 2. Furthermore response surface plots to analysis the impact of ALG, CaCl2 and hardening time on the size and aspect ratio was depicted in Figures 2,3 and Tables 3,4.
Figure 1. light microscopy pictures of A1 (a); A11 (b); A21 (c)beads at a magnification of 45.
a.
b.
c.
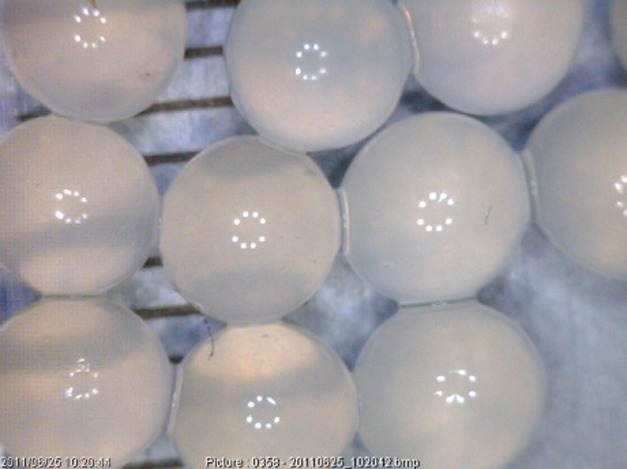
Table 2. Size, aspect ratio, encapsulation efficiency and % survival in acid condition of prepared formulations .
| Formulation | A1 | A2 | A3 | A4 | A5 | A6 | A7 | A8 | A9 |
| Size (mm) | 1.35±0.07 | 1.37±0.05 | 1.32±0.04 | 1.34±0.01 | 1.34±0.01 | 1.37±0.03 | 1.35±0.06 | 1.34±0.04 | 1.36±0.04 |
| Aspect Ratio | 1.02±0.02 | 1.04±0.03 | 1.04±0.07 | 1.05±0.04 | 1.10±0.06 | 1.08±0.04 | 1.06±0.06 | 1.05±0.06 | 1.05±0.05 |
| %EE | 99.87±0.75 | 99.94±1.03 | 100.18±0.79 | 100.21±0.69 | 99.98±0.45 | 99.92±0.70 | 99.98±1.05 | 101.23±0.52 | 100.31±0.84 |
| %Acid Viability | 63.5±0.76 | 65.7±0.47 | 66.2±1.28 | 66.9±0.60 | 67.6±0.43 | 67.0±0.81 | 67.0±0.25 | 67.8±0.52 | 67.6±0.09 |
| Formulation | A11 | A12 | A13 | A14 | A15 | A16 | A17 | A18 | A19 |
| Size (mm) | 1.35±0.07 | 1.37±0.03 | 1.38±0.04 | 1.39±0.06 | 1.37±0.06 | 1.4±0.05 | 1.36±0.04 | 1.36±0.07 | 1.39±0.06 |
| Aspect Ratio | 1.04±0.01 | 1.03±0.03 | 1.01±0.02 | 1.01±0.01 | 1.05±0.02 | 1.04±0.05 | 1.02±0.03 | 1.03±0.01 | 1.03±0.04 |
| %EE | 99.38±0.80 | 98.90±0.27 | 99.51±0.75 | 99.76±0.22 | 98.90±0.70 | 98.90±0.67 | 99.16±0.50 | 99.24±0.39 | 99.38±0.80 |
| %Acid Viability | 66.24±1.58 | 68.00±1.36 | 68.16±1.37 | 70.50±0.40 | 71.87±0.51 | 72.31±0.38 | 73.59±0.99 | 73.89±0.62 | 74.23±0.39 |
| Formulation | A21 | A22 | A23 | A24 | A25 | A26 | A27 | A28 | A29 |
| Size (mm) | 1.42±0.06 | 1.40±0.03 | 1.45±0.03 | 1.41±0.07 | 1.40±0.06 | 1.41±0.02 | 1.44±0.09 | 1.42±0.06 | 1.43±0.04 |
| Aspect Ratio | 1.05±0.01 | 1.04±0.04 | 1.02±0.02 | 1.05±0.04 | 1.03±0.03 | 1.01±0.01 | 1.06±0.04 | 1.07±0.03 | 1.05±0.02 |
| %EE | 99.30±0.35 | 99.30±1.02 | 99.24±0.70 | 99.06±0.07 | 100.07±0.62 | 99.17±0.47 | 98.92±0.55 | 99.38±0.81 | 99.30±0.35 |
| %Acid Viability | 73.1±1.49 | 74.6±2.14 | 74.3±2.46 | 78.4±1.19 | 79.3±0.73 | 80.4±0.61 | 81.2±1.12 | 81.0±1.17 | 81.3±1.27 |
| Formulation | A31 | A32 | A33 | A34 | A35 | A36 | A37 | A38 | A39 |
| Size (mm) | 1.61±0.08 | 1.61±0.06 | 1.70±0.07 | 1.65±0.08 | 1.68±0.09 | 1.65±0.07 | 1.64±0.05 | 1.65±0.09 | 1.67±0.08 |
| Aspect Ratio | 1.03±0.02 | 1.10±0.05 | 1.09±0.04 | 1.06±0.05 | 1.08±0.02 | 1.07±0.04 | 1.11±0.05 | 1.07±0.06 | 1.10±0.06 |
| %EE | 99.87±0.75 | 99.94±1.03 | 100.18±0.79 | 100.21±0.69 | 99.98±0.45 | 99.92±0.70 | 99.98±1.05 | 101.23±0.52 | 100.31±0.84 |
| %Acid Viability | 75.4±1.35 | 76.5±1.44 | 76.4±0.85 | 78.8±0.50 | 80.3±0.27 | 80.2±0.91 | 81.1±1.05 | 82.5±0.67 | 83.0±0.43 |
Figure 2.
Contour Plot of size (mm) vsCaCl2Conc. % w/v; ALG Conc. %w/v.
Figure 3.
Contour Plot of Aspect RatiovsCaCl2Conc. % w/v; ALG Conc. %w/v.
Table 3. Response Surface regression: Size (mm) vsCaCl2Conc. % w/v; ALG Conc. %w/v.
| Parameter |
Regression coefficient |
P value |
| Alginate conc. | 0.00589 | 0.013 |
| Alginate conc.*Alginate | 0.02391 | 0.00 |
| CaCl2 Conc. | 0.00198 | 0.308 |
| R2 = 87.24% | ||
Table 4. Response Surfaceregression: Aspect ratio vsCaCl2Conc. % w/v; ALG Conc. %w/v.
| Parameter |
Regression coefficient |
P value |
| Alginate conc. | -0.141250 | 0.010 |
| Alginate conc.*Alginate | 0.0425000 | 0.00 |
| CaCl2 Conc. | 0.00129032 | 0.290 |
| R2 = 86.92% | ||
As can be seen from Table 2, beads ranging from 1.32±0.04 to 1.70±0.07 mm were achieved. The mean diameters of beads were significantly increased by increase in the concentration of alginate (p<0.05) that can be attributed to the viscosity of the resultant gel. According to the studies in this regard, an increase in the viscosity of the starter gel leads to the preparation of bigger beads by the extrusion method.7 However, CaCl2 concentration and hardening time had no significant effect on the size and aspect ratio of prepared beads (p>0.05).
Alginate as a linear polymer composed of d-mannuronic (M) and l-guluronic (G) acid.13 The characteristic of the resultant polymer is strongly dependent on the source, the composition and the sequence in l-guluronic acid and d-mannuronic acid. Generally divalent cations such as Ca2+ bind preferentially to the monomer of l-guluronic acid. As a result, properties of beads made of polymers with low G content are less dependent on CaCl2 concentration. The alginate source used in this study was rich in M content (M/G ratio 1.56) so almost insusceptibility of bead preparation to the CaCl2 concentration and hardening time can be attributed to low G content. Furthermore narrow range of size distribution was observed for all prepared beads and no significant differences in size (P > 0.05) were observed between beads contained or not L. acidophilus loads.
Encapsulation efficiency
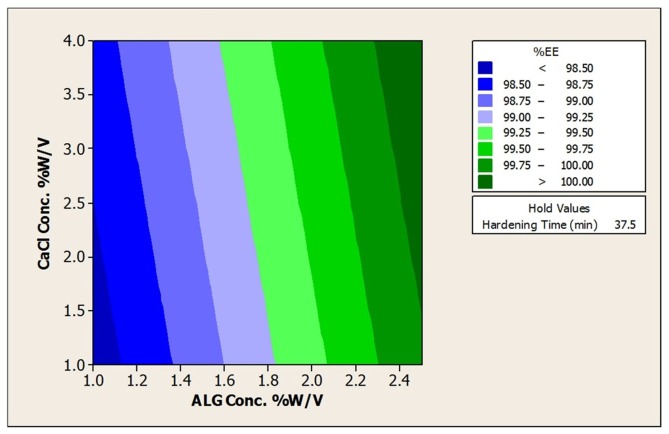
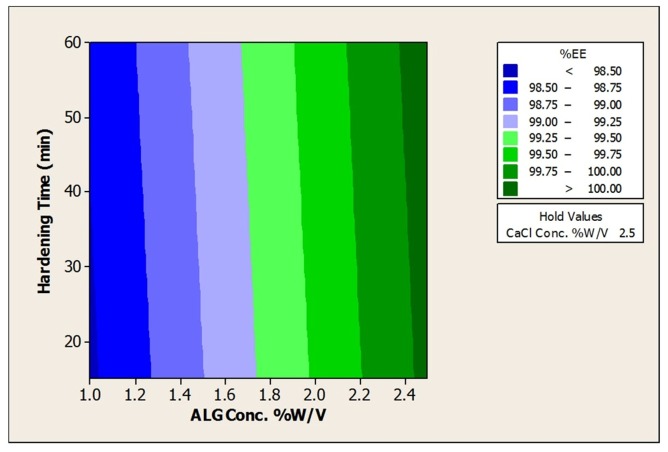
The results of encapsulation efficiencies for the prepared beads are shown in Table 2. The initial cell count of L. acidophilus before bead preparation was 8.82 ± 0.09 log CFU/mL. High bacterial cell entrapping in the range of 8.65 ± 0.07 to 8.99 ± 0.09 (log CFU/g beads) was achieved in resultant beads (Table 2). The results pertaining to EE indicated that there was no considerable loss of viability for all prepared beads and more than 98.9% cells for all beads were successfully entrapped that can be due to the gentle method applied10 Also response surface plots to analysis the impact of ALG, CaCl2 and hardening time on encapsulation efficiencies was depicted in Figure 4 and Table 5.
Figure 4. Contour Plot of % Encapsulation Efficiency vs a)CaCl2Conc. % w/v; ALG Conc. %w/v and b)ALG Conc %w/v.; Hardening time (min).
a.
b.
Table 5. Response Surfaceregression: % Encapsulation Efficiency vsCaCl2Conc. % w/v; ALG Conc. %w/v.; Hardening time (min).
| Parameter |
Regression coefficient |
P value |
| Alginate conc.(w/v) | 0.7993 | 0.00 |
| CaCl2 Conc.(w/v) | 0.1355 | 0.184 |
| Hardening Time (min) | 0.0367 | 0.716 |
| R2 = 62.56% | ||
According to the contour plots and as a same manner with size and aspect ratio, alginate concentration was the only significant factor with a direct effect. By increasing in the alginate concentration, EE increased that can be due to the stiffer structure of prepared beads using higher alginate concentrations. In fact, in firm calcium alginate structure, the number of bacteria entrapped in the alginate network increased leading to the higher EE.14 However, the impact of CaCl2 concentration and hardening time remained meaningless that can be attributed to our alginate source structure as discussed in section 3.1.
Viability of free and encapsulated bacteria in acid conditions
The protective effects of different coats of ALG after 2 hours exposure to acid conditions (pH=1.8) are compared to untreated cells and results are expressed as % survival in Table 2.
As can be seen, around 39% survival of untreated L. acidophilus after acid exposure for 2 hours was achieved. On the other hand, in our prepared beads after 2h acid exposure, more than 63% survival in all formulations was observed. Overall, it is clear that survived bacteria after acid exposure in all prepared beads were significantly (P < 0.05) higher than those of untreated cells. It can be concluded that coating of the bacteria as ALG beads can improve the viability of L. acidophilus in that condition. There are numerous studies with controversial results in this regard to protect probiotics by encapsulation in alginates beads using different techniques.15 In some cases, the investigations support our finding about the ability of ALG coat in protection of bacteria in acid conditions.14,16,17 However others found that encapsulation of bacteria in alginate beads did not effectively protect the organisms from high acidity.18
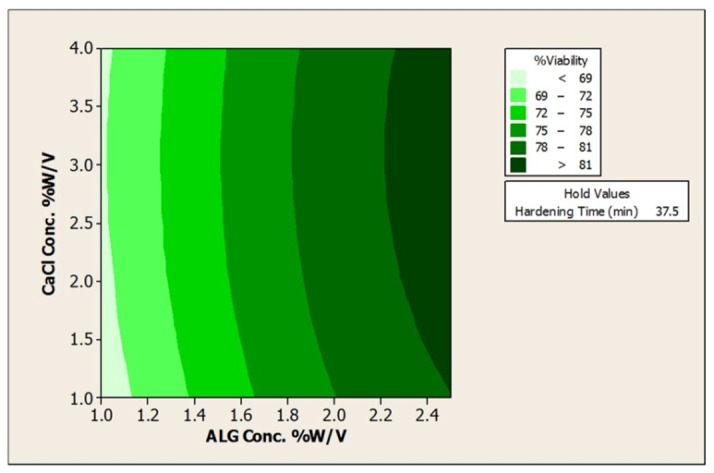
Moreover response surface plots to analysis the impact of ALG, CaCl2 concentrations and hardening time on the viability of the bacteria were depicted in Figure 5 and Table 6.
Figure 5. Contour Plot of % Acid viabilityvs a) CaCl2Conc. % w/v; ALG Conc. %w/v, and b)ALG Conc. %w/v; Hardening time (min).
a.
b.
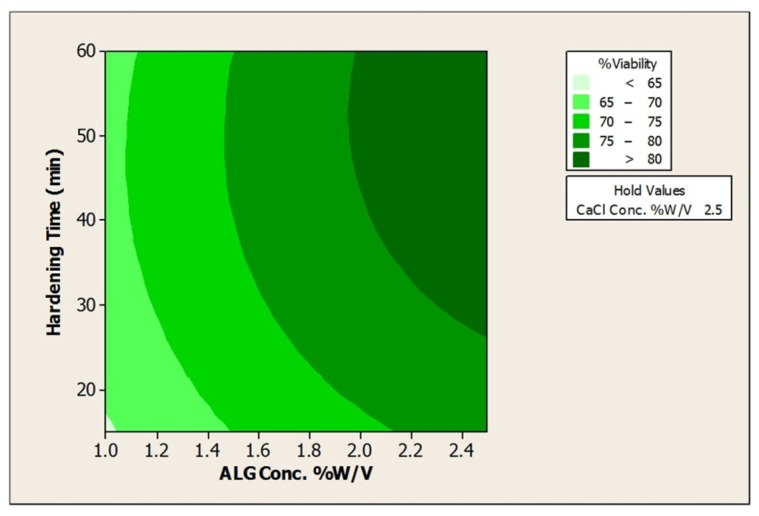
Table 6. Response Surface regression: %Acid ViabilityvsCaCl2Conc. % w/v; ALG Conc. %w/v; Hardening time (min) .
| Parameter |
Regression coefficient |
P value |
| Alginate conc. | 6.9281 | 0.000 |
| Alginate conc.*Alginate | -1.7994 | 0.002 |
| CaCl2Conc. | 0.6198 | 0.043 |
| Hardening time (min) | 2.7389 | 0.000 |
| Hardening time (min)* time | -2.2041 | 0.001 |
| R2 = 95.74% | ||
As can be seen from the plots the impact of ALG, CaCl2 concentrations and hardening time are significant on the viability; however, based on the regression coefficient, the effect of alginate (regression coefficient =6.98) is more obvious in this response when compared to hardening time (regression coefficient =2.7) or CaCl2 concentration (regression coefficient =0.6) . It can be said that increase in the concentration of alginate leading to increase in the viscosity of alginate and consequently increase in the size of obtained beads as the protective layer for bacteria.16
Conclusion
According to the results of the present study encapsulation of L. acidophilus in alginate using extrusion method in optimum conditions (Alginate concentration 1.5 to 2%w/v, CaCl2 concentration 2.5% and hardening time 35 min) led to preparation of spherical beads in the size range of 1.32±0.04 to 1.70±0.07 mm with EE higher than 98% and viability more than 70% (figure 6). Alginate concentration plays the most important role regarding shape, size, encapsulation efficiency and bacterial viability.
Figure 6.
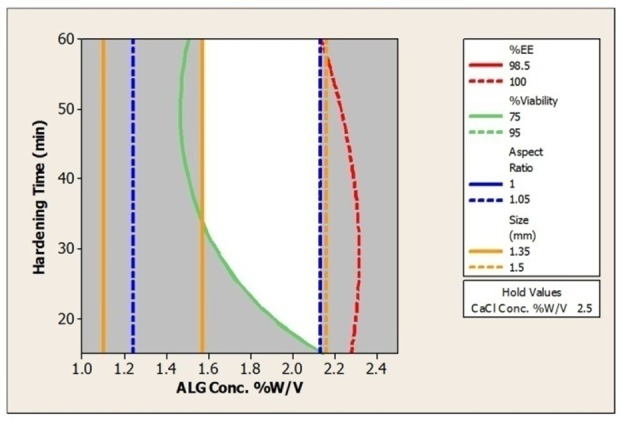
Contour Plot of %EE; %Viability; Aspect Ratio; Size (mm) vsALG Conc. %w/v; hardening time (min).
Acknowledgements
The present study was financially supported by a grant from Tabriz University of Medical Sciences and Biotechnology Research Center, Tabriz, Iran.
Conflict of interest
The authors report no conflicts of interest.
References
- 1.FAO/WHO. Food and Agriculture Organization of United Nations and World Health Organization Working Group reportLondon. Guidelines for the evaluation of probiotics in food 2002.
- 2.Psomas E, Andrighetto C, Litopoulou-Tzanetaki E, Lombardi A, Tzanetakis N. Some probiotic properties of yeast isolates from infant faeces and feta cheese. International journal of food microbiology. 2001;69(1-2):125–33. doi: 10.1016/s0168-1605(01)00580-3. [DOI] [PubMed] [Google Scholar]
- 3.Sieber R, Collomb M, Aeschlimann A, Jelen P, Eyer H. Impact of microbial cultures on conjugated linoleic acid in dairy products-a review. International Dairy Journal. 2004;14(1):1–15. [Google Scholar]
- 4.St-Onge MP, Farnworth ER, Jones PJH. Consumption of fermented and nonfermented dairy products: effects on cholesterol concentrations and metabolism. The American journal of clinical nutrition. 2000;71(3):674. doi: 10.1093/ajcn/71.3.674. [DOI] [PubMed] [Google Scholar]
- 5.Kim HS, Gilliland SE. Lactobacillus acidophilus as a Dietary Adjunct for Milk to Aid Lactose Digestion in Humans. Journal of dairy science. 1983;66(5):959–66. doi: 10.3168/jds.S0022-0302(83)81887-6. [DOI] [PubMed] [Google Scholar]
- 6.Sartor RB. Therapeutic manipulation of the enteric microflora in inflammatory bowel diseases: antibiotics, probiotics, and prebiotics. Gastroenterology. 2004;126(6):1620–33. doi: 10.1053/j.gastro.2004.03.024. [DOI] [PubMed] [Google Scholar]
- 7.Kailasapathy K. Microencapsulation of probiotic bacteria: technology and potential applications. Current issues in intestinal microbiology. 2002;3(2):39–48. [PubMed] [Google Scholar]
- 8.Ouyang W, Chen H, Jones ML. et al. Artificial cell microcapsule for oral delivery of live bacterial cells for therapy: design, preparation, and in-vitro characterization. J Pharm Pharm Sci. 2004;7(3):315–24. [PubMed] [Google Scholar]
- 9.Mortazavian A, Razavi SH, Ehsani MR, Sohrabvandi S. Principles and methods of microencapsulation of probiotic microorganisms. Iranian Journal of Biotechnology (IJB) 2007;5(1):1–18. [Google Scholar]
- 10.Mokarram R, Mortazavi S, Najafi M, Shahidi F. The influence of multi stage alginate coating on survivability of potential probiotic bacteria in simulated gastric and intestinal juice. Food Research International. 2009;42(8):1040–45. [Google Scholar]
- 11.Krasaekoopt W, Bhandari B, Deeth H. Evaluation of encapsulation techniques of probiotics for yoghurt. International Dairy Journal. 2003;13(1):3–13. [Google Scholar]
- 12.Chávarri M, Maraņón I, Ares R, Ibáņez FC, Marzo F, Villarán MC. Microencapsulation of a probiotic and prebiotic in alginate-chitosan capsules improves survival in simulated gastro-intestinal conditions. International Journal of Food Microbiology. 2010;142(1-2):185–9. doi: 10.1016/j.ijfoodmicro.2010.06.022. [DOI] [PubMed] [Google Scholar]
- 13.Wang W, Liu X, Xie Y. et al. Microencapsulation using natural polysaccharides for drug delivery and cell implantation. J Mater Chem. 2006;16(32):3252–67. [Google Scholar]
- 14.Krasaekoopt W, Bhandari B, Deeth H. The influence of coating materials on some properties of alginate beads and survivability of microencapsulated probiotic bacteria. International Dairy Journal. 2004;14(8):737–43. [Google Scholar]
- 15.Doleyres Y, Lacroix C. Technologies with free and immobilised cells for probiotic bifidobacteria production and protection. International Dairy Journal. 2005;15(10):973–88. [Google Scholar]
- 16.Chandramouli V, Kailasapathy K, Peiris P, Jones M. An improved method of microencapsulation and its evaluation to protect lactobacillus spp in simulated gastric condit. Journal of microbiological methods. 2004;56(1):27–35. doi: 10.1016/j.mimet.2003.09.002. [DOI] [PubMed] [Google Scholar]
- 17.Kim SJ, Cho SY, Kim SH. et al. Effect of microencapsulation on viability and other characteristics in lactobacillus acidophilus atcc 43121. LWT-Food Science and Technology. 2008;41(3):493–500. [Google Scholar]
- 18.Sultana K, Godward G, Reynolds N, Arumugaswamy R, Peiris P, Kailasapathy K. Encapsulation of probiotic bacteria with alginate-starch and evaluation of survival in simulated gastrointestinal conditions and in yoghurt. International journal of food microbiology. 2000;62(1-2):47–55. doi: 10.1016/s0168-1605(00)00380-9. [DOI] [PubMed] [Google Scholar]


