Abstract
Ovarian cancer is the fifth leading cause of cancer-related mortalities for women in the United States and the most lethal gynecological cancer. Aberrant glycosylation has been linked to several human diseases, including ovarian cancer, and accurate measurement of changes in glycosylation may provide relevant diagnostic and prognostic information. In this work, we used microchip electrophoresis coupled with laser-induced fluorescence detection to determine quantitative differences among the N-glycan profiles of control individuals and late-stage recurrent ovarian cancer patients prior to and after an experimental drug treatment that combined docetaxel and imatinib mesylate. N-Glycans were enzymatically released from 5-μL aliquots of serum samples, labeled with the anionic fluorescent tag, 8-aminopyrene-1,3,6-trisulfonic acid, and analyzed on microfluidic devices. A 22-cm long separation channel, operated at 1250 V/cm, generated analysis times less than 100 s, separation efficiencies up to 8 × 10⁵ plates (3.6 × 10⁶ plates/m), and migration time reproducibilities better than 0.1% relative standard deviation after peak alignment. Principal component analysis (PCA) and analysis of variance (ANOVA) tests showed significant differences between the control and both pre- and post-treatment cancer samples and subtle differences between the pre- and post-treatment cancer samples. Area-under-the curve (AUC) values from receiver operating characteristics (ROC) tests were used to evaluate the diagnostic merit of N-glycan peaks, and specific N-glycan peaks used in combination provided AUCs > 0.90 (highly accurate test) when the control and pre-treatment cancer samples and control and post-treatment samples were compared.
Keywords: microfluidics, microchip electrophoresis, N-glycans, glycan profiling, disease monitoring, ovarian cancer, glycomics, multiple biomarkers
Introduction
Glycomic changes have been linked to the onset and development of cancer.1-5 These altered glycosylation patterns can be expressed on serum proteins and on the membrane-bound proteins of tumor cells which may shed into the blood stream. Consequently, identification and reliable quantitation of glycan biomarkers from serum samples may permit non-invasive cancer screening for diagnosis and prognosis. A critical first step to develop accurate screening methods is to determine which glycans are most affected by the disease and how the glycan profile changes at disease onset and as the disease progresses. Moreover, we require measurement techniques that can accurately quantify the up or down conversion of glycans and prove whether changes in their structural isomers are indicative of a disease state.
Over the last several years, mass spectrometry (MS) has emerged as a powerful tool for the identification of cancer-linked markers by comparative glycomic analysis.6-13 MS-based methods are capable of structural characterization of unknown glycans and high-throughput analysis and identification of known glycan structures. However, MS methods are often unable to resolve structural isomers and are sometimes deemed somewhat impractical for traditional clinical work.14-15 Capillary-based16-23 and microchip-based24-28 electrophoresis coupled with laser-induced fluorescence detection provides highly efficient separations capable of resolving glycans and their structural isomers20-22,24,26-27 (e.g., positional and linkage), has excellent detection sensitivity, and may be more practical for routine clinical analysis. For example, capillary electrophoresis has been used to characterize N-glycans from therapeutic and immunological proteins.19-21 Capillary23 and microchip25 electrophoresis of serum N-glycans have also been used for noninvasive diagnosis of liver disease. With short separation channels (<10 cm) and modest electric field strengths (<500 V/cm), microchip electrophoresis is able to provide analysis times that are 10-30 times faster than conventional techniques, but with lower separation efficiencies. In comparison, our microfluidic devices have separation channels >20 cm that are operated at >750 V/cm for rapid and efficient separations of N-glycans derived from clinically relevant serum samples.26-27 Recently, we demonstrated that serum N-glycans can be effectively analyzed by microfluidic devices to observe changes associated with esophageal adenocarcinoma and related conditions.28
Here, we use microchip electrophoresis to determine quantitative differences among the N-glycan profiles of control individuals and late-stage recurrent ovarian cancer patients prior to and after an experimental drug treatment. Ovarian cancer is the fifth leading cause of cancer-related mortalities for women in the United States and the most lethal gynecological cancer.29 During the early stages, ovarian cancer is often asymptomatic, and current non-invasive screening methods are frequently unreliable, especially for early detection. Long-term survival rates are generally poor (<30%) for patients who are diagnosed with late stage ovarian cancer; however, up to 90% of patients can be cured with conventional surgery and chemotherapy when diagnosed in stage I.30 Unfortunately, only 25% of new cases are detected in stage I. Hence, the development of methods that detect disease onset early and reliably is crucial. Interestingly, the most widely accepted clinical marker for ovarian cancer, cancer antigen-125 (CA-125), is a large glycoprotein containing numerous glycosylation sites.31 A few groups have shown that examination of glycans from whole serum and from specific glycoproteins can potentially be complementary to or even more informative than monitoring CA-125 alone.6,32-35
In this study, the ovarian cancer samples are from late-stage patients enrolled in a study designed to test the efficacy of docetaxel and imatinib mesylate administered in combination36 and were also analyzed by MALDI-TOF-MS.35 Here, N-glycans were enzymatically derived from glycoproteins in 5-μL aliquots of serum, labeled with 8-aminopyrene-1,3,6-trisulfonic acid (APTS), and analyzed by microchip electrophoresis. Electrophoretic analysis generates a profile (or fingerprint) for each of the samples, and each fingerprint consists of migration times and peak areas for the 50-60 most intense peaks. These profiles are then compared statistically, and principal component analysis (PCA), analysis of variance (ANOVA), and receiver operating characteristics (ROC) independently rendered significant differences among the sample groups. Moreover, the use of several N-glycan peaks in combination provided better differentiation of the control and cancer sample groups than individual N-glycan peaks. Although structural identification of the glycans that contributed most to sample differentiation in this study is an important next step, statistical results from these electrophoretic fingerprints compared quite favorably with MALDI-MS data of the same samples.
Experimental Section
Materials
The following materials were used: acrylamide and sodium dodecyl sulfate (SDS) from Bio-Rad Laboratories, Inc.; ammonium hydroxide from J.T. Baker; high-purity 8-aminopyrene-1,3,6-trisulfonic acid (APTS) from Beckman Coulter, Inc.; hydrogen peroxide from Macron Fine Chemicals; peptide-N-glycosidase F (PNGase F) of Chryseobacterium menigosepticum (EC 3.2.2.18) from Northstar BioProducts; sodium hydroxide from Fisher Scientific; Nonidet P-40 from Roche Diagnostics; HPLC grade water and trifluoroacetic acid from EMD Chemicals, Inc.; HPLC grade acetonitrile from Mallinckrodt Baker; Microposit MF-319 developer from MicroChem Corp.; 353NDT epoxy from Epoxy Technology; chromium etchants 8002-A and 1020 and buffered oxide etchant from Transene Co., Inc.; B270 mask blanks and cover plates from Telic Co.; and activated carbon micro spin columns and 1000-Da cutoff cellulose dialysis tubes from Harvard Apparatus. All other chemicals were purchased from Sigma-Aldrich Co.
Serum Samples
Patients diagnosed with late stage recurrent ovarian cancer were enrolled in an experimental drug trial that used docetaxel and imatinib mesylate in combination.36 Blood serum samples were collected by standard procedures from these patients prior to the first treatment cycle (referred to as “pre-treatment samples”) and after the first treatment cycle but just prior to a second round of treatment (referred to as “post-treatment samples”).36 Samples from age-matched females were used as controls. The average age of the individuals in the control group was 55.7 ± 9.7, and the average ages for the pre- and post-treatment sample groups were 57.9 ± 11.0 and 57.7 ± 9.8, respectively. Blood was drawn into sterile Vacutainer tubes and allowed to clot for 30 min at ambient temperature. The serum layer was removed, centrifuged, aliquoted, and stored at −80 °C. The sample collection was approved through institutional review board approved clinical protocols (HOG-Breast120 and HOG-Gyn062).
Preparation of Serum N-Glycan Samples
Blood serum samples (5-μL aliquots) were diluted to 25 μL with a buffer composed of 10 mM sodium phosphate (pH 7.5), 0.1% β-mercaptoethanol, and 0.1% SDS. The samples were denatured, and the disulfide bonds were reduced during incubation at 60 °C for 60 min. Samples were then allowed to cool to ambient temperature. Subsequently, a 2.5-μl aliquot of 10% Nonidet P-40, a nonionic, nondenaturing detergent, was added, and the samples were allowed to equilibrate for 5-10 min to ensure sufficient partitioning of SDS into the micelles to prevent denaturation of PNGase F. PNGase F (5 mU) was added to cleave N-glycans from protein backbones, and the samples were incubated at 37 °C for 18 h. The released N-glycans were isolated from deglycosylated proteins and other components in the digestion solution with activated carbon micro-spin columns as previously described.35 The N-glycans were dried with a vacuum CentriVap Concentrator (Labconco Corp.) and labeled with APTS37 by established procedures26 to impart a negative charge for electrophoresis and a fluorescent tag for detection.
Fabrication of Microfluidic Devices
We used standard photolithography, wet chemical etching, and cover plate bonding to fabricate the microfluidic devices.26 Briefly, B270 glass substrates coated with 120 nm of Cr and 530 nm of AZ1518 photoresist were exposed to 200 mJ/cm2 UV radiation through a photogenerated mask (HTA Photomask) on a mask aligner (205S, Optical Associates, Inc.). The substrates were placed in MF-319 developer for 2 min to develop the exposed photoresist. Chromium etchant 8002-A transferred the channel pattern into the chromium layer, and buffered oxide etchant etched the channels into the glass substrates. A stylus based profiler (Dektak 6M, Veeco Instruments, Inc.) measured the channel dimensions. After the etching process, the channels were 15-μm deep and 90- and 30-μm wide along the straight channel and turns, respectively. Holes sandblasted at the ends of the channels with a sandblaster (AEC Air Eraser, Paasche Airbrush Co.) provided electrical and fluidic access. Acetone removed the remaining photoresist layer, and chromium etchant 1020 stripped the remaining chromium layer. Etched substrates and cover plates were hydrolyzed in a solution of NH4OH, H2O2, and H2O (2:1:2), sonicated in H2O, brought into contact with each other, dried at 90 °C for 2 h, and annealed in a furnace at 550 °C for 10 h. Pieces of glass tubing (6-mm o.d. × 4-mm i.d. × 6-mm tall) were affixed over the sandblasted holes with 353NDT epoxy.
Microchannel Coating
To minimize electroosmotic flow and prevent sample adsorption, the microchannels were coated with linear poly(acrylamide). Microchannels were cleaned sequentially with 1.0 M sodium hydroxide, water, and methanol for 20 min each. A solution of 45 μL MAPTOS dissolved in 1.5 mL methanol with 0.02 M acetic acid was drawn into the channels and allowed to react for 45 min. Residual MAPTOS solution was removed by sequential rinses of methanol and water for 15 min each, and the microchannels were filled with an aqueous solution containing 2.4% (w/w) acrylamide, 1.0 μL/mL TEMED, and 1.0 mg/mL ammonium persulfate and allowed to react for 2 h. The microchannels were flushed with water for 20 min and filled with a 1 mM phosphate and 20 mM HEPES buffer (pH 6.8) prior to sample analysis.
Microchip Electrophoresis
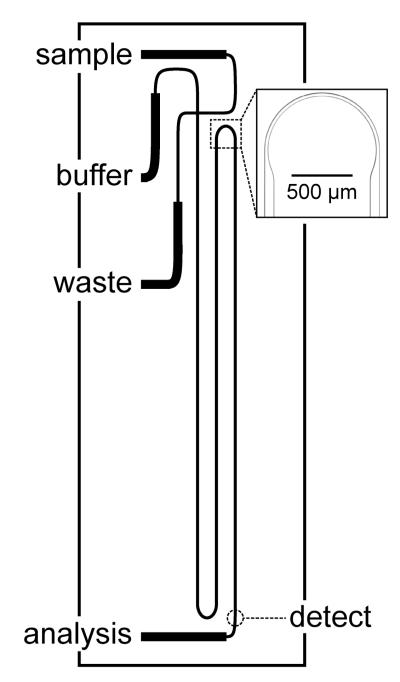
Figure 1 shows a schematic of the microfluidic device that has a serpentine channel with a 22-cm separation length and asymmetrically tapered, 180° turns.38 Potentials were applied to the sample, buffer, and waste reservoirs with a fast-slewing high voltage power supply (0-10 kV) and to the analysis reservoir with a commercial high voltage power supply (0-30 kV; CZE 1000R, Spellman High Voltage Electronics Corp.). The high voltage outputs were controlled through an analog output board (PCI-6713, National Instruments Corp.) by a program written in LabVIEW 8.0 (National Instruments Corp.). Samples were introduced into the analysis channel by standard pinched injections.39
Figure 1.
Schematic of a microfluidic device that has a serpentine channel with a separation length of 22 cm. The inset is a bright-field image of an asymmetrically tapered, 180° turn with taper ratio 3. The turn width and straight channel width are 30 μm and 90 μm, respectively.
Separations were monitored on an inverted optical microscope (TE-2000U, Nikon, Inc.) configured for epifluorescence and equipped with a 20× objective and HQ FITC filter cube (Chroma Technology Corp.). The 488-nm line of an argon ion laser (Melles Griot, Inc.) was attenuated to 1.0 mW with neutral density filters and focused to a spot in the analysis channel 22-cm downstream from the cross intersection. The fluorescence signal was spatially filtered with a 600-μm pinhole, detected with a photomultiplier tube (H5783-01, Hamamatsu Corp.), amplified by a low-noise current preamplifier (SR570, Stanford Research Systems, Inc.), and recorded at 100 Hz with a multifunction data acquisition board (PCI-6032E, National Instruments Corp.) and the LabVIEW program.
Data Analysis
As previously described,28 C Stats software, developed in-house, was used to align the migration times of all electropherograms to a reference electropherogram and extract the areas of all peaks. To obtain peak areas, three replicate electropherograms of each sample were averaged, and each peak was normalized to the total area of all peaks from the averaged electropherogram. The average peak areas for the same peak from all samples were used to calculate a sample average and standard deviation for each peak. Prior to PCA, individual peak areas were scaled by subtracting the sample average and dividing by the sample standard deviation to prevent peaks with a high S/N ratio from dominating the analysis and permit all peaks to contribute fairly. PCA, supervised with prior knowledge of the sample groups, was performed with MarkerView 1.2.1 (Applied Biosystems). Exploratory data analysis indicated that the peak areas from this dataset were normally distributed. For pairwise comparisons, we used SPSS 19 (IBM Corp.) to perform single-variable ANOVA for parametric analysis. OriginPro 8.6 (OriginLab Corp.) was used to perform ROC tests to generate area-under-the-curve (AUC) values and determine the diagnostic potential of each test. AUC values are highly accurate (AUC > 0.9), accurate (0.8 < AUC < 0.9), moderately accurate (0.7 < AUC < 0.8), less informative (0.6 < AUC < 0.7), and uninformative (AUC < 0.6). To calculate separation efficiencies, selected peaks from the electropherograms were fitted with a Gaussian function in OriginPro 8.6.
Results and Discussion
Microchip Electrophoresis of Serum N-Glycans
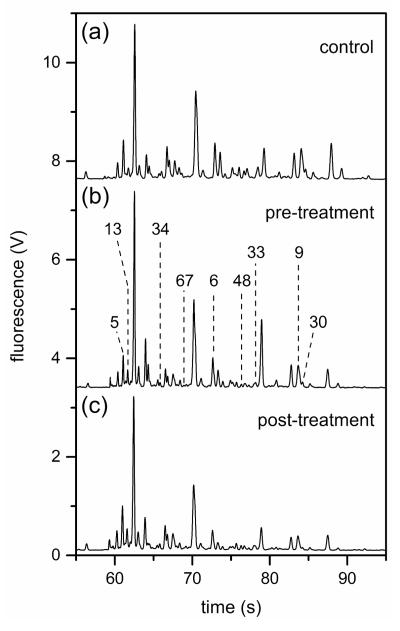
Figure 2 shows electropherograms of N-glycans derived from the blood serum samples of a control individual and ovarian cancer patients prior to and after the experimental drug treatment. Analysis times for all separations were less than 100 s, and migration time reproducibilities were <1% relative standard deviation (RSD) prior to peak alignment. After peak alignment with the C Stats software, the migration time reproducibilities were <0.1% RSD. The high migration time reproducibility permitted the C Stats software to converge more rapidly. N-Glycan peaks at 62.1, 72.2, 76.3, and 87.0 s from electropherograms similar to Figure 2 yielded separation efficiencies from 500,000 to 800,000 plates, which provided high component resolution. Typically, we observe 50-60 N-glycan peaks that have a good S/N ratio, uniform peak shape, and adequate resolution from neighboring peaks.28 For statistical analyses of the sample groups, we examined N-glycan peaks with migration times between 55 and 100 s. Components that had migration times faster than 55 s included byproducts associated with the labeling reaction and low-molecular weight N-glycans, which are partially removed during dialysis and, consequently, would be difficult to quantify. Only two microfluidic devices were needed to analyze all samples in the entire study.
Figure 2.
Electropherograms of the N-glycans derived from blood serum samples from (a) a control individual and (b)–(c) ovarian cancer patients prior to (pre-treatment) and after (post-treatment) an experimental drug treatment. N-Glycan peaks with migration times from 55 to 100 s were used for the disease-state analysis, and the labeled peaks contributed significantly to the differentiation of sample groups. Peak numbers were assigned relative to the peak areas from a reference electropherogram from a pre-treatment sample. Separation performance was evaluated with peaks at 62.1, 72.2, 76.3, and 87.0 s. The separation channel was 22 cm long and was operated at 1250 V/cm.
Principal Component Analysis (PCA) of Electropherograms
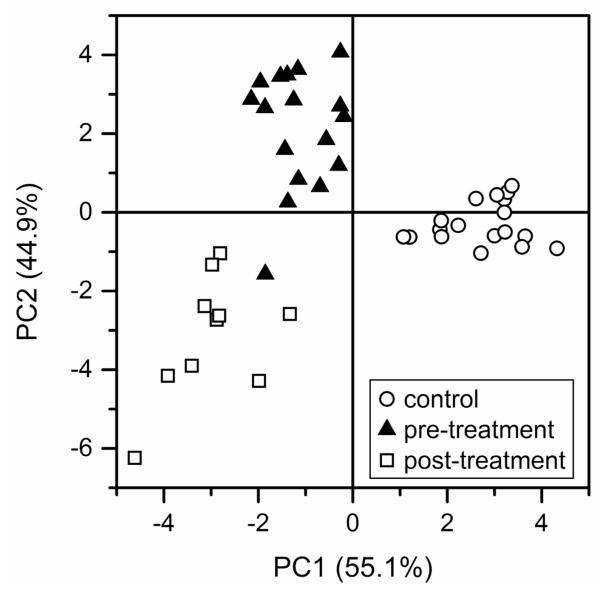
A principal component scores plot40 for electropherograms of the serum N-glycan samples is shown in Figure 3. The three sample groups are distinguished by their first and second principal component scores (PC1 and PC2, respectively). The data show substantial differences in the N-glycan profiles between the control samples and both the pre- and post-treatment samples, but less significant differences are observed between the pre- and post-treatment samples. PCA suggests that the glycomic changes associated with ovarian cancer are further accentuated in the post-treatment samples. These data imply that glycomic changes associated with ovarian cancer can be monitored as the disease progresses and are further supported by comparison of average peak areas of individual N-glycans among the sample groups, discussed below. These trends are consistent with results reported by the Hoosier Oncology Group (Indianapolis, IN)36 where 14 of 23 of the same late-stage ovarian cancer patients unfortunately had a worse prognosis after the experimental drug treatment.
Figure 3.
Principal component analysis (PCA) scores plot for the electropherograms of N-glycan samples derived from blood serum samples of control individuals and ovarian cancer patients prior to (pre-treatment) and after (post-treatment) an experimental drug treatment.
Analysis of Individual N-Glycan Peaks
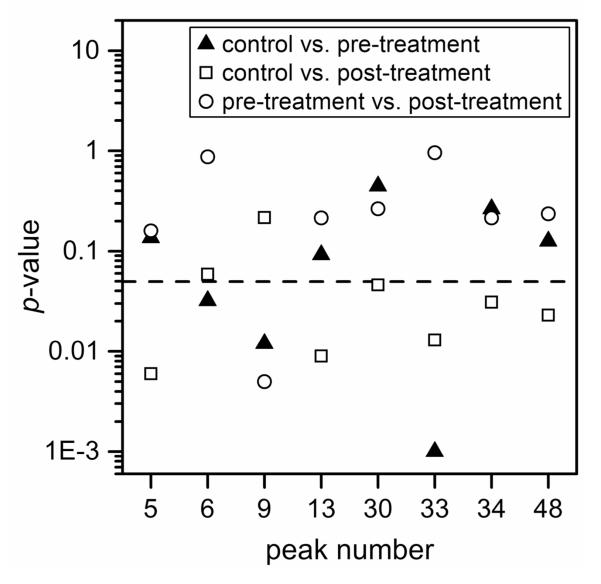
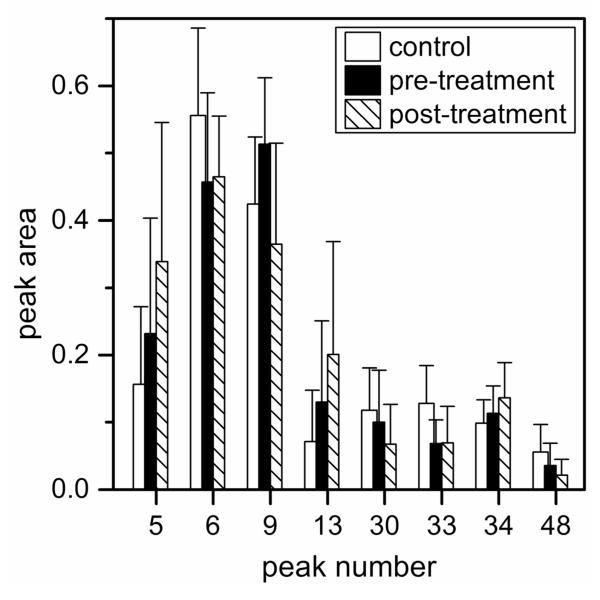
Quantitative differences in the serum N-glycan profiles are evident among the control individuals and the ovarian cancer patients prior to and after treatment. ANOVA tests of the normalized peak areas of the N-glycans were used to determine which components contributed most to the differences among the sample groups. N-Glycan peaks with the most significant quantitative differences, i.e., p-values ≤0.05 from at least one pair-wise comparison, among the sample groups are labeled in Figure 2b. In Figure 4, peaks 6, 9, and 33 have p-values <0.05 from the pairwise comparisons between the control and pre-treatment samples, peak 9 has a p-value <0.05 from the pairwise comparisons between the pre- and post-treatment samples, and peaks 5, 13, 30, 33, 34, and 48 have p-values <0.05 from the pairwise comparisons between the control and post-treatment samples. Peaks with areas that have the largest statistical differences are summarized in Figure 5. Interestingly, peak 67 was detectable in 14 of 18 control samples, 9 of 17 pre-treatment samples, and 6 of 10 post-treatment samples. Pairwise comparisons of peak 67 for the control samples and pre-treatment samples produced p-values <0.05, but peak 67 is not included in further analyses because it was not detected in a large percentage of the samples.
Figure 4.
p-values of N-glycan peaks from the analysis of variance (ANOVA) tests for pairwise comparisons of the control and pre-treatment samples, control and post-treatment samples, and pre-treatment and post-treatment samples. The dashed line indicates a p-value of 0.05. At least one pair-wise comparison for each peak has a p-value <0.05.
Figure 5.
Average peak areas for the N-glycans that had the largest overall changes among control individuals and pre-treatment and post-treatment ovarian cancer patients. Peak numbers were assigned relative to the peak areas from a reference electropherogram from a pre-treatment sample. Error bars are +σ.
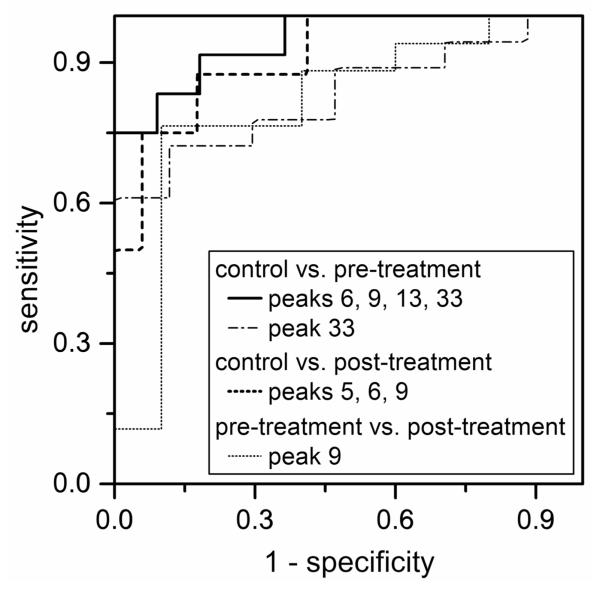
ROC tests compare the outcome of a diagnostic test for several subjects to an independent diagnostic test to confirm either the presence or absence of a specific condition.41 The AUC value from the ROC test is indicative of the diagnostic value of a specific indicator, specifically, a plot of sensitivity (i.e., the true-positive rate) versus 1-specificity (i.e., the false-positive rate) at various threshold levels of the diagnostic maker. N-Glycan peaks with p-values <0.05 were evaluated by ROC, similar to the plots shown in Figure 6. The AUC values from the ROC analysis for all N-glycan peaks with p-values <0.05 were used to evaluate their diagnostic value (or predictive power) and ranged from 0.706 to 0.830. We found that peaks 6 and 9 each provided 0.7 < AUC < 0.8 (moderately accurate tests) and peak 33 provided AUC = 0.830 (accurate test) when the control and pre-treatment samples were compared. Peak 9 provided AUC = 0.806 (accurate test) when the pre- and post-treatment samples were compared. Peaks 5, 13, 30, 34, and 48 each provided 0.7 < AUC < 0.8 (moderately accurate tests) and peak 33 provided AUC = 0.806 (accurate test) when the control and post-treatment samples were compared.
Figure 6.
Receiver operating characteristics (ROC) plots of peak 33 for control and pre-treatment samples (AUC = 0.830), peaks 6, 9, 13, and 33 combined for control and pre-treatment samples (AUC = 0.947), peaks 5, 6, and 9 combined for control and post-treatment samples (AUC = 0.912), and peak 9 for pre-treatment and post-treatment samples (AUC = 0.806).
During the course of the treatment, the cancer patients were monitored through immunohistochemical methods, but as noted above, 14 of 23 patients had a worse prognosis, and there was no clear benefit of the drug combination.36 This observation suggests that specific glycomic changes may be further enhanced in the post-treatment samples. Interestingly, the areas of 5 of 8 N-glycan peaks shown in Figure 5 (peaks 5, 13, 30, 34, and 48) are consistent with this general trend, indicating that they could potentially be used as markers to track the progression of ovarian cancer. The ANOVA tests for these peaks did not produce p-values <0.1 for the pairwise comparisons between the pre- and post-treatment samples, which suggests the N-glycan profiles of the ovarian cancer patients had not changed significantly in the six weeks between collections.
Analysis of N-Glycan Peaks in Combination
Multiple diagnostic tests used collectively can often render higher predictive power than individual tests. For example, specific glycan biomarkers are used in combination to improve predictive power and to detect ovarian cancer with higher sensitivity and specificity than the CA-125 test.33 Moreover, multiplicative combination of N-glycan peaks were beneficial in improving diagnosis of liver disease.23 For the control and pre-treatment samples, we combined the normalized peak areas of peaks 6, 9, 13, and 33. The ANOVA test for the combined peak areas generated a p-value of 9.6×10⁻⁵, and ROC analysis produced an AUC value of 0.947 (see Figure 6). Similarly, combination of peaks 9, 13, and 33 produced a p-value of 3.4×10⁻⁴ and an AUC value of 0.940. For the control and post-treatment samples, five combinations of three peaks (e.g., peaks 5, 6, and 9; peaks 5, 6, and 33; peaks 5, 33, and 48; peaks 6, 33, and 48; and peaks 9, 33, and 48) produced AUCs > 0.9 and p-values < 0.01. These data indicate that the combination of these peaks results in highly accurate tests (AUC > 0.9) for ovarian cancer.
Comparison of Microchip Electrophoresis and MALDI-TOF-MS
We compared our data to results from MALDI-TOF-MS analysis of permethylated glycans derived from the same control and ovarian cancer samples.35 In both studies, significant differences between the control and pre-treatment samples and fewer differences between the pre- and post-treatment samples were found. As demonstrated by the results of this study summarized in Figures 3 and 5, a further progression of the disease is indicated by the N-glycan profiles of the post-treatment samples, similar to what was observed in the MS study. Specifically, for the PCA plot in Figure 3, the pre-treatment samples clustered between the control and post-treatment samples for PC1 (the major component, which accounts for the greatest variance among the sample groups). In good agreement, the average areas of 5 of 8 N-glycan peaks in Figure 5 either increased or decreased when the control and pre-treatment samples are compared and continued to increase or decrease for the post-treatment samples. The MALDI-TOF-MS analysis resulted in the detection of nearly 50 distinct mass signals that correspond to known glycan structures, which include unresolved structural isomers, whereas 50-60 peaks are typically observed in most samples by microchip electrophoresis. However, the linear dynamic range for fluorescence measurements by capillary and microchip electrophoresis is generally better than for MALDI-TOF-MS.15 Additionally, quantitation by MS can be difficult due to differences in ionization efficiency and detector response, whereas quantitation with laser induced fluorescence of a single fluorescent label per N-glycan appears straightforward.
Conclusions
Statistical analyses (PCA and ANOVA) of the electropherograms show significant differences between the control and both pre- and post-treatment ovarian cancer samples, but differences between the pre- and post-treatment samples are more subtle. Moreover, N-glycan peaks analyzed in combination improve differentiation of control and pre-treatment samples and control and post-treatment samples and result in highly accurate tests for ovarian cancer. Further progression of ovarian cancer is observed in the N-glycan profiles from the pre-treatment to post-treatment samples. These general trends agree well with results from the original study36 and with the recent glycomic investigation by MALDI MS.35 Of note, our data also demonstrate that the N-glycans in the serum samples are stable under the storage conditions and can be analyzed several years after the initial blood serum collection. Further studies with a larger number of samples are required to determine the biological significance of the observed glycomic alterations; moreover, the drug treatment may also induce glycomic changes which are currently unknown. Our work here shows that microfluidic devices have the potential to be used as a simple and robust platform for routine analysis of clinical samples.
Acknowledgements
This work was supported in part by NIH U01 CA128535. The authors thank Dr. Daniela E. Matei and Nancy Menning from the Hoosier Oncology Group (Indianapolis, IN) for providing the samples and the Indiana University Nanoscale Characterization Facility for use of its instruments.
References
- (1).Hakomori S. Tumor malignancy defined by aberrant glycosylation and sphingo(glyco)lipid metabolism. Cancer Res. 1996;56:5309–5318. [PubMed] [Google Scholar]
- (2).Dennis JW, Granovsky M, Warren CE. Protein glycosylation in development and disease. Bioessays. 1999;21:412–421. doi: 10.1002/(SICI)1521-1878(199905)21:5<412::AID-BIES8>3.0.CO;2-5. [DOI] [PubMed] [Google Scholar]
- (3).Dube DH, Bertozzi CR. Glycans in cancer and inflammation. Potential for therapeutics and diagnostics. Nat. Rev. Drug Discov. 2005;4:477–488. doi: 10.1038/nrd1751. [DOI] [PubMed] [Google Scholar]
- (4).Arnold JN, Saldova R, Hamid UMA, Rudd PM. Evaluation of the serum N-linked glycome for the diagnosis of cancer and chronic inflammation. Proteomics. 2008;8:3284–3293. doi: 10.1002/pmic.200800163. [DOI] [PubMed] [Google Scholar]
- (5).An HJ, Kronewitter SR, de Leoz MLA, Lebrilla CB. Glycomics and disease markers. Curr. Opin. Chem. Biol. 2009;13:601–607. doi: 10.1016/j.cbpa.2009.08.015. [DOI] [PMC free article] [PubMed] [Google Scholar]
- (6).An HJ, Miyamoto S, Lancaster KS, Kirmiz C, Li BS, Lam KS, Leiserowitz GS, Lebrilla CB. Profiling of glycans in serum for the discovery of potential biomarkers for ovarian cancer. J. Proteome Res. 2006;5:1626–1635. doi: 10.1021/pr060010k. [DOI] [PubMed] [Google Scholar]
- (7).Kirmiz C, Li BS, An HJ, Clowers BH, Chew HK, Lam KS, Ferrige A, Alecio R, Borowsky AD, Sulaimon S, Lebrilla CB, Miyamoto S. A serum glycomics approach to breast cancer biomarkers. Mol. Cell. Proteomics. 2007;6:43–55. doi: 10.1074/mcp.M600171-MCP200. [DOI] [PubMed] [Google Scholar]
- (8).Kyselova Z, Mechref Y, Al Bataineh MM, Dobrolecki LE, Hickey RJ, Vinson J, Sweeney CJ, Novotny MV. Alterations in the serum glycome due to metastatic prostate cancer. J. Proteome Res. 2007;6:1822–1832. doi: 10.1021/pr060664t. [DOI] [PMC free article] [PubMed] [Google Scholar]
- (9).Kyselova Z, Mechref Y, Kang P, Goetz JA, Dobrolecki LE, Sledge GW, Schnaper L, Hickey RJ, Malkas LH, Novotny MV. Breast cancer diagnosis and prognosis through quantitative measurements of serum glycan profiles. Clin. Chem. 2008;54:1166–1175. doi: 10.1373/clinchem.2007.087148. [DOI] [PubMed] [Google Scholar]
- (10).Mechref Y, Hussein A, Bekesova S, Pungpapong V, Zhang M, Dobrolecki LE, Hickey RJ, Hammoud ZT, Novotny MV. Quantitative serum glycomics of esophageal adenocarcinoma and other esophageal disease onsets. J. Proteome Res. 2009;8:2656–2666. doi: 10.1021/pr8008385. [DOI] [PMC free article] [PubMed] [Google Scholar]
- (11).Tang ZQ, Varghese RS, Bekesova S, Loffredo CA, Hamid MA, Kyselova Z, Mechref Y, Novotny MV, Goldman R, Ressom HW. Identification of N-glycan serum markers associated with hepatocellular carcinoma from mass spectrometry data. J. Proteome Res. 2010;9:104–112. doi: 10.1021/pr900397n. [DOI] [PMC free article] [PubMed] [Google Scholar]
- (12).Vasseur JA, Goetz JA, Alley WR, Novotny MV. Smoking and lung cancer-induced changes in N-glycosylation of blood serum proteins. Glycobiology. 2012;22:1684–1708. doi: 10.1093/glycob/cws108. [DOI] [PMC free article] [PubMed] [Google Scholar]
- (13).Mann BF, Goetz JA, House MG, Schmidt CM, Novotny MV. Glycomic and proteomic profiling of pancreatic cyst fluids identifies hyperfucosylated lactosamines on the N-linked glycans of overexpressed glycoproteins. Mol. Cell. Proteomics. 2012;11 doi: 10.1074/mcp.M111.015792. [DOI] [PMC free article] [PubMed] [Google Scholar]
- (14).Mechref Y, Novotny MV. Structural investigations of glycoconjugates at high sensitivity. Chem. Rev. 2002;102:321–369. doi: 10.1021/cr0103017. [DOI] [PubMed] [Google Scholar]
- (15).Vanderschaeghe D, Festjens N, Delanghe J, Callewaert N. Glycome profiling using modern glycomics technology: Technical aspects and applications. Biol. Chem. 2010;391:149–161. doi: 10.1515/bc.2010.031. [DOI] [PubMed] [Google Scholar]
- (16).Liu JP, Shirota O, Wiesler D, Novotny M. Ultrasensitive fluorometric detection of carbohydrates as derivatives in mixtures separated by capillary electrophoresis. Proc. Natl. Acad. Sci. U. S. A. 1991;88:2302–2306. doi: 10.1073/pnas.88.6.2302. [DOI] [PMC free article] [PubMed] [Google Scholar]
- (17).Nashabeh W, El Rassi Z. Capillary zone electrophoresis of linear and branched oligosaccharides. J. Chromatogr. A. 1992;600:279–287. doi: 10.1016/0021-9673(92)85559-c. [DOI] [PubMed] [Google Scholar]
- (18).Kakehi K, Susami A, Taga A, Suzuki S, Honda S. High-performance capillary electrophoresis of O-glycosidically linked sialic acid-containing oligosaccharides in glycoproteins as their alditol derivatives with low wavelength UV monitoring. J. Chromatogr. A. 1994;680:209–215. doi: 10.1016/0021-9673(94)80069-3. [DOI] [PubMed] [Google Scholar]
- (19).Luo RJ, Archer-Hartmann SA, Holland LA. Transformable capillary electrophoresis for oligosaccharide separations using phospholipid additives. Anal. Chem. 2010;82:1228–1233. doi: 10.1021/ac902052m. [DOI] [PubMed] [Google Scholar]
- (20).Archer-Hartmann SA, Sargent LM, Lowry DT, Holland LA. Microscale exoglycosidase processing and lectin capture of glycans with phospholipid assisted capillary electrophoresis separations. Anal. Chem. 2011;83:2740–2747. doi: 10.1021/ac103362r. [DOI] [PubMed] [Google Scholar]
- (21).Mittermayr S, Bones J, Doherty M, Guttman A, Rudd PM. Multiplexed analytical glycomics: Rapid and confident IgG N-glycan structural elucidation. J. Proteome Res. 2011;10:3820–3829. doi: 10.1021/pr200371s. [DOI] [PubMed] [Google Scholar]
- (22).Mittermayr S, Guttman A. Influence of molecular configuration and conformation on the electromigration of oligosaccharides in narrow bore capillaries. Electrophoresis. 2012;33:1000–1007. doi: 10.1002/elps.201100681. [DOI] [PubMed] [Google Scholar]
- (23).Callewaert N, Van Vlierberghe H, Van Hecke A, Laroy W, Delanghe J, Contreras R. Noninvasive diagnosis of liver cirrhosis using DNA sequencer based total serum protein glycomics. Nat. Med. 2004;10:429–434. doi: 10.1038/nm1006. [DOI] [PubMed] [Google Scholar]
- (24).Dang FQ, Zhang LH, Jabasini M, Kaji N, Baba Y. Characterization of electrophoretic behavior of sugar isomers by microchip electrophoresis coupled with videomicroscopy. Anal. Chem. 2003;75:2433–2439. doi: 10.1021/ac034110a. [DOI] [PubMed] [Google Scholar]
- (25).Vanderschaeghe D, Szekrenyes A, Wenz C, Gassmann M, Naik N, Bynum M, Yin HF, Delanghe J, Guttman A, Callewaert N. High-throughput profiling of the serum N-glycome on capillary electrophoresis microfluidics systems: Toward clinical implementation of GlycoHepatoTest. Anal. Chem. 2010;82:7408–7415. doi: 10.1021/ac101560a. [DOI] [PubMed] [Google Scholar]
- (26).Zhuang Z, Starkey JA, Mechref Y, Novotny MV, Jacobson SC. Electrophoretic analysis of N-glycans on microfluidic devices. Anal. Chem. 2007;79:7170–7175. doi: 10.1021/ac071261v. [DOI] [PubMed] [Google Scholar]
- (27).Zhuang Z, Mitra I, Hussein A, Novotny MV, Mechref Y, Jacobson SC. Microchip electrophoresis of N-glycans on serpentine separation channels with asymmetrically tapered turns. Electrophoresis. 2011;32:246–253. doi: 10.1002/elps.201000461. [DOI] [PMC free article] [PubMed] [Google Scholar]
- (28).Mitra I, Zhuang Z, Zhang Y, Yu C-Y, Hammoud ZT, Tang H, Mechref Y, Jacobson SC. N-glycan profiling by microchip electrophoresis to differentiate disease states related to esophageal adenocarcinoma. Anal. Chem. 2012;84:3621–3627. doi: 10.1021/ac203431s. [DOI] [PMC free article] [PubMed] [Google Scholar]
- (29).Jemal A, Siegel R, Xu JQ, Ward E. Cancer statistics, 2010. CA-Cancer J. Clin. 2010;60:277–300. doi: 10.3322/caac.20073. [DOI] [PubMed] [Google Scholar]
- (30).Badgwell D, Bast RC. Early detection of ovarian cancer. Dis. Markers. 2007;23:397–410. doi: 10.1155/2007/309382. [DOI] [PMC free article] [PubMed] [Google Scholar]
- (31).Wong NK, Easton RL, Panico M, Sutton-Smith M, Morrison JC, Lattanzio FA, Morris HR, Clark GF, Dell A, Patankar MS. Characterization of the oligosaccharides associated with the human ovarian tumor marker CA125. J. Biol. Chem. 2003;278:28619–28634. doi: 10.1074/jbc.M302741200. [DOI] [PubMed] [Google Scholar]
- (32).Saldova R, Royle L, Radcliffe CM, Hamid UMA, Evans R, Arnold JN, Banks RE, Hutson R, Harvey DJ, Antrobus R, Petrescu SM, Dwek RA, Rudd PM. Ovarian cancer is associated with changes in glycosylation in both acute-phase proteins and IgG. Glycobiology. 2007;17:1344–1356. doi: 10.1093/glycob/cwm100. [DOI] [PubMed] [Google Scholar]
- (33).Leiserowitz GS, Lebrilla C, Miyamoto S, An HJ, Duong H, Kirmiz C, Ll B, Liu H, Lam KS. Glycomics analysis of serum: A potential new biomarker for ovarian cancer? Int. J. Gynecol. Cancer. 2008;18:470–475. doi: 10.1111/j.1525-1438.2007.01028.x. [DOI] [PMC free article] [PubMed] [Google Scholar]
- (34).Li BS, An HJ, Kirmiz C, Lebrilla CB, Lam KS, Miyamoto S. Glycoproteomic analyses of ovarian cancer cell lines and sera from ovarian cancer patients show distinct glycosylation changes in individual proteins. J. Proteome Res. 2008;7:3776–3788. doi: 10.1021/pr800297u. [DOI] [PubMed] [Google Scholar]
- (35).Alley WR, Vasseur JA, Goetz JA, Syoboda M, Mann BF, Matei DE, Menning N, Hussein A, Mechref Y, Novotny MV. N-linked glycan structures and their expressions change in the blood sera of ovarian cancer patients. J. Proteome Res. 2012;11:2282–2300. doi: 10.1021/pr201070k. [DOI] [PMC free article] [PubMed] [Google Scholar]
- (36).Matei D, Emerson RE, Schilder J, Menning N, Baldridge LA, Johnson CS, Breen T, McClean J, Stephens D, Whalen C, Sutton G. Imatinib mesylate in combination with docetaxel for the treatment of patients with advanced, platinum-resistant ovarian cancer and primary peritoneal carcinomatosis - a Hoosier Oncology Group trial. Cancer. 2008;113:723–732. doi: 10.1002/cncr.23605. [DOI] [PubMed] [Google Scholar]
- (37).Evangelista RA, Chen FTA, Guttman A. Reductive amination of N-linked oligosaccharides using organic acid catalysts. J. Chromatogr. A. 1996;745:273–280. [Google Scholar]
- (38).Ramsey JD, Jacobson SC, Culbertson CT, Ramsey JM. High-efficiency, two-dimensional separations of protein digests on microfluidic devices. Anal. Chem. 2003;75:3758–3764. doi: 10.1021/ac0264574. [DOI] [PubMed] [Google Scholar]
- (39).Jacobson SC, Hergenröder R, Koutny LB, Warmack RJ, Ramsey JM. Effects of injection schemes and column geometry on the performance of microchip electrophoresis devices. Anal. Chem. 1994;66:1107–1113. [Google Scholar]
- (40).Hotelling H. Analysis of a complex of statistical variables with principal components. J. Educ. Psychol. 1933;24:417–441. [Google Scholar]
- (41).Hanley JA, McNeil BJ. The meaning and use of the area under a receiver operating characteristic (ROC) curve. Radiology. 1982;143:29–36. doi: 10.1148/radiology.143.1.7063747. [DOI] [PubMed] [Google Scholar]


