

Abstract
Mitogen activated protein (MAP) kinases are responsible for many cellular functions, and their malfunction manifests itself in several human diseases. Usually, monitoring the phosphorylation states of MAP kinases in-vitro requires the preparation and purification of the proteins or western blotting. Herein, we report an array sensing approach for the differentiation of MAP kinases and their phosphorylated counterparts in-vitro. This technique utilizes a library of differential receptors created in-situ containing peptides known for affinity to MAP kinases, and a Zn(II)–dipicolylamine complex that binds phosphate groups on proteins. An indicator-displacement assay signals the binding of the individual receptors to the kinases, while chemometrics is used to create a fingerprint for the kinases and their state of activity. For example, linear discriminant analysis correctly identified kinase activity with a classification accuracy of 97.5% in-vitro, while the cellular response to kinase expression was classified with 100% accuracy.
Introduction
Protein phosphorylation is a pivotal post-translational modification that regulates intracellular signaling networks, gene transcription, and cell growth in eukaryotic cells.1 The specific phosphorylation of serine, threonine, and tyrosine residues controls the enzymatic activity of a diverse range of kinases. For example, the mitogen-activated protein (MAP) family of kinases triggers key cell-signaling pathways, thus regulating a variety of cellular responses, such as mitosis, cell differentiation, the cell cycle, and apoptosis.2,3 Aberrant MAP kinase activity is associated with human diseases, such as inflammatory response, hematologic malignancies, and cancer.4,5 Of the MAP kinases, several are associated with these disease states, including extracellular signal regulated kinases (ERK1/2), the c-Jun N-terminal kinases (JNK1/2/3), and p38 MAPK α, β, γ, and δ.6
Simple and efficient protein phosphorylation detection methods, as well as techniques to qualitatively assess cellular changes in response to the phosphorylation, could serve as tools to monitor cell status, kinase activity, and as screens for potential inhibitors.2–6 While many approaches involve antibodies and radioactivity-based assays,7 optical-based sensing methods to detect phosphorylation events are advancing rapidly.8–10 Efforts in this area have focused on the development of receptors whose responses are sensitive, as well as being functional in physiological environments.11,12 For instance, the chelation-enhanced fluorescence strategy popularized by Imperiali using a sulfonamido oxime (SOX) fluorophore is a leading approach. 13 Phosphorylation of Ser/Thr residues enhances the affinity of SOX with magnesium, and as a result increases the fluorescence of SOX.14
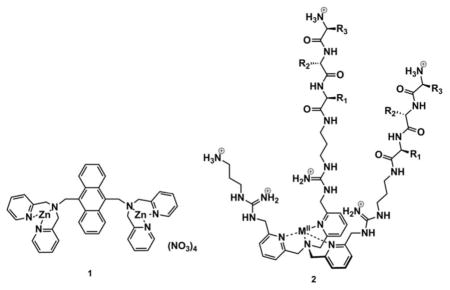
Other groups are working to create supramolecular receptors as kinase chemosensors.15,16 Hamachi and co-workers studied chemosensor 1, which contains two units of zinc-dipicolylamine Zn(DPA).17 In aqueous solution at neutral pH, the two Zn(Dpa) moieties of 1 interact with various phosphopeptides (Ka values ranging from 104 to 107 M−1),18 but not with their nonphosphorylated counterparts. Additionally, the same group designed a highly selective hybrid biosensor,19 where a similar dinuclear zinc receptor was incorporated into the phosphoprotein binding site of M15C-WW mutant protein, allowing them to monitor kinase-catalyzed phosphorylation.
While the Hamachi and Imperiali detection systems selectively bind to and signal phosphorylation, it is necessary to synthesize a different receptor to be selective for each phosphorylated target. Further, in some cases it may be desirable to characterize an overall change in cell signaling pathways and the detection of a specific phosphorylation event is not necessarily indicative of other cellular changes. To avoid the tedious process of developing individual highly selective receptors, the use of differential sensing techniques has been growing in the supramolecular chemistry field. This sensing protocol exploits the interactions between target analytes and a library of cross-reactive receptors to create a response pattern that is unique for individual analytes, or different mixtures thereof.20,21 Using this approach, one obtains a distinct fingerprint of composite signals produced by the sensor elements, allowing for discrimination of different challenging analytes.22 Our group,23 and others,24–27 have used differential sensing for the analysis of various pure peptides and proteins. For example, we recently reported a pattern-based approach to discriminate phosphorylated tripeptides. A library of cross-reactive receptors was derived from a tris(2-pyridylmethyl)amine unit conjugated to guanidinium ligands and random tripeptides (2). Five different tripeptides, three metals, and three indicators led to 45 receptors, imparting cross-reactivity to the array, allowing chemometric-based differentiation of the targets. 28 Hence, as the next step in extending differential sensing to the detection of post-translational modifications, we envisioned that differential sensing could also be used to pattern protein phosphorylation events, and thereby fingerprint kinases in vitro. Furthermore, we also sought to challenge the methodology with a real-life test and examine its utility in complex mixtures, specifically cell extracts. In cell extracts, the technique would necessarily be responding to changes in distributions of protein modifications that result from activating a kinase pathway.
Results and discussion
1. Design criteria
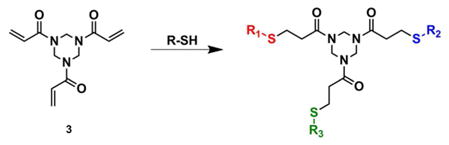
To pattern kinases and cellular responses to their activation we first considered the use of library 2. However, the synthetic complexity of 2 is daunting, and hence we set another goal, that of creating a general method by which a suite of receptors could be generated simply by mixing components in-situ. The conjugate addition reaction of thiols to different conjugate acceptors caught our attention because of its recent use for drug discovery.29 The reaction involves the 1,4-addition of sulfhydryl groups to an enone, which takes place rapidly in water at room temperature.30,31 For our purposes the differential receptor library was based on the functionalization of 1,3,5-triacryloylhexahydro-1,3,5-triazine (3) which has been shown by Son (Eq. 1), to be an attractive conjugate acceptor scaffold for creating tripodal systems.32
 |
Equation 1 |
To pursue our objectives, specific components of the tripodal receptor library were chosen. First, we created component 4 (Figure 1). This compound carries a nucleophilic thiol for use in equation 1, as well as Hamachi’s proven phosphate binding bis-Zn(DPA) unit (the synthesis of 4 is described in detail in the Supporting Information). Second, because our group has previously shown that peptides provide differential binding towards different analytes,33 we synthesized by SPPS techniques two peptides with known affinities to the MAP kinases. For example, ERK-2 phosphorylates the transcription factor Ets-1 at Thr-38 with high specificity.34 Residues 31–35 (PVDAC) are in close proximity to the phosphorylation site of Ets-1.35 Hence, the PVDAC sequence, when incorporated into a receptor library, was expected to impart cross-reactivity between ERK-2 and other kinases. In addition, continuing with this design strategy, we followed the lead of Dalby, who reported the modular peptide substrate Sub-F, which is phosphorylated by ERK-2 when docking with the F-recruitment site (FRS) of this enzyme. 36 The KALIC peptide derives from a linker that separates the C-terminal WXWP binding motif from the MAP kinase phosphorylation site of sub-F peptide. Therefore, such a linker is expected to bind but have low specificity. Lastly, dithiothreitol (DTT) was envisioned as a linker that would add to two different scaffolds (3), resulting in oligomerization, such as dimers, trimers or even larger receptors. When mixtures of three equivalents of these four components are added to 3, a mixture of receptors is created. By varying which components are combined together in the individual wells of a multi-well plate, each well contains a unique set of receptors, thereby creating the diversity and cross-reactivity needed in a differential sensing scheme simply by mixing the components.
Figure 1.

Structure of the receptor library components. 4 Bis-Zn(DPA) receptor, 5 DTT, and designed peptides 6 and 7 with cysteine residues used to generate our in-situ created cross-reactive array for the discrimination of MAP kinases.
2. Determination of the optimal ratio of fluorophore to receptor
For the creation of an optical-signaling protocol that reports the binding of the suite of receptors to the kinases, we turned to indicator displacement assays (IDAs). In an IDA, the receptor interacts with the indicator through non-covalent interactions, and the indicator is displaced from the receptor when it is replaced by the analyte, inducing a signal modulation.37 IDAs have several advantages when using differential sensing: 1) fluorescent indicators can be easily incorporated to impart optical signal changes, 2) they are modular, meaning that different combinations of receptors and indicators are created simply by mixing, 3) the receptor-indicator stoichiometries can be adjusted to optimize the optical response and the threshold concentration for signaling, 38 and 4), one avoids the synthesis of several indicator-linked receptors.39 To signal peptide and protein binding events to our receptors, the coumarin-based indicator 8 was chosen due to its high solubility under physiological conditions, and previous binding studies with zinc coordination compounds.40,41
To test our IDA strategy, and to probe for any differential interactions of our general receptor design with phosphoproteins, receptor ZnR-10 was synthesized. This receptor was used to model the behavior of all receptors in the array; it carries two of the bis-Zn(DPA) units and one underivatized site. First, fluorescence titrations in HEPES buffer were performed to optimize the correct receptor to indicator ratio. To study the binding of indicator 8 to ZnR-10, 750 μL of 100 μM 8 in HEPES buffer in a septum-capped glass cuvette (Starna cells) was titrated with aliquots of at least 5 μL, using 100 μL Hamilton microsyringe, of a solution of 250 μM ZnR-10 and 100 μM 8 in HEPES buffer. The spectra at 357 to 644 nm were recorded after each addition with an excitation wavelength of 347 nm. The fluorescence values at the maximum wavelength (475 nm) were obtained after each aliquot. The addition of receptor ZnR-10 into a solution of 8 resulted in a concentration-dependent quenching of the fluorescence emission of 8 (Figure 3), and a 1:2 receptor-Indicator binding stoichiometry was found. The change in fluorescent intensity at 475 nm was plotted against increasing concentration of host (see Figure S3B Supporting Information) which determined the ratio of ZnR-10 to indicator to be used in the following binding assays with peptides and proteins.
Figure 3.

The indicator is added to a solution of receptor ZnR-10, the host-indicator complex is formed quenching the fluorescence emission of 8. Addition of ZnR-10 (0 – 82 μM) to 8 (100 μM) in 50 mM HEPES buffer, 10 mM NaCl pH=7.4, λex = 347 nm.
3. Indicator displacement assay using a phosphorylated peptide
To prove our principle for sensing protein phosphorylation, we first targeted a specific phosphorylated peptide. We synthesized Sub-F peptide (YAEPLTPRILAKWEWPA), which is a substrate for ERK-2. Phosphorylation conditions and characterization of sub-F peptide is described in the Supporting Information. In our first IDA, we prepared a 1:2 receptor-indicator complex (ZnR-10:8) in aqueous solution at pH=7.4 (50 mM HEPES, 10 mM NaCl). Then, in separated experiments fluorescent titrations between peptides with ZnR-10-indicator complex were done. Individual solutions of 36.6 μM ZnR-10 and 100 μM 8 in HEPES buffer were titrated with aliquots of 1.92 mM phosphorylated peptide solution and 1.92 mM non-phosphorylated peptide solution, which also contained the receptor-indicator complex. Only the phosphorylated peptide (Figure 4A) was able to displace the indicator, which resulted in the restoration of the emission intensity at the λmax of 8 (see Figure S4 Supporting Information).
Figure 4.
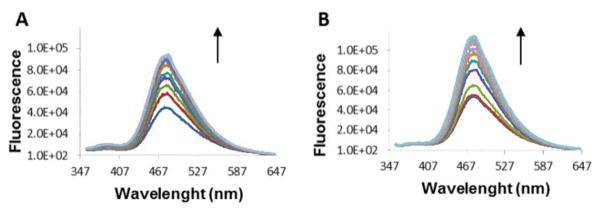
Increase in the fluorescence intensity due to displacement of the coumarin indicator. (A) Addition of sub-F phosphorylated peptide (0 – 1.37 mM) to ZnR-10 (36.6 μM) and 8 (100 μM) in 50 mM HEPES buffer, 10 mM NaCl pH=7.4, λex 347 nm. (B) Addition of phosphorylated ERK-1 (0 – 3.8 μM) to ZnR-10 (36.6 μM) and 8 (100 μM) in 50 mM HEPES, 10 mM NaCl pH=7.4, λex 347 nm.
4. In-vitro differentiation of active and inactive MAP isoform kinases
Because it was found that chemosensor ZnR-10 can differentiate between phosphorylated and non-phosphorylated peptides, we anticipated a similar distinction between active and inactive kinases. In separate experiments, phosphorylated ERK-1 and its inactive form were titrated into a 1:2 receptor-indicator complex solution. A significant increase in the fluorescence intensity was observed upon the addition of active ERK-1 (Figure 4B), compared with the non-phosphorylated analog. The detection limit and limit of quantitation were 14±2.3 nM and 46±7.5 nM of phosphorylated ERK-1, respectively (see Supporting Information). Despite an increase in the fluorescence intensity observed in both cases (see Figure S5 Supporting Information), there was a large enough and reproducible difference to encourage us to continue. Hence, our third and final test prior to creating the array was to analyze the response to a different MAP kinase. Starting with ERK-2, an isoform of ERK-1 with 84% identity at the amino acid level,42 we found that the inactive ERK-2 induces a fluorescence response similar to that of active ERK-2 (Figure S6 Supporting Information). Although the response of this single receptor to active and inactive ERK-2 are similar, the isotherms are different from those of ERK-1, and potentially other receptors that result from our in-situ generated array would be able to differentiate these two ERK-2 species. Hence, these preliminary results showed that this single receptor-indicator system is not only capable of distinguishing active and inactive kinases, but it can also differentiate between close isoforms, and it led credence to the notion that a series of such receptors may lead to a reliable method to classify kinases and their active/inactive forms.
5. Sensing ensemble construction and fingerprint of MAP kinases
To evaluate the ability of the in-situ generated cross-reactive receptors to discriminate ERK-1/2, JNK-3 and p38γ kinases, we prepared a 384-well plate with receptor-indicator combinations. To generate the sensing ensemble, bis-(DPA) receptors R-9, R-10 and R-11 were synthesized (see Supporting Information), and used to create seven different combinations of hosts (see Table S3 in the Supporting Information). Host H1 contains R-9 (57 μM); Hosts H2 and H3 contain receptor R-9 (57 μM) which was stirred separately with one equivalent (per free vinyl group) of the correspondent peptide PVDAC or KALIC (57 μM), and DTT (57 μM). Hosts H4 and H5 contain receptor R-10 (39 μM) and Host H6 contains receptor R-10 (39 μM) and DTT (39 μM). Host H7 contains receptor R-11 (35 μM). The order of addition of each of the reagents was important due to the known coordination interactions between sulfhydryl groups and Zn2+ metal ions.43 Therefore, zinc nitrate was the last reagent added in appropriate equivalents according to the number of DPA moieties present in each receptor where the final concentration was 114 μM, 155 μM and 213 μM according to each host (refer to Table S3 in Supporting Information). Aliquots of each host solution were loaded into a 384-well plate (32 μL Costar black polystyrene microplate), followed by indicator aliquots according to the number of bis-Zn(DPA) moieties present in each receptor. The final concentrations of indicator were 57 μM of 8 to hosts H1-4, 100 μM of 8 to hosts H5 and H6, and 124 μM of 8 to host H7 in HEPES buffer. Finally, respective aliquots of phosphorylated and non-phosphorylated kinases ERK-1, ERK-2, JNK-3 and p38γ were added to each set of host-indicator solutions, so that the final protein concentrations were 4 μM (four replicates each).
Changes in the emission data at the λmax of 8 at pH = 7.4 (475 nm) for each ensemble of the sensor array upon addition of each kinase were recorded using a microplate reader (Biotek Synergy 2). The data generated (4 replicates × 7 host × 8 kinases) were analyzed with the program XLSTAT using linear discriminant analysis (LDA). This chemometric analytical technique simplifies the data set obtained from the sensing array, allowing for differentiation and classification of the response pattern. LDA maximizes the distance between analyte groups while minimizing the distance within an analyte group.44
A series of LDA tests were set up with purified and single proteins. First, using the four phosphorylated kinases (ERK-1, ERK-2, JNK-3 and p38γ), the resulting score plot (Figure 5A) shows excellent differentiation along the F1 and F2 axes, and good clustering of the experimental replicates at the given concentration. The active kinases are organized along the F1 axes by emission modulation of the sensing ensemble, where isoform ERK-2 is located into the left quadrant and ERK-1 into the right one. The kinases are classified into respective sets with 100% accuracy according to a jackknife analysis.45 Next, using the same conditions we sought to test the capability of our sensing ensemble to discriminate phosphorylated and non-phosphorylated kinases (ERK-1, ERK-2, JNK-3 and p38γ). Similar to the previous study, each active and inactive kinase produced a distinctive fluorescence pattern, but with a lower accuracy, 93.5% via a jackknife (Figure 5C). Although inactive p38γ overlaps with active ERK-2, we can clearly distinguish that the active/inactive p38γ and ERK-2 proteins are located on opposite sides of the left quadrant. It is also observed that ERK-1/ERK-2 kinases, which have very similar structures, are classified in opposite areas along F1. Furthermore, the phosphorylated isoforms are significantly differentiated from the non-phosphorylated ones, and within themselves, along both F1 and F2 axes. Finally, active and inactive JNK-3 kinases are clearly classified and located on the top right quadrant. A general trend was found, where the active kinases are located on the right side and the inactive ones are located on the left side, except the ERK-2 isoform.
Figure 5.

LDA score plots and loading plots of the response from the sensing array showing in-vitro differentiation of active and inactive MAP kinases. (A) LDA score plot and (B) loading plot of the fluorescence response pattern of phosphorylated MAP kinases (ERK-1, ERK-2, JNK-3 and p38γ) at 4μM concentration with 100% jack knife analysis. (C) LDA score plot and (D) loading plot of the fluorescence response pattern of phosphorylate (○) and non-phosphorylated (△) kinases (ERK-1, ERK-2, JNK-3 and p38γ) at 4μM concentration with 93.5% jack knife analysis. Vectors on the loading plots represent individual host contribution on the array represented by host number.
It was found that the protein kinases located on the right side of the score plot displaced indicator 8 in the array to a higher extent than those kinases located on the left side of the score plot (Figure 5A and 5C). A loading plot can be generated along with the LDA score plot, and it gives vectors that represent the host contribution to the differentiation of the kinases (Figure 5B and 5D).
According to both loading plots, hosts H-1, H-5, H-6 and H-7 which contain single receptors ZnR-9, ZnR-10, ZnR-10 with DTT and ZnR-11 vary significantly in response to both active and inactive kinases, whereas hosts H-2, H-3 and H-4 which contain ZnR-9 with peptides and DTT did not contribute significantly. This result suggests that different extents of bis-Zn(DPA) moieties on the receptors are responsible to maximize the differential binding between active and inactive kinases.
6. Fingerprint of cell lysates with different cellular response
After the successful in-vitro differentiation of purified active and inactive kinases using LDA of the signals from our array, we explored whether the system could be used to differentiate kinase activity in a complex mixture. To prove the discriminatory properties of our system, we assessed whether the differential receptor library could differentiate HEK293T cells that have differing kinase expression and activity. Because our approach necessarily responds to all phosphorylated proteins, the pattern that arises is a qualitative differentiation of distributions of proteins that change due to a specific profile of kinase activity. For example, differences in the cell line generated by stimulation with anisomycin, epidermal growth factor (EGF), and/or overexpression of ERK-1, would all be reflective of changes resulting from activation of specific pathways. Anisomycin has been reported to activate both JNK and p38 MAPK pathways,46 and EGF was reported to induce ERK and to a lesser extent the JNK pathway.47
Before array analysis, western blot (WB) on lysates was performed to confirm the anticipated changes in these kinases (see Figure S12 Supporting Information). The WBs showed an increased activation/phosphorylation of JNK and p38 in the cells that were stimulated with anisomycin if compared to the untreated ones (control cells). Further, the ERK activation/phosphorylation pathway was confirmed to be increased in cells stimulated with EGF when compared to the control. Two other sets of lysates contained HEK293T cells that have ERK1-WT overexpressed, while one of them was also stimulated with EGF. WB analysis showed that overexpressed ERK-1 was partially phosphorylated. However, induction of the cells with EGF significantly increased its phosphorylation.
Cell lysate expression, purification, and activation, are described in the supporting information. HEK293T cell lysates were prepared in CytoBuster™ Protein Extraction Reagent (EMD-Biosciences) after washing in PBS (Invitrogen). The lysates were cleared by centrifugation, and ATP was washed away using Amicon Ultra-0.5 mL Centrifugal Filters. Bradford analysis (Bio-Rad) was used to measure the protein concentration. Discrimination of cell lysates was obtained at total protein concentration according to Table S4. For the detection, 6 μL of cell lysate was added to the same sensing ensemble and same data analysis was followed.
The LDA score plot (Figure 6A) of the fluorescence data showed excellent differentiation between the cells over-expressing ERK-1 (ERK−), cells over-expressing ERK-1 and induced by EGF (ERK+), and control cells along the F1 and F2 axes, and good clustering of the replicates. This result suggests that the variation of the responses is dependent on protein and phospho-protein identity. Furthermore, the LDA score plot (Figure 6C) of the fluorescence data also showed excellent discrimination of the cells that have ERK induced by EGF (EGF), which are separated along the second principal component (F2) from the cells that have JNK/p38 induced by anisomycin, and separated from the control cells along the first principal component (F1). This differentiation suggests that the sensing array is able to detect subtle changes in phosphoproteins when cells are stimulated with different activators. These cell extracts are classified into respective sets with 100% accuracy according to a jackknife analysis. Another general trend was found (Figure 6A and 6C), where the induced and/or over-expressed cell lysates are located on the right side of the score plot and the control lysates are located on the left side.
Figure 6.

LDA score plots and loading plots of the response from the sensing array showing differentiation of HEK293T cell lysates with differing kinase expression. (A,C) LDA score plots and (B,D) loading plots of the fluorescence response pattern of different sets of stimulated and untreated HEK293T cell lysates with 100% jack knife analysis: control lysate (CL), induced/over-expressed (ERK+), over-expressed (ERK−), JNK induced with anisomycin (Ansio), ERK induction with EGF (EGF).
The loading plots (Figure 6B and 6D) from the analysis showed a broad cross-reactivity from the hosts. In this case, hosts H-1, H-2 and H-3 correspond to the receptors with single ZnR-9, and ZnR-9 with peptides and DTT, which produced a completely different response from hosts H-4 and H-5, which correspond to receptor ZnR-10; and host H-6 and H-7 which encompass receptors ZnR-10 with DTT and ZnR-11, respectively.
Conclusion
In summary, we have shown that an array of self-assembled synthetic and peptidic elements in combination with an IDA protocol provides cross-reactivity for the differentiation of phosphorylation states on kinases. Significantly, this sensing system is capable of fingerprinting different classes of MAP kinases and cell lysates in-vitro at neutral aqueous conditions using chemometric analysis. In this manner, a new pattern recognition approach was derived to target this class of analyte. The ability of this sensing ensemble to differentiate cells that have been induced with different stimulants increases our expectation for the ability of this array to differentiate between different types of cells, such as cells from diseased and non-diseased tissues or even cells from different organs.
Supplementary Material
Figure 2.

Chemical structures of coumarin-based indicator 8 and bis-Zn(DPA) chemosensors ZnR-9, ZnR-10, and ZnR-11.
Acknowledgments
This work was supported by NSF grant (CHE-1212971) and Welch Foundation (F-1151) to Dr. Eric V. Anslyn. We also acknowledge CONACYT fellowship 212537 to Diana Zamora-Olivares. Tamer S. Kaoud is supported by a postdoctoral trainee fellowship from Cancer Prevention Research Institute of Texas (CPRIT). This research was also supported by the grants from the Welch Foundation (F-1390) and NIH (GM059802 and CA167505) to Dr. Kevin Dalby.
ABBREVIATIONS
- DTT
dithiothreitol
- DPA
dipicolylamine
- MAPK
mitogen-activated protein kinase
- ERK
extracellular signal-regulated protein kinase
- SAPK
Stress-activated protein
- JNK
c-Jun N-terminal kinase
- sub-F
YAEPLTPRILAKWEWPA
- HEPES
N-(2-hydroxyethyl)-piperazine-N′-2-ethanesulfonic acid
- EGF
epidermal growth factor
- WB
western blot
- IDA
indicator displacement assay
- LDA
linear discriminant analysis
Footnotes
Author Contributions
All authors have given approval to the final version of the manuscript.
Supporting Information Available: Detail synthetic procedures, product characterization and experimental details. This information is available free of charge via the Internet at http://pubs.acs.org.
References
- 1.Manning G, Whyte DB, Martinez R, Hunter T, Sudarsanam S. Science. 2002;298:1912–1934. doi: 10.1126/science.1075762. [DOI] [PubMed] [Google Scholar]
- 2.Johnson GL, Lapadat R. Science. 2002;298:1911–1912. doi: 10.1126/science.1072682. [DOI] [PubMed] [Google Scholar]
- 3.Roskoski R., Jr Pharmacol Res. 2012;66:105–143. doi: 10.1016/j.phrs.2012.04.005. [DOI] [PubMed] [Google Scholar]
- 4.Platanias LC. Blood. 2003;101:4667–4679. doi: 10.1182/blood-2002-12-3647. [DOI] [PubMed] [Google Scholar]
- 5.Junttila MR, Li SP, Westermarck J. FASEB J. 2008;22:954–965. doi: 10.1096/fj.06-7859rev. [DOI] [PubMed] [Google Scholar]
- 6.Pearson G, Robinson F, Beers Gibson T, Xu B-e, Karandikar M, Berman K, Cobb MH. Endocrine Rev. 2001;22:153–183. doi: 10.1210/edrv.22.2.0428. [DOI] [PubMed] [Google Scholar]
- 7.Bonetta L. Nat Meth. 2005;2:225–232. [Google Scholar]
- 8.Kinoshita E, Kinoshita-Kikuta E, Koike T. Nat Protocols. 2009;4:1513–1521. doi: 10.1038/nprot.2009.154. [DOI] [PubMed] [Google Scholar]
- 9.Takahashi M, Kawamura A, Kato N, Nishi T, Hamachi I, Ohkanda J. Angew Chem, Int Ed. 2012;51:509–512. doi: 10.1002/anie.201106995. [DOI] [PubMed] [Google Scholar]
- 10.Wang Q, Lawrence DS. J Am Chem Soc. 2005;127:7684–7685. doi: 10.1021/ja050789j. [DOI] [PubMed] [Google Scholar]
- 11.Lu HSC, Liu K, Tan LP, Yao SQ. Chem–Eur J. 2012;18:28–39. doi: 10.1002/chem.201103206. [DOI] [PubMed] [Google Scholar]
- 12.Hargrove AE, Nieto S, Zhang T, Sessler JL, Anslyn EV. Chem Rev. 2011;111:6603–6782. doi: 10.1021/cr100242s. [DOI] [PMC free article] [PubMed] [Google Scholar]
- 13.Shults MD, Carrico-Moniz D, Imperiali B. Anal Biochem. 2006;352:198–207. doi: 10.1016/j.ab.2006.03.003. [DOI] [PubMed] [Google Scholar]
- 14.Luković E, Gonzáez-Vera JA, Imperiali B. J Am Chem Soc. 2008;130:12821–12827. doi: 10.1021/ja8046188. [DOI] [PMC free article] [PubMed] [Google Scholar]
- 15.Drewry JA, Gunning PT. Coord Chem Rev. 2011;255:459–472. [Google Scholar]
- 16.Sakamoto T, Ojida A, Hamachi I. Chem Commun. 2009:141–152. doi: 10.1039/b812374h. [DOI] [PubMed] [Google Scholar]
- 17.Ojida A, Mito-oka Y, Inoue M-a, Hamachi I. J Am Chem Soc. 2002;124:6256–6258. doi: 10.1021/ja025761b. [DOI] [PubMed] [Google Scholar]
- 18.Ojida A, Mito-oka Y, Sada K, Hamachi I. J Am Chem Soc. 2004;126:2454–2463. doi: 10.1021/ja038277x. [DOI] [PubMed] [Google Scholar]
- 19.Anai T, Nakata E, Koshi Y, Ojida A, Hamachi I. J Am Chem Soc. 2007;129:6232–6239. doi: 10.1021/ja0693284. [DOI] [PubMed] [Google Scholar]
- 20.Wright AT, Anslyn EV. Chem Soc Rev. 2006;35:14–28. doi: 10.1039/b505518k. [DOI] [PubMed] [Google Scholar]
- 21.Anslyn EV. J Org Chem. 2007;72:687–699. doi: 10.1021/jo0617971. [DOI] [PubMed] [Google Scholar]
- 22.Collins BE, Anslyn EV. Chem– Eur J. 2007;13:4700–4708. doi: 10.1002/chem.200700153. [DOI] [PubMed] [Google Scholar]
- 23.Wright AT, Griffin MJ, Zhong Z, McCleskey SC, Anslyn EV, McDevitt JT. Angew Chem, Int Ed. 2005;44:6375–6378. doi: 10.1002/anie.200501137. [DOI] [PubMed] [Google Scholar]
- 24.Zhou H, Baldini L, Hong J, Wilson AJ, Hamilton AD. J Am Chem Soc. 2006;128:2421–2425. doi: 10.1021/ja056833c. [DOI] [PubMed] [Google Scholar]
- 25.Margulies D, Hamilton AD. Angew Chem, Int Ed. 2009;48:1771–1774. doi: 10.1002/anie.200804887. [DOI] [PubMed] [Google Scholar]
- 26.Moyano DF, Rana S, Bunz UHF, Rotello VM. Faraday Discuss. 2011;152:33–42. doi: 10.1039/c1fd00024a. [DOI] [PMC free article] [PubMed] [Google Scholar]
- 27.De M, Rana S, Akpinar H, Miranda OR, Arvizo RR, Bunz UHF, Rotello VM. Nat Chem. 2009;1:461–465. doi: 10.1038/nchem.334. [DOI] [PMC free article] [PubMed] [Google Scholar]
- 28.Zhang T, Edwards NY, Bonizzoni M, Anslyn EV. J Am Chem Soc. 2009;131:11976–11984. doi: 10.1021/ja9041675. [DOI] [PubMed] [Google Scholar]
- 29.Shi B, Stevenson R, Campopiano DJ, Greaney MF. J Am Chem Soc. 2006;128:8459–8467. doi: 10.1021/ja058049y. [DOI] [PubMed] [Google Scholar]
- 30.Shi B, Greaney MF. Chem Commun. 2005:886–888. doi: 10.1039/b414300k. [DOI] [PubMed] [Google Scholar]
- 31.Schmidt TJ, Lyß G, Pahl HL, Merfort I. Bioorg Med Chem. 1999;7:2849–2855. doi: 10.1016/s0968-0896(99)00234-5. [DOI] [PubMed] [Google Scholar]
- 32.Rim C, Lahey LJ, Patel VG, Zhang H, Son DY. Tetrahedron Lett. 2009;50:745–747. [Google Scholar]
- 33.Umali AP, Anslyn EV. Curr Opin Chem Biol. 2010;14:685–692. doi: 10.1016/j.cbpa.2010.07.022. [DOI] [PMC free article] [PubMed] [Google Scholar]
- 34.Waas WF, Dalby KN. J Biol Chem. 2002;277:12532–12540. doi: 10.1074/jbc.M110523200. [DOI] [PubMed] [Google Scholar]
- 35.Callaway K, Waas WF, Rainey MA, Ren P, Dalby KN. Biochemistry. 2010;49:3619–3630. doi: 10.1021/bi100199q. [DOI] [PMC free article] [PubMed] [Google Scholar]
- 36.Lee S, Warthaka M, Yan C, Kaoud TS, Ren P, Dalby KN. Biochemistry. 2011;50:9500–9510. doi: 10.1021/bi201103b. [DOI] [PMC free article] [PubMed] [Google Scholar]
- 37.Nguyen BT, Anslyn EV. Coord Chem Rev. 2006;250:3118–3127. [Google Scholar]
- 38.Pia¸tek AM, Bomble YJ, Wiskur SL, Anslyn EV. J Am Chem Soc. 2004;126:6072–6077. doi: 10.1021/ja040006e. [DOI] [PubMed] [Google Scholar]
- 39.Kitamura M, Shabbir SH, Anslyn EV. J Org Chem. 2009;74:4479–4489. doi: 10.1021/jo900433j. [DOI] [PubMed] [Google Scholar]
- 40.Hanshaw RG, Hilkert SM, Jiang H, Smith BD. Tetrahedron Lett. 2004;45:8721–8724. [Google Scholar]
- 41.Horie S, Kubo Y. Chem Lett. 2009;38:616–617. [Google Scholar]
- 42.Lefloch R, Pouysséur J, Lenormand P. Mol Cell Biol. 2008;28:511–527. doi: 10.1128/MCB.00800-07. [DOI] [PMC free article] [PubMed] [Google Scholar]
- 43.Brand U, Vahrenkamp H. Chem Ber. 1996;129:435–440. [Google Scholar]
- 44.Jurs PC, Bakken GA, McClelland HE. Chem Rev. 2000;100:2649–2678. doi: 10.1021/cr9800964. [DOI] [PubMed] [Google Scholar]
- 45.Gong G. J Am Stat Assoc. 1986;81:108–113. [Google Scholar]
- 46.Rosser EM, Morton S, Ashton KS, Cohen P, Hulme AN. Org Biomol Chem. 2004;2:142–149. doi: 10.1039/b311242j. [DOI] [PubMed] [Google Scholar]
- 47.zu Schwabedissen HEM, Grube M, Dreisbach A, Jedlitschky G, Meissner K, Linnemann K, Fusch C, Ritter CA, Vöker U, Kroemer HK. Drug Metab Dispos. 2006;34:524–533. doi: 10.1124/dmd.105.007591. [DOI] [PubMed] [Google Scholar]
Associated Data
This section collects any data citations, data availability statements, or supplementary materials included in this article.