

Abstract
Mass spectrometry (MS) provides rapid and quantitative identification of protein species with relatively low sample consumption. Yet with the trend toward biological analysis at increasingly smaller scales, ultimately down to the volume of an individual cell, MS with few-to-single molecule sensitivity will be required. Nanoelectromechanical systems (NEMS) provide unparalleled mass sensitivity, which is now sufficient for the detection of individual molecular species in real time. Here we report the first demonstration of MS based on single-biological-molecule detection with NEMS. In our NEMS-MS system, nanoparticles and protein species are introduced by electrospray injection from fluid phase in ambient conditions into vacuum and subsequently delivered to the NEMS detector by hexapole ion optics. Precipitous frequency shifts, proportional to the mass, are recorded in real time as analytes adsorb, one-by-one, onto a phase-locked, ultrahigh frequency NEMS resonator. These first NEMS-MS spectra, obtained with modest mass sensitivity from only several hundred mass adsorption events, presage the future capabilities of this approach. We also outline the substantial improvements that are feasible in the near term, some of which are unique to NEMS-MS.
Nanoelectromechanical systems (NEMS)1 are enabling important emerging applications in diverse fields ranging from quantum measurement to biotechnology2-9. In general, the smaller a device, the more susceptible are its physical properties to perturbation by external influences. This enhanced sensitivity of NEMS is opening a variety of unprecedented opportunities for applications such as mass spectrometry, a preeminent methodology for proteomics10,11. Furthermore, to reliably detect expression of low level signals and to understand the fundamental biological processes, it is important to develop techniques capable of single cell or single molecule analyses12,13. In this work, the exceptional mass sensitivity of ultra high frequency (UHF) NEMS resonators14-18 – derived from their miniscule masses, high frequencies, and high resonance quality factors – is used to demonstrate a new paradigm for mass spectrometry. Our approach enables the first real-time detection of individual protein molecules and nanoparticles as they adsorb upon a sensitive NEMS detector. We use these to carry out an initial form of mass spectrometry based on discrete adsorption events.
The vibrational frequency of a NEMS resonator is an exquisitely sensitive function of its total mass. Small variations in mass, for example, from adsorbed addenda, can measurably alter its resonant frequency. Theoretical calculations for physically-realizable devices indicate that NEMS mass sensitivity below a single Dalton (1Da=1amu) is achievable19,20. Experimental measurements of NEMS mass sensing at the ∼1000Da level17,21 and, more recently, below 200Da level22,23 have been demonstrated. Our NEMS-MS paradigm is also quite distinct from existing approaches to mass spectrometry in that the inertial mass of each arriving species – atom, molecule, or nanoparticle – is “weighed” as the analyte adsorbs upon the detector. Hence, a mass analyzer is not needed to pre-separate and aggregate similar species. In fact, it is possible to contemplate circumventing analyte ionization entirely if alternative injection and transport methods for neutral species are employed. This may offer significant advantages for whole-protein MS of high-mass species by circumventing electrostatic fragmentation. It should also dramatically reduce analyte consumption by permitting the mass detector to be positioned in close proximity to the protein source. The singular advantage of NEMS-MS is that each NEMS sensor in the single-molecule limit acts an individual mass spectrometer. This NEMS-based system, combined with other micro- and nanoscale technology24,25 offers the possibility of compact, massively-parallel MS, limited only by the number of NEMS mass sensors incorporated on a chip.
NEMS-based Mass Spectrometry
Typically mass spectrometers comprise three separate components to provide the critical functions of operation: analyte ionization, analyte separation, and detection. First, analyte species in the fluid phase are ionized and bare (unsolvated) ions are produced using electrospray ionization (ESI)26,27. Second, ion separation is undertaken in vacuum based on the charge-to-mass (m/z) ratio of the analytes. Third, detection of clustered groups of these analytes with similar m/z is carried out to determine the presence of a given species. Our new paradigm of NEMS-MS combines the latter two of these functions into one: the NEMS sensor is employed as both mass analyzer and mass detector. This NEMS mass analyzer/detector, in this first realization described here, is preceded by well-validated mass spectrometry components for analyte injection and delivery. Figure 1 schematically depicts our prototype experimental system that introduces, transports, and measures the mass of analytes. Protein ions or charged nanoparticles are produced and stripped of fluidic solvent in the course of ESI. These bare ions traverse through a two-stage differentially pumped vacuum system and land onto the NEMS mass analyzer/detector situated about 2 meters away from the ESI source. Two stages of hexapole ion optics28 driven at radio frequency (an RF-only hexapole) is used to guide the species to the NEMS with minimal m/z discrimination, as desired (Supplementary Information). As the individual protein molecules and nanoparticles arrive and accrete onto the NEMS sensor, its resonant frequency jumps downward abruptly with each individual molecular or nanoparticle adsorption event (Fig. 2). These precipitous events, which are absent during the control runs (Supplementary Information), are the hallmark of NEMS mass sensing with single-molecule (-nanoparticle) sensitivity. They are observed here directly for the first time, and are the centerpiece of this work.
Figure 1. First-generation NEMS-MS system.
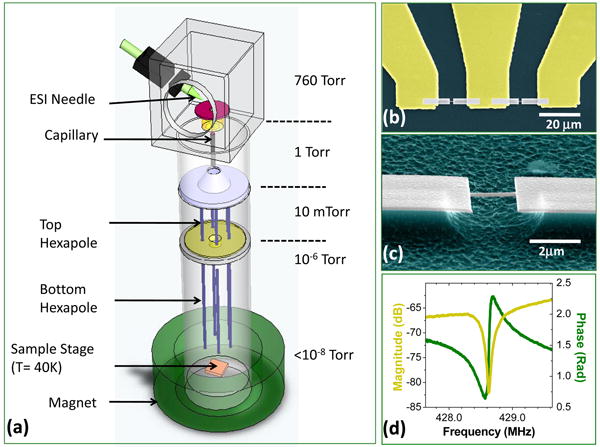
(a) Simplified schematic of the experimental configuration (not to scale), showing the fluid-phase electrospray ionization and injection, the system's two-stage differential pumping, and its two-stage ion optics. (b, c) Progressively magnified scanning electron micrographs showing one of the doubly-clamped beam NEMS devices used in these experiments. It is embedded in a nanofabricated three-terminal UHF bridge circuit. (d) Magnitude and phase of the UHF NEMS resonator's response displaying a prominent fundamental-mode resonance near 428MHz.
Figure 2. Real-time records of single-molecule adsorption events upon a NEMS mass sensor.
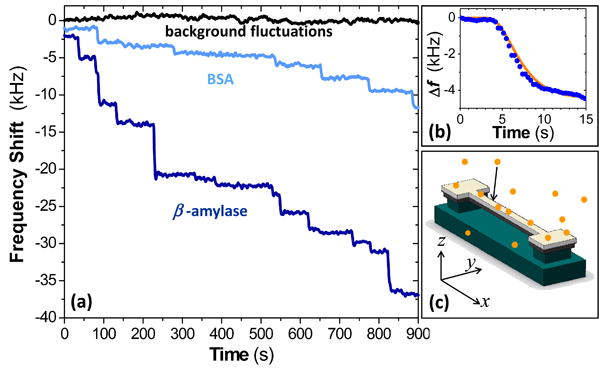
(a) This raw experimental data shows the distinctly-different, precipitous resonance frequency shifts of the NEMS during ESI-induced adsorption of bovine serum albumin (BSA, 66kDa) and β-amylase (200kDa). Each frequency jump downward is due to an individual protein adsorption event on the NEMS mass sensor. The height of each frequency jump is a convolved function of the mass of the protein that has adsorbed, and its position of adsorption upon the NEMS. (b) Raw data from a typical discrete event (blue dots), and a non-linear least square fit to the system's response (orange line), based on the temporal response function of the control loop. (c): Schematic illustrating single-molecule adsorption events on a NEMS resonator (orange circles), and the coordinate system used to define its position-dependent mass responsivity. The device itself is comprised of silicon carbide (dark grey) with a metallic layers (light gray) on top. The silicon substrate (green) beneath the SiC is etched to release (suspend) the doubly clamped beam.
Each quasi-instantaneous frequency jump provides information about the specific atom, molecule, or nanoparticle that has just adsorbed onto the sensor. The jump height for each event – that is, the resonator's adsorbate-induced frequency deviation – depends upon both the mass of the arriving analyte and its position-of-adsorption upon the NEMS resonator. This response is characterized by a position-dependent mass responsivity for the NEMS resonator (Supplementary Information).
Single-Molecule Event Analysis
There are two ways that we can extract the adsorbate mass from the convolved mass- and position-dependence of these adsorption-induced jumps. The more difficult to achieve, but conceptually most transparent, is to orchestrate simultaneous measurement of both jump-height and landing position for each species as it arrives, in real time. We shall return to discuss this option below. For our first proof-of-principle demonstration reported here, we take a second, simpler approach – that of building histograms of event probability versus frequency-shift amplitude for small ensembles of sequential single-molecule or single-nanoparticle adsorption events. Figure 3a shows event probabilities calculated for sequential adsorption events originating from a monodisperse source of nanoparticles and their subsequent measurement by a NEMS detector. We assume the resonant mass detector to be a doubly-clamped beam operating in fundamental mode, as in our experiments, and we scale the results to correspond both to our experimentally-established NEMS mass responsivity and Au nanoparticles we've employed, which have a nominal ∼2.5nm radius (see below). Figure 3a shows both the ideal case (zero nanoparticle size dispersion and perfect mass sensitivity) as well as more realistic experimental situations that include both the effects of finite size dispersion and the detector's frequency-fluctuation noise. Together these latter effects reduce the resolution available in a practical system. It is readily apparent from Figure 3 that the “canonical” event-probability response is bicuspid, with cusps near zero and at a specific, maximum frequency shift that is associated with adsorption events at the central, most sensitive region of the beam vibrating in fundamental mode. Below, we shall employ this characteristic fundamental-mode event-probability shape function to achieve mass analysis in these first NEMS-MS efforts.
Figure 3. NEMS mass spectrometry of a gold nanoparticle dispersion.
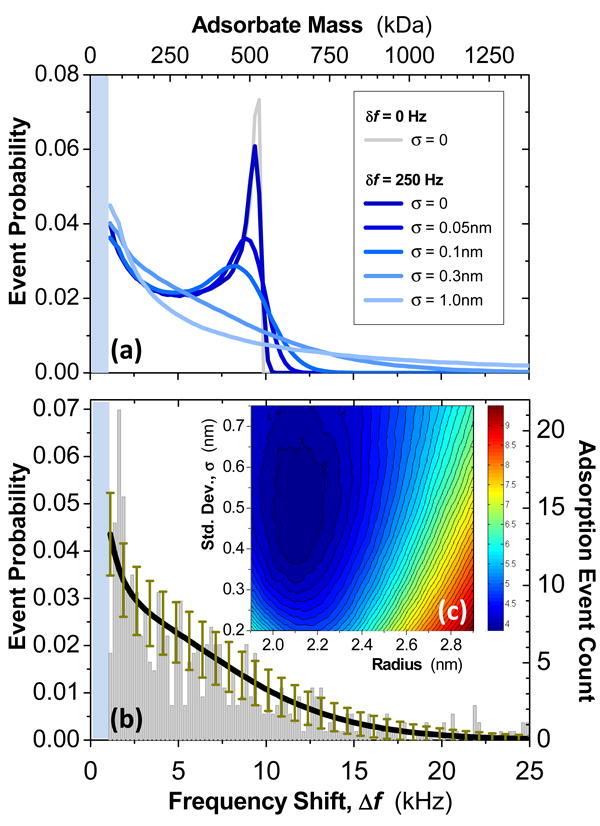
(a) Theoretically expected event probabilities versus frequency-jump amplitudes are shown for “nominal” 2.5nm radius Au nanoparticles (modeled assuming a 2.15 nm mean radius), delivered with an average flux that is uniformly distributed over a doubly-clamped beam having peak mass responsivity ∼12Hz/zg. Traces show expected results for a monodisperse ensemble of particles, as well as for several dispersions (characterized by their radius standard deviations), for the cases of perfect (0Hz) and experimentally-relevant (250Hz) frequency resolutions. (b) Experimentally obtained histogram of adsorption event probabilities versus frequency-jump amplitude for electrosprayed gold nanoparticles, and the expected curve for a average radius of 2.15nm and a radial dispersion of 0.375nm (black trace). Error bars (dark yellow) display the theoretically-expected deviations corresponding to 544 adsorption events, as registered in this experiment. (c) Contour plot showing the residues for least-square fits to the experimental data using radius and radial dispersion as the fitting parameter. These data establish the average radius and size dispersion for the 544 nanoparticles measured.
NEMS-MS Spectra
We report here the first NEMS-MS spectra for proteins and nanoparticles. Our analyses are carried out by observing, for each species introduced by electrospray, several hundred discrete and abrupt frequency shifts in real time – each associated with an individual protein or nanoparticle adsorption event. Each ESI run is followed by a control run of equal duration during which the ESI solution pump is shut off to establish the frequency-fluctuation background (Supplementary Information). Given the ∼250 Hz resolution in these measurements, we construct event probability histograms with 250 Hz bins and, as mentioned, reject false positives arising from frequency-fluctuation noise by discarding jumps smaller than 2σ (=500Hz).
Figure 3b shows an experimental histogram constructed from data obtained by electrospraying a colloidal solution of gold nanoparticles (Supplementary Information). The Au nanoparticles employed are characterized by the vendor as having average radius of 2.5nm and standard deviation of “less than” 0.375nm (Sigma-Aldrich). What is ostensibly a small standard deviation in radius actually corresponds to a rather large spread in nanoparticle mass; the advertised specifications translate to an average mass of ∼780kDa and 1σ mass range from 480kDa to 1190kDa. This substantial dispersion, and our finite frequency-fluctuation noise, together result in significant smoothing of the canonical bicuspid spectrum expected for the ideal case (Fig. 3a).
Figure 3c shows the residues for a two-parameter least-squares fit of a theoretical event-probability curve to the experimental histogram data. The two fitting parameters are average nanoparticle radius and its dispersion; the theoretical curve incorporates the experimentally-measured frequency-shift resolution of δf ∼250Hz. With this approach, by recording just 544 individual nanoparticle adsorption events, we resolve an average nanoparticle radius of 2.15nm for the dispersion, corresponding to an average mass of 490kDa, with a standard deviation of nanoparticle radius of 0.5nm.
Figure 4 shows NEMS-MS spectra obtained for a “nominally pure” solution of the protein bovine serum albumin (“BSA”, 66kDa) (Supplementary Information). From the standpoint of MS, pure solutions of protein are the exception rather than the rule 29,30, and the NEMS-MS spectra of Figure 4 bear out this truism. Protein molecules often aggregate in solution to form oligomers (Supplementary Information), and each distinct molecular assemblage present in the sample will produce its own characteristic bicuspid NEMS-MS histogram. A multi-component solution of such oligomers will thus superpose to produce a complex spectrum.
Figure 4. NEMS mass spectrometry of proteins.
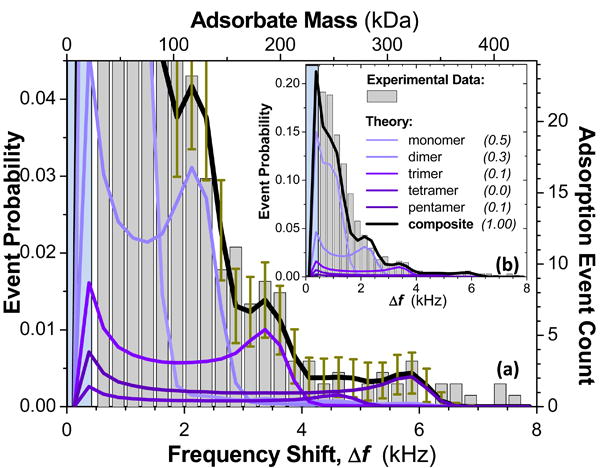
NEMS-MS of bovine serum albumin (BSA) enabled by adsorption-event probability analysis. Experimentally obtained frequency-jump data are binned into 250Hz histograms commensurate with the experimental mass sensitivity. Applying a 2σ detection criterion, we reject data below 500Hz (blue-shaded regions; see text). (a) Expanded view of the low-event-probability region displaying a clearly detailed decomposition of the simultaneous contributions from oligomers. The theoretical composite curve (grey) is a weighted superposition of adsorption probabilities of the intact monomer and a family of its oligomers deterministically calculated by a least-squares process similar to that of Figure 3 (Supplementary Information). (b) Full view of entire data set for the 578 BSA molecular adsorption events recorded in this experiment. The numerically-determined best-fit weighting coefficients for the composite curve are displayed in the legend.
The presence of a family of oligomers has two significant effects on the shape of NEMS-MS histograms. First, the low-frequency-shift cusps for each of the oligomers (occurring at the same, zero, frequency shift) superpose to produce a single, prominent peak. Second, the high frequency-shift cusps of the oligomers, which occur at different frequency shifts corresponding to each specific component's mass, become engulfed in the tails from other components. This tends to suppress their overall individual prominence. Figure 4a and 4b illustrate event probabilities as a function of frequency shift for electrosprayed BSA ions that are transported to the NEMS sensor with a hexapole drive frequency of 1.1MHz. For comparison, also shown are theoretically expected event probabilities for BSA oligomers, generated using the experimentally-measured NEMS sensor's mass responsivity of ∼12 Hz/zg and using a least-squares fit to the data – similar to that employed for the Au nanoparticle dispersion, but here implemented to extract the spectral weights for the first five oligomers (Supplementary Information). The spectrum in Figure 4a shows clear peaks at 3375 Hz and 5875Hz, assigned to BSA trimers and pentamers, respectively. The broadly-distributed spectral weight below 2 kHz, arises from monomers and dimers. Note that this full spectrum has been obtained by recording the individual adsorption of only 578 BSA molecules.
Prospects for NEMS-MS
We believe these initial results demonstrate the potential of NEMS for mass spectrometry and provide an unequivocal proof-of-principle for real-time detection of individual proteins and nanoparticles. The full capabilities and sensitivity of the new NEMS-MS paradigm will more fully unfold in a second-generation realization providing both mass- and position- sensing in real time, for each analyte molecule as it arrives. This approach will completely obviate the need for the histogram-based analyses used in the first demonstrations reported here. The procedure for simultaneous mass and position sensing exists31,32, and has been experimentally proven at the microscale31. In automated, real-time form, it involves the simultaneous excitation, locking, and frequency-tracking of multiple vibrational modes of the resonant NEMS mass sensor. As each analyte adsorbs onto the sensor, it induces a distinct frequency shift for each of the modes monitored. The combined information from the time-correlated shifts from just two modes provides sufficient information to deconvolve the adsorbate's mass and position for each event as it occurs. Tracking additional modes over-determines the solution, providing reduced variance in the deduced values of particle mass and position-of-adsorption. This added technological component will permit the mass of each arriving molecule to be quantitatively measured in real time as it adsorbs upon the NEMS, down to the sensitivity limit imposed by the mass noise floor.
We outline below the anticipated capabilities of NEMS-MS vis-à-vis other current techniques.
Mass resolution
Mass resolution in current implementations of MS typically is defined as the ratio of the m/z value and the width of the mass peaks at half maxima. The best mass resolution is obtained with Fourier transform mass spectrometry (FTMS) systems which attain mass resolutions of order 2,000,000 with typical measurement times of about a second. The resolution in FTMS is high at low m/z, but becomes progressively worse with higher m/z. Unlike the current MS systems which measure the mass to charge ratio, NEMS devices measure the mass of the molecule directly. Attaining mass sensitivity of 1 Dalton (Da) with a NEMS device20 will provide the ability to distinguish two species differing by a single Da. For a 1 kDa molecule, this would be equivalent to a mass resolution of 1000, however NEMS-MS is capable of measuring molecules greatly exceeding the 1 MDa, which means state-of-the-art mass resolution is attainable. With longer measurement times the mass sensitivity can be further enhanced. The upper limit of the mass sensitivity is set by noise sources such as 1/f fluctuations and long term drifts, which always become predominant at long measurement times. The state-of-the-art of mass sensing with NEMS devices has been improving roughly by about an order of magnitude per year for the last several years; the current record is approaching 100 Da14,15,17,22,23. The ultimate limits imposed by thermodynamically-driven fluctuation processes have also been theoretically established to be comfortably below 1 Da19,20 for measurement times in the ten millisecond range.
Mass accuracy
Mass accuracy is the ability of the instrument to accurately establish the absolute mass/charge (mass in NEMS MS) of the species and is usually expressed in parts per million. A NEMS device with single Dalton mass sensitivity, calibrated with an appropriate mass standard, will have a mass accuracy of 100ppm for a 10kDa molecule. In NEMS-MS the accuracy increases in direct proportion to the the mass of the analyte molecule.
Mass or m/z range
NEMS devices have a exceptionally large mass dynamic range. These devices can easily measure biomolecules with mass of tens of MDa and still be sensitive enough to detect mass changes of single Dalton. The upper limit on the mass is set by the mass of the NEMS device itself. Depending upon the details of adsorption, the properties of the NEMS become affected only when the mass accreted becomes comparable to that of the device itself. This translates into an upper mass limit of hundreds of MDa for typical devices15,20. The lower mass limit in the case of detection of large biomolecules may ultimately become limited by the spatial extent of the molecule compared to that of the NEMS sensor.
Scan speed
NEMS devices, in principle, are capable of mass sensitivities of single Dalton for measurement (integration) times in the tens millisecond range. Additionally, in future NEMS-MS systems, species of all m/z or masses will be measured simultaneously using arrays of NEMS devices.
Efficiency of protein transport from the source to the NEMS detector
As mentioned, the NEMS-MS system combines the role of analyzer and the detector into a single unit. This enables a significant reduction in the distance between the protein source and the detector, and thus a corresponding improvement in the efficiency of the transport and capture. In the so-called “nanoESI”-MS systems, for instance, efficiencies as high as 10% have been observed33. Loss of analyte molecules arises from a combination of factors such as incomplete desolvation, transmission losses through the ion optics, and detection inefficiency. We anticipate that future NEMS-MS systems will be based upon arrays of NEMS devices to provide maximal capture efficiency.
Parallel processing of the mass information
In NEMS-based MS systems each NEMS device acts as an individual mass sensor. Here the capture cross sectional area has dimensions of approximately 100nm × 1000nm. This small cross-section has implications for the parallel-processing abilities of such a system. In 100 seconds, a modest NEMS-MS system consisting of 1,000 devices could quantitatively process 1,000 × 100 molecules/sec × 100 sec = 10 million molecules. Integration densities that greatly exceed this have already been realized34. This throughput should be sufficient for intensive analyses, for example, on individual mammalian cells.
Enhancing NEMS-MS efficiency
Transitioning previous demonstrations of NEMS mass sensing, carried out under controlled laboratory conditions, into practical and useful realizations of NEMS-based biological and chemical mass spectrometry – with the potential to process thousands of proteins in tens of milliseconds using only picoliters of sample – will require surmounting challenges in nanoscale systems integration. In future implementations, analytes must be delivered from aqueous phase, stripped of solvent – then delivered to and captured with high efficiency by the NEMS sensor. More challenging will be attaining high capture efficiency; this necessitates a mass detector with large capture cross-section. Given the minute size of nanoscale detectors, this will be possible only through use of large sensor arrays positioned in relatively close proximity to the analyte injection point. This will require practical routes to very-large-scale integration of NEMS. It is also clearly essential to increase sample throughput in future-generation NEMS-MS systems. The NEMS-MS paradigm is exceptionally well-suited to these ends: highly multiplexed configurations involving, potentially, thousands of injectors and detectors can each be co-integrated with microfluidic pre-analysis and delivery components to create a system capable of efficiently analyzing minute total volumes down to that of an individual cell. For the foreseeable future, we believe that the recent advances in top-down wafer-scale nanofabrication processes provide the only viable avenue to the requisite level of systems complexity. Accordingly, our current work toward the advancement of NEMS-MS is focused upon NEMS arrays fabricated in this manner 34.
Methods
Protein/nanoparticle detection and frequency jump extraction
To accommodate the stochastic sequential arrival of individual protein molecules or nanoparticles we automate our real-time analysis process. This involves two separate procedures. First, we continuously track resonant frequency in real time, using a low-noise UHF phase-locked loop (PLL) while protein ions or charged nanoparticles are injected by electrospray and delivered to the NEMS sensor by the ion optics. Figure 2 shows a typical experimental time record of the changes in resonant frequency of a phase-locked NEMS mass sensor under such conditions. Note that each abrupt frequency jump downward is the result of a single protein molecule or nanoparticle landing on the NEMS mass sensor. Second, we automate the numerical extraction of the jump heights (frequency shifts) for each individual adsorption event observed in these time records. Our procedure is to reject jumps smaller than twice the frequency resolution of the phase-locked NEMS sensor, since any such smaller events will be increasingly biased by false counts associated with the “noise floor” set by the frequency instability of the phase-locked NEMS resonator. In our current measurements this instability is characterized by a typical Allan deviation of σA(τ)∼2×10⁻⁷, for measurement integration times, τ, of order several seconds. This corresponds to a one-standard-deviation frequency resolution of δf∼250Hz and mass noise floor of ∼10kDa in the experiments (Supplementary Information). For the remaining events, identified by our automated and unbiased numerical procedure as experimentally-significant (Δf ≥ 2 × δf), we extract their corresponding jump heights (frequency shifts). This involves fitting the time record of each jump to the known temporal step-response function for our phase-locked NEMS system using a nonlinear least-square fit. The response function is separately calculated by PLL circuit theory, and has been experimentally verified, separately, for each NEMS mass sensor employed in this work.
Physisorption
To ensure stable adsorption and immobilization of individual proteins on the NEMS detector, the detector stage is maintained at a temperature of ∼40K in vacuo. At reduced temperature, physisorption due to van der Waals forces insures the proteins or nanoparticles adsorb, and become immobilized, upon the detector's surface. Note that detector cooling is required primarily for stable protein adsorption, not for enhanced noise performance. Physisorption is also an ideal method for analyte immobilization in that it is non-specific and it enables detector “recycling” by periodically warming the NEMS sensor to desorb accreted species.
Measurement electronics
The detection circuitry utilizes a bridge circuit to null the UHF background near theNEMS resonance14,16-18 and a frequency-modulated, phase-locked loop (FM-PLL) to track the NEMS resonant frequency in real time15. For the very low particle flux employed in this initial work, a PLL time constant of several seconds ensures each abrupt frequency jump event is recorded with many data points (Fig. 2, right inset). We determine the temporal stability of the PLL system and characterize the frequency-fluctuation noise background by operating in phase-lock over extended intervals (≫1000s), both with and without the activation of ESI. Next-generation NEMS-MS systems, by incorporating recent advances in NEMS mass sensors 17, will be capable of significantly enhanced mass sensitivity.
We also monitor ion current reaching the detector stage with a Faraday cup placed in close proximity to the NEMS detector that is connected to a high-resolution electrometer. In this first-generation prototype, we do not attempt to demonstrate the potential of high throughput NEMS-MS; the present system configuration provides a conveniently-infrequent analyte arrival rate at the NEMS sensor. A typical current of ∼1pA observed at the Faraday detector yields about two adsorption events per minute.
Supplementary Material
Acknowledgments
We gratefully acknowledge support from the NIH under grant R21-GM072898 and, indirectly, from DARPA/MTO under DOI/NBCH1050001 (MGA program) and SPAWAR/N66001-02-1-8914 (CSAC program). The latter has enabled development of critical NEMS technology for this work. We thank S. Stryker for expert technical assistance in constructing the NEMS-MS system; C.A. Zorman and M. Mehregany for custom SiC epilayers used in our NEMS fabrication; V. Semenchenko, D. A. Van Valen and R. Philips for help with gel electrophoresis, and I. Bargatin, J.L. Beauchamp, W. Lee, E.B. Myers, and M. Shahgoli for helpful discussions.
Footnotes
Author Contributions: A.K.N. and M.S.H. fabricated devices, performed experiments, analyzed results and did some simulations. W.K.H. designed and assembled the system and performed initial experiments. X.L.F. made devices and did the initial phase locked loop measurements. M.L.R. conceived of the project and provided overall guidance throughout. All authors discussed results and were involved in the analyses and manuscript preparation.
Supplementary Information accompanies this paper at www.nature.com/nanotechnology. Correspondence and requests for additional materials should be requested to M.L.R.
References and notes
- 1.Roukes ML. Nanoelectromechanical systems face the future. Phys World. 2001 Feb;14:25–31. [Google Scholar]
- 2.Naik A, et al. Cooling a nanomechanical resonator with quantum back-action. Nature. 2006;443:193–196. doi: 10.1038/nature05027. [DOI] [PubMed] [Google Scholar]
- 3.Burg TP, Manalis SR. Suspended microchannel resonators for biomolecular detection. Appl Phys Lett. 2003;83:2698–2700. [Google Scholar]
- 4.LaHaye MD, Buu O, Camarota B, Schwab KC. Approaching the quantum limit of a nanomechanical resonator. Science. 2004;304:74–77. doi: 10.1126/science.1094419. [DOI] [PubMed] [Google Scholar]
- 5.Thompson JD, et al. Strong dispersive coupling of a high-finesse cavity to a micromechanical membrane. Nature. 2008;452:72–75. doi: 10.1038/nature06715. [DOI] [PubMed] [Google Scholar]
- 6.Rugar D, Budakian R, Mamin HJ, Chui BW. Single spin detection by magnetic resonance force microscopy. Nature. 2004;430:329–332. doi: 10.1038/nature02658. [DOI] [PubMed] [Google Scholar]
- 7.Schwab K, Henriksen EA, Worlock JM, Roukes ML. Measurement of the quantum of thermal conductance. Nature. 2000;404:974–977. doi: 10.1038/35010065. [DOI] [PubMed] [Google Scholar]
- 8.Burg TP, et al. Weighing of biomolecules, single cells and single nanoparticles in fluid. Nature. 2007;446:1066–1069. doi: 10.1038/nature05741. [DOI] [PubMed] [Google Scholar]
- 9.Ilic B, Yang Y, Craighead HG. Virus detection using nanoelectromechanical devices. Appl Phys Lett. 2004;85:2604. [Google Scholar]
- 10.Domon B, Aebersold R. Mass spectrometry and protein analysis. Science. 2006;312:212–217. doi: 10.1126/science.1124619. [DOI] [PubMed] [Google Scholar]
- 11.Aebersold R, Mann M. Mass spectrometry-based proteomics. Nature. 2003;422:198–207. doi: 10.1038/nature01511. [DOI] [PubMed] [Google Scholar]
- 12.Yu J, Xiao J, Ren X, Lao K, Xie XS. Probing gene expression in live cells, one protein molecule at a time. Science. 2006;311:1600–1603. doi: 10.1126/science.1119623. [DOI] [PubMed] [Google Scholar]
- 13.Cai L, Friedman N, Xie XS. Stochastic protein expression in individual cells at the single molecule level. Nature. 2006;440:358–362. doi: 10.1038/nature04599. [DOI] [PubMed] [Google Scholar]
- 14.Ekinci KL, Huang XMH, Roukes ML. Ultrasensitive nanoelectromechanical mass detection. Appl Phys Lett. 2004;84:4469–4471. [Google Scholar]
- 15.Yang YT, Callegari C, Feng XL, Ekinci KL, Roukes ML. Zeptogram-scale nanomechanical mass sensing. Nano Lett. 2006;6:583–586. doi: 10.1021/nl052134m. [DOI] [PubMed] [Google Scholar]
- 16.Feng XL, White CJ, Hajimiri A, Roukes ML. A self-sustaining ultrahigh-frequency nanoelectromechanical oscillator. Nature Nanotech. 2008;3:342–346. doi: 10.1038/nnano.2008.125. [DOI] [PubMed] [Google Scholar]
- 17.Feng XL. PhD Dissertation. California Institute of Technology; 2006. [Google Scholar]
- 18.Roukes ML, Ekinci KL. Patent No. 6,722,200. 2004
- 19.Cleland AN. Thermomechanical noise limits on parametric sensing with nanomechanical resonators. New J Phys. 2005;7:235–235. [Google Scholar]
- 20.Ekinci KL, Yang YT, Roukes ML. Ultimate limits to inertial mass sensing based upon nanoelectromechanical systems. J Appl Phys. 2004;95:2682–2689. [Google Scholar]
- 21.Lassagne B, Garcia-Sanchez D, Aguasca A, Bachtold A. Ultrasensitive Mass Sensing with a Nanotube Electromechanical Resonator. Nano Lett. 2008;8:3735–3738. doi: 10.1021/nl801982v. [DOI] [PubMed] [Google Scholar]
- 22.Jensen K, Kim K, Zettl A. An atomic-resolution nanomechanical mass sensor. Nature Nanotech. 2008;3:533–537. doi: 10.1038/nnano.2008.200. [DOI] [PubMed] [Google Scholar]
- 23.Chiu HY, Hung P, Postma HWC, Bockrath M. Atomic-scale mass sensing using carbon nanotube resonators. Nano Lett. 2008;8:4342–4346. doi: 10.1021/nl802181c. [DOI] [PubMed] [Google Scholar]
- 24.Blain MG, et al. Towards the hand-held mass spectrometer: design considerations, simulation, and fabrication of micrometer-scaled cylindrical ion traps. Int J Mass Spectrom. 2004;236:91–104. [Google Scholar]
- 25.Xie J, Miao Y, Shih J, Tai YC, Lee TD. Microfluidic platform for liquid chromatography-tandem mass spectrometry analyses of complex peptide mixtures. Anal Chem. 2005;77:6947–6953. doi: 10.1021/ac0510888. [DOI] [PubMed] [Google Scholar]
- 26.Yamashita M, Fenn JB. Electrospray ion source. Another variation on the free-jet theme. J Phys Chem. 1984;88:4451–4459. [Google Scholar]
- 27.Fenn JB, Mann M, Meng CK, Wong SF, Whitehouse CM. Electrospray ionization for mass spectrometry of large biomolecules. Science. 1989;246:64–71. doi: 10.1126/science.2675315. [DOI] [PubMed] [Google Scholar]
- 28.Dieter G. Inhomogeneous RF fields: A versatile tool for the study of processes with slow ions. In: Ng CY, Baer M, Prigogine I, Rice SA, editors. Advances in Chemical Physics:State-Selected and State-To-State Ion-Molecule Reaction Dynamics. John Wiley & Sons, Inc.; 2007. pp. 1–176. [Google Scholar]
- 29.Heck AJ, van den Heuvel RHH. Investigation of intact protein complexes by mass spectrometry. Mass Spectrom Rev. 2004;23:368–389. doi: 10.1002/mas.10081. [DOI] [PubMed] [Google Scholar]
- 30.van Berkel WJ, van den Heuvel RH, Versluis C, Heck AJ. Detection of intact megaDalton protein assemblies of vanillyl-alcohol oxidase by mass spectrometry. Protein Sci. 2000;9:435–439. doi: 10.1110/ps.9.3.435. [DOI] [PMC free article] [PubMed] [Google Scholar]
- 31.Dohn S, Svendsen W, Boisen A, Hansen O. Mass and position determination of attached particles on cantilever based mass sensors. Rev Sci Instrum. 2007;78:103303. doi: 10.1063/1.2804074. [DOI] [PubMed] [Google Scholar]
- 32.Hanay MS, Roukes ML. Patent No. CIT-4423-P. 2005
- 33.El-Faramawy A, Siu KWM, Thomson BA. Efficiency of nanoelectrospray ionization. J Am Soc Mass Spectrom. 2005;16:1702–1707. doi: 10.1016/j.jasms.2005.06.011. [DOI] [PubMed] [Google Scholar]
- 34. Available at The Alliance for Nanosystems VLSI (very-large-scale integration) www.nanovlsi.org.
Associated Data
This section collects any data citations, data availability statements, or supplementary materials included in this article.