Abstract
Oxidative stress and mitochondrial dysfunction have been implicated in the pathology of HD, however the precise mechanisms by which mutant huntingtin modulates levels of oxidative damage in turn resulting in mitochondrial dysfunction are not known. We hypothesize that mutant huntingtin increases oxidative mtDNA damage leading to mitochondrial dysfunction. We measured nuclear and mitochondrial DNA lesions and mitochondrial bioenergetics in the STHdhQ7 and STHdhQ111 in vitro striatal model of HD. Striatal cells expressing mutant huntingtin show higher basal levels of mitochondrial-generated ROS and mtDNA lesions and a lower spare respiratory capacity. Silencing of APE1, the major mammalian apurinic/apyrimidinic (AP) endonuclease that participates in the base excision repair (BER) pathway, caused further reductions of spare respiratory capacity in the mutant huntingtin-expressing cells. Localization experiments show that APE1 increases in the mitochondria of wild type Q7 cells but not in the mutant huntingtin Q111 cells after treatment with hydrogen peroxide. Moreover, these results are recapitulated in human HD striata and HD skin fibroblasts that show significant mtDNA damage (increased lesion frequency and mtDNA depletion) and significant decreases in spare respiratory capacity, respectively. These data suggest that mtDNA is a major target of mutant huntingtin-associated oxidative stress and may contribute to subsequent mitochondrial dysfunction and that APE1 (and, by extension, BER) is an important target in the maintenance of mitochondrial function in HD.
Keywords: mitochondrial DNA, Huntington’s disease, mitochondrial respiration base excision repair, AP endonuclease, mitochondrial dysfunction
Introduction
HD is a neurodegenerative disorder characterized clinically by involuntary choreiform movements, behavioral abnormalities, and dementia and pathologically by neuronal loss in the striatum and cerebral cortex [1–3]. HD is caused by mutations in the huntingtin gene involving abnormal expansions of CAG-repeats resulting in abnormally long N-terminal polyglutamine stretches in the huntingtin protein [4].
Although huntingtin was identified as the causative gene in HD in 1993, the mechanisms by which huntingtin mutations lead to pathology remain unclear. One leading hypothesis is that mitochondrial dysfunction plays a critical role in this process. HD brains have decreased levels of electron transport chain complexes II and III [5–8], and mutant huntingtin decreases complex II activity in striatal neurons in vitro [9] and synaptosomal mitochondrial ATP production in vivo [10]. Mutant huntintin also sensitizes striatal neurons to calcium-induced decreases in state 3 respiration and mitochondrial membrane potential [11]. Mutant huntingtin also disrupts fast axonal trafficking [12] and more specifically mitochondrial motility [10, 13]. Finally, it has been shown that mutant huntintin associates directly with mitochondria [14–16], and does so in an age-dependent fashion that correlates with disease progression in HD model mice [10].
One mechanism by which mutant huntingtin could affect mitochondrial function is via oxidative stress. HD is associated with increased markers of oxidative stress in both humans and mouse models of the disorder. Oxidative damage to proteins and lipids are elevated in the striatum and cortex of human HD brains [17, 18] as is the oxidation marker 8-hydroxy-2’-deoxyguanosine (8-OHdG) in nuclear DNA (nDNA) [6, 19, 20]. Similarly, significant increases in brain and urinary 8-OHdG and in lipid peroxidation and protein nitration are evident in various mouse models of HD, which correlate with disease progression [21–25] and protein carbonylations are present in animal models of HD [26]. Aggregation of N-terminal fragments of mutant huntingtin was shown to contribute to increased generation of ROS [27] and huntingtin inclusion bodies have been associated with the generation of iron-dependent oxidative stress [28].
Mitochondrial DNA (mtDNA) is a major site of oxidative stress damage and the increased oxidative stress associated with mutant huntintin is likely to increase levels of mtDNA damage. Indeed, increased levels of 8-OHdG in mtDNA have been reported in cortex from HD postmortem brains [6]. Recently we demonstrated a progressive increase in mtDNA damage in the striatum and cerebral cortex in a transgenic HD mouse model [29]. Importantly, mtDNA damage was significantly higher in the brains of HD mice than wild type (WT) controls.
Most of the lesions induced by oxidative stress are repaired by the base excision repair (BER) pathway, which operates in both the nucleus and the mitochondria [30]. BER begins by the action of DNA glycosylases that cleave a base lesion, creating an apurinic/apyrimidinic (AP) site. The AP endonuclease 1 (APE1) recognizes the AP site and cleaves the DNA sugar-phosphate backbone on the 5’ side of the AP site, leaving a 3’ hydroxyl group, so that further processing can proceed via short patch or long patch mechanisms involving DNA repair polymerases and DNA ligases [31–33]. APE1 is present in the mitochondria [34–37] and in neurons in both the nucleus and the cytoplasm [38–41]. Moreover, APE1 localizes to the mitochondria in response to oxidative stress [34, 37, 42].
Certain nDNA repair enzymes appear to play a role in HD by driving the increase in the length of the causative CAG repeat expansion/mutation [43–46]. However, the role of mitochondrial repair proteins in HD has been less well studied. Specifically, the critical question of how the elevated mtDNA damage seen in HD mice may impact on mitochondrial function and how this may be influenced by mtDNA damage and repair remains to be answered.
In this study, we explored the role of mtDNA damage and repair on mitochondrial function in an in vitro model of HD. We show that mutant huntingtin-expressing cells exhibit extensive basal mtDNA damage and reduced spare respiratory capacity. Treatment with H2O2 resulted in further increases in oxidative mtDNA damage and decreases in spare respiratory capacity only in mutant huntingtin-expressing cells. Silencing of the BER enzyme APE1 significantly increases mitochondrial dysfunction particularly in mutant huntingtin-expressing cells. Finally, we recapitulate in human HD brains and in human HD skin fibroblasts the increased levels of mtDNA damage (increased lesion frequency and mtDNA depletion) and the reduction in spare respiratory capacity. Our results demonstrating that APE1 is important for the maintenance of mitochondrial function is a novel finding and supports our hypothesis that mtDNA damage may play a causal role in mitochondrial dysfunction associated with HD.
Materials and Methods
Human post-mortem brain samples
Human brain samples were kindly provided by the Harvard Brain Tissue Resource Center, McLean Hospital, Belmont, Massachusetts. Caudate/putamen from 4 control brains (AN12544, AN04073, AN02690, AN04211), 4 HD grade 3 brains (AN01682, AN17039, AN18554, AN10314) and 4 HD grade 4 brains (AN06034, AN02232, AN02426, AN13250) from adults of 55–63 years of age (controls) and 53–70 (grade 3 HD) and 35–76 years of age and grade 4 HD, respectively) were used for the analyses.
Cell culture and transfection
Immortalized progenitor cell lines STHdhQ111 mutant (Q111) and STHdhQ7 wild type (WT; Q7) were derived from striatal neurons from HdhQ111/Q111 and HdhQ7/Q7 mice (expressing 111 and 7 glutamine repeats, respectively) [47] and were kindly provided by Dr. Marcy McDonald, Massachusetts General Hospital. Cells were cultured in Dulbecco’s Modified Eagle Medium (DMEM) supplemented with 10% FBS, 100 U/mL penicillin, 100 µg/mL streptomycin, 2 mM L-glutamine and 400 µg/mL G418. Cells were grown at 33°C in a 5% CO2 incubator. Cells with passages lower than 14 were used in all experiments. Cells were transfected with Ape1 siRNA or scrambled control (IDT DNA) for 48 hrs using Lipofectamine 2000 reagent (Invitrogen) according to the manufacturer’s protocol.
Fibroblast cell culture
Human primary cultures of normal or HD diploid skin fibroblasts were purchased from the Coriell Cell Repositories (Coriell Institute for Medical Research, Camden, NJ). The HD fibroblasts (GM21756) are from a clinically affected individual with expanded CAG repeat alleles of 70 and 15. The number of expanded CAG repeats was determined in the same individual’s lymphoblasts. The normal fibroblasts (GM04390) are from an individual expressing normal huntingtin. Human fibroblasts were cultured in Dulbeco’s Minimum Essential Medium supplemented with 5% fetal bovine serum, Earle’s salts and non-essential amino acids. Cells were grown a maximum of 14 passages.
Treatment with hydrogen peroxide (H2O2)
For time course studies, 100,000 immortalized Q7 and Q111 cells were cultured for 96 hours prior to treatment with 200 µM H2O2. Cells were harvested at 6, 12 and 24 hours following treatment, washed twice with Hank’s Balanced Salt Solution, and detached using 0.05% trypsin in EDTA. Cell survival in control versus treated cultures was determined using the trypan blue exclusion method [48]. For the DNA damage assay, cells were treated with 200 µM H2O2 and harvested 3 hours following treatment for DNA isolation.
DNA damage analysis, calculation of DNA lesion frequencies and mtDNA relative copy number/abundance by quantitative PCR (QPCR)
DNA isolation, quantitation, and DNA lesion analysis was performed as previously described by our laboratory [29]. The QPCR assay is based on the principle that lesions that block DNA polymerase on the DNA template will decrease the amplification of the fragment of interest. Consequently, amplification is inversely proportional to the presence of damage. The amplification of a 10 kb mtDNA fragment and a 6.9 kb nDNA fragment were used to detect DNA lesions in the mouse immortalized cell lines as previously described [29]. We corrected for possible changes in rates of mtDNA replication by normalizing values for the 10 kb mtDNA fragment relative to those of a small mtDNA amplicon (116 bp). Because the probability of introducing a lesion into a small fragment is low, the amplification of a small fragment is independent of the presence of lesions and provides a measure of the steady-state levels of mtDNA.
To detect mtDNA lesions in human postmortem brains, we amplified a 6.8 kb mtDNA fragment following an initial denaturation for 45 seconds at 94°C, 23 cycles of denaturation for 15 seconds at 94°C and annealing/extension at 68°C for 12 minutes, and a final extension at 72°C for 10 minutes. The primer nucleotide sequences used for the human mtDNA fragment are the following: 5’-CCCAAGGCACCCCTCTGACA-3’ (forward) and 5’-GCCCGTGGGCGATTATGAGA-3’ (reverse). The primer nucleotide sequences for the amplification of a nDNA fragment were: 5’-TTGAGACGCATGAGACGTGCAG-3’ (forward) and 5’-TCACATTCTTGGCTGGGTGTGG-3’ (reverse) using 28 cycles and annealing/extension at 68°C.
Lesions were calculated using the Poisson equation as previously described [49, 50]. Briefly, the average lesion frequency per strand was calculated as λ=-ln AD/AO, where AD represents the amount of amplification of the damaged template and AO is the amount of amplification product from undamaged DNA. The results were expressed as a relative amplification ratio (AD/AO) and/or as lesion frequency per strand. Levels of mtDNA lesions in human postmortem brains were calculated comparing grade 3 brains to the controls whereas mtDNA lesions in the immortalized mouse cell lines were calculated comparing mutant Q111 cells to WT Q7 cells.
For the determination of mtDNA abundance in human postmortem brains, we amplified a 123 bp mtDNA fragment by performing an initial denaturation for 45 seconds at 94°C, followed by 29 cycles of denaturation for 15 seconds at 94°C and annealing/extension at 68°C for 45 seconds, and 45 seconds at 72°C. We used the following primer nucleotide sequences: 5’-CATGCAAGCATCCCCGTTCC-3’ (forward) and 5’–CTGTTTCCCGTGGGGGTGTG-3’ (reverse). The relative copy numbers were calculated as the relative amplification of the grade 3 HD brains compared to the control brains.
Mitochondria spare respiratory capacity measurements
Immortalized cells (30,000) and human primary normal or HD diploid skin fibroblasts (40,000) were seeded onto Seahorse microplates 48 hour prior to the analysis on the Seahorse XF24 extracellular flux analyzer following the manufacturer’s instructions. All experiments were performed at 37°C and the media contained 10 mM pyruvate. Oxygen consumption rate data consist of mean rates during each measurement cycles consisting of a mixing time of 30s and a wait time of 3 min followed by a data acquisition period of 3 min. Rates displayed are basal respiration (0–3’) and rates following addition of 2 µg/ml oligomycin (3–6’), 6 µm FCCP (6–9’), rotenone (1µM) and myxothiazol (2 µM).
Immunoblotting and immunocytochemistry
For Western blots, mitochondrial proteins were obtained from the immortalized Q7 and Q111 cell lines using the Qproteome Mitochondria Isolation kit (QIAGEN) and 20 µg of protein were electrophoresed on 12% bis-acrylamide gels prior to transfer to polyvinylidene difluoride membranes. Membranes were blocked with 5% powdered milk solution in 0.3% Tween 20 (0.05%)/phosphate-buffered saline solution before incubation with APE1 (1/500 dilution; Abcam), VDAC (1/2000; Abcam) and β-Actin (1/5000 dilution; Sigma). Protein bands were detected via chemiluminescence substrate for horseradish peroxidase (Amersham Biosciences) following incubation with peroxidase conjugated IgG (Santa Cruz Biotechnologies; 1/2500) and densitometry was measured using the Bio-Rad VersaDoc™ and the Quantity One software. Differences in protein loading were corrected using the expression of VDAC (mitochondrial fraction) and β-Actin. To determine mitochondrial localization of APE1, immortalized cells were treated with MitoTracker® red (Invitrogen) for 15 min and fixed with 4% paraformaldehyde for 15 min followed by blocking with 10% donkey serum for 30 min after which 1:500 APEX1 (Novus) was applied overnight at 4°C. Cells were incubated with Alexa-conjugated secondary antibody (1:1000) for 60 min in the dark at room temperature. Images were captured on a Zeiss LSM 510 confocal microscope. The image analysis was performed using MetaMorph (MDS Analytical Technologies).
Estimation of mitochondrial superoxide levels using confocal microscopy
Immortalized cells (30,000) were plated and after 48 h cells were washed with imaging buffer (120 mM NaCl, 3.5 mM KCl, 1.3 CaCl2, 1 mM MgCl2, 0.4 KH2PO4, 20 mM TES, 5 mM NaHCO3, 1.2 mM Na2SO4, 25 mM glucose) and labeled with MitoSOX™ red (2.5 µM; Invitrogen) for 10 min at 33°C. Cells were washed twice and incubated with MitoTracker® green (50 nM; Invitrogen) for 40 min at 33°C. Samples were analyzed using a Zeiss LSM 510 confocal system. Live imaging for MitoSOX™ red was performed at an excitation wavelength of 543 nm and emission of LP560 nm and MitoTracker® green at an excitation wavelength of 488 nm and emission of 515–530 nm. Images were acquired using a 63X-inverted objective. Determination of the relative intensities of the fluorescence was performed using the NIH Image J program. Background was subtracted and mean intensity was measured for the entire area. MitoSOX™ fluorescence was normalized using MitoTracker® fluorescence to correct for differences in mitochondrial abundance. MitoTracker® fluorescence was corrected for differences in cell numbers.
Measurement of caspase 3/7 activity
Immortalized cells were transfected with Ape1siRNA as described above, plated at 40,000 cells/well on collagen-coated 96-well plates, and incubated for 48 hr in DMEM containing 10% FBS and 100U/ml/100 mg/ml penicillin/streptomycin, followed by serum-deprivation for 24 hr before assaying as described by [51]. Cells were lysed in 50 ml of a 50/50 mixture of DMEM/Apo lysis buffer (Cell Technology Inc). Aliquots (10 ul) were taken for protein quantification by the Bradford method (Pierce) before the addition of DMEM/Apo lysis buffer including 20 mM DTT and 2% APO 3/7 HTS Substrate (Cell Technology, Inc.). The substrate used is a fluorescence-quenched Rhodamine-DEVD conjugate ((zDEVD) 2-Rhodamine 110) that fluoresces upon cleavage of DEVD by caspase 3/7. Fluorescence was read for 1 hr at 37°C using an excitation wavelength of 488 nm and emission wavelength of 530 nm.
Statistics
One-way ANOVA followed by Tuckey Kramer’s multiple comparison tests were used to compare the differences among the groups. Statistical comparisons in the QPCR and survival experiments were performed using student t test. SigmaStat was used to perform the descriptive and inferential analyses.
Results
Mutant huntingtin-expressing Q111 cells show increased basal levels of mitochondrial-generated ROS and decreased mitochondrial content
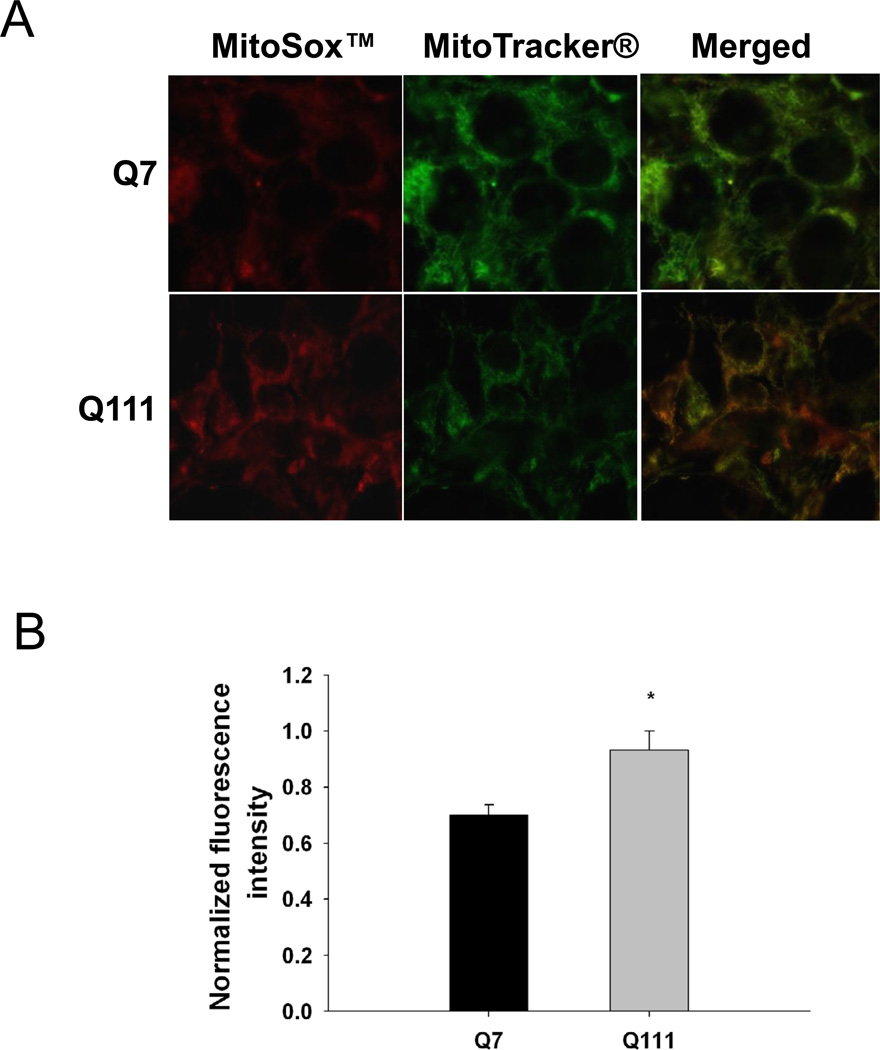
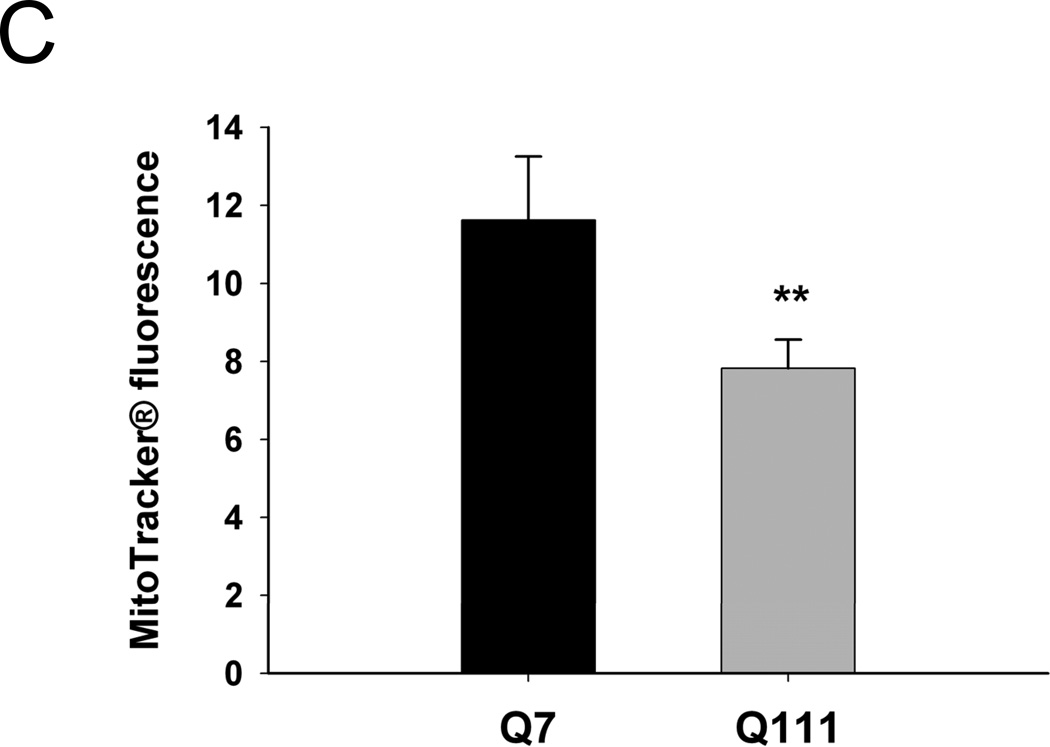
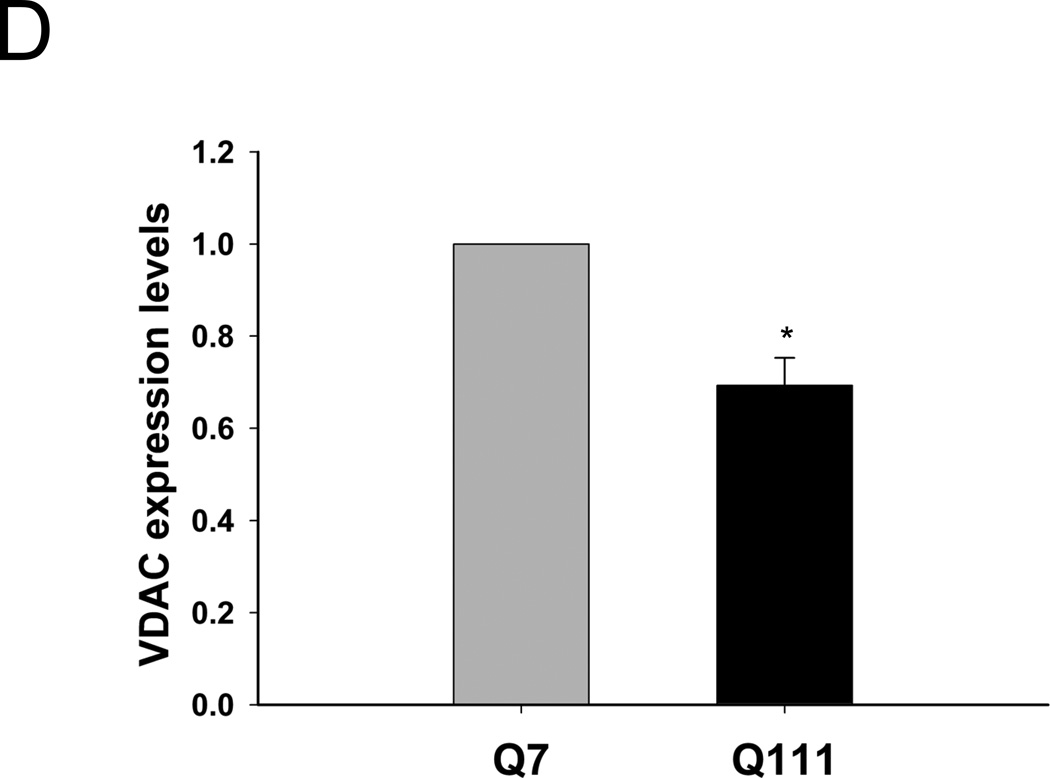
To test whether mutant huntingtin leads to increases in mitochondrial-generated ROS, we measured levels of mitochondrial-generated superoxide in mutant Q111 and WT Q7 striatal immortalized neuronal cells by using MitoSOX™ red. We show that mutant huntingtin-expressing Q111 cells show a significant 23% increase in the levels of mitochondrial-generated superoxide compared to WT Q7 cells (Fig. 1). In addition, we observe a significant 33% decrease in MitoTracker® green fluorescence in Q111 cells relative to WT cells (Fig. 1C) after normalizing for differences in cell numbers. To determine if the reduction in MitoTracker® green fluorescence results from changes in mitochondrial content, we performed Western blot analysis and show that Q111 cells exhibit a 31% reduction in the expression of VDAC (Fig. 1D).
Fig. 1.
Mitochondrial superoxide production is increased in Q111 cells compared to wild type Q7 cells. Cells were cultured as described in Methods and live imaging was performed using a Zeiss LSM 510 confocal microscope. (A) Superoxide production was measured using MitoSOX™ red (2.5 µM) and mitochondria were detected using MitoTracker® green (50 nM). (B) The bar graph shows quantification of intensity of the fluorescence generated by MitoSOX™ after normalization using MitoTracker® fluorescence to correct for differences in mitochondrial abundance. The relative intensity of the fluorescence was determined using NIH Image J. *p=0.03 and n=2 independent experiments. (C) MitoTracker® green fluorescence was normalized for changes in cell numbers; **p=0.02. (D) Quantification of the expression levels of the mitochondrial protein VDAC by Western blot analysis (n=2 independent experiments; *p<0.05). Data are expressed relative to Q7 cells.
Immortalized mutant huntingtin-expressing Q111 cells exhibit increased mtDNA lesions
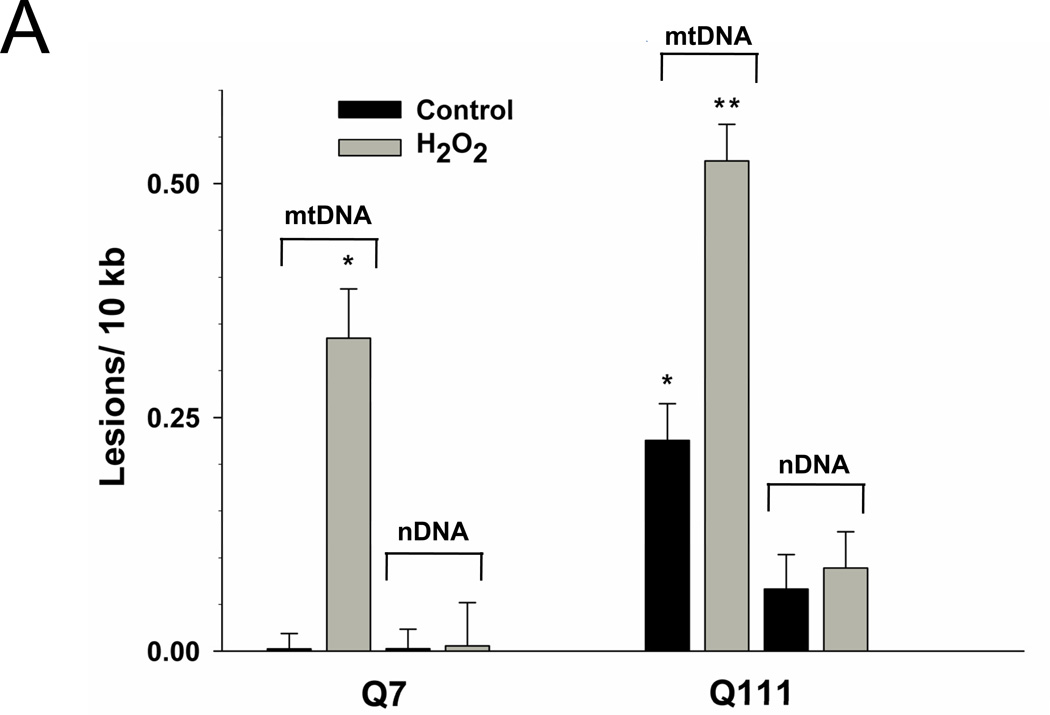
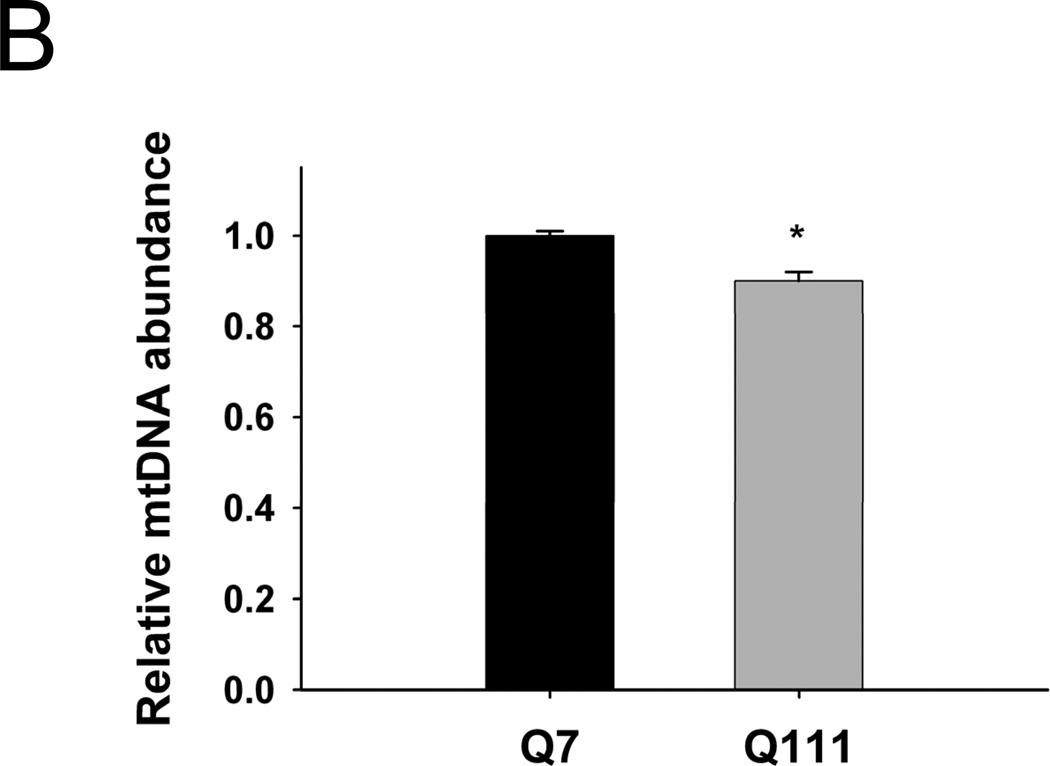
To test the hypothesis that mtDNA is a major target of the oxidative stress associated with mutant huntingtin, we determined levels of mtDNA damage in immortalized WT versus huntingtin-expressing cells. We found that mutant cells exhibited significantly higher basal (control) levels of mtDNA lesions than WT cells (Fig. 2A). Damage in Q111 cells was observed as a significant damage frequency of 0.22 lesions per 10 kb per strand compared to WT cells (0.002 lesions per 10 kb per strand). We next show that treatment with H2O2 for 3 hours leads to a significant increase in the levels of mtDNA lesions in both cell lines, however, levels of damage were significantly higher in the mutant cells (0.33 versus 0.52 lesions per 10 kb per strand, respectively) (Fig. 2A). We also measured the presence of nuclear DNA (nDNA) lesions in the nuclear-encoded HPRT gene and no differences in the frequency of lesions were detected when comparing controls versus huntingtin-expressing cells (Fig. 2A). Interestingly, mutant Q111 cells show a significant 10% decrease in mtDNA abundance (p<0.001) relative to WT cells (Fig. 2B).
Fig. 2.
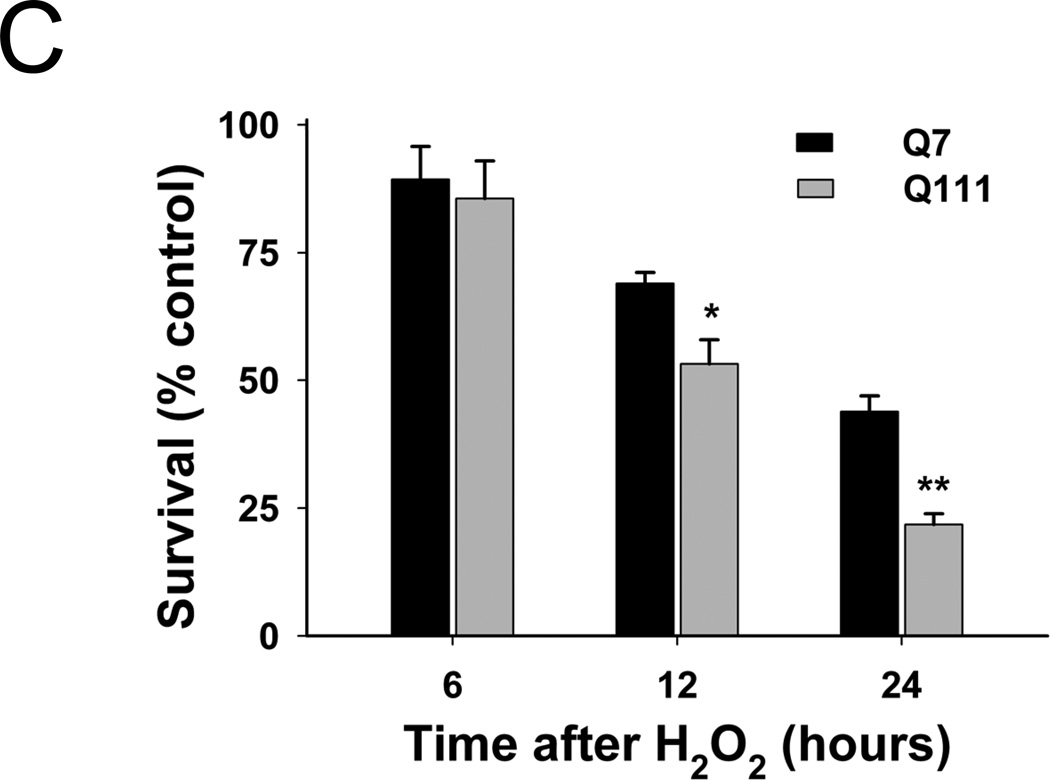
Mutant Q111 cells exhibit higher basal levels of mtDNA damage and are more sensitive to H2O2 treatment than wild type Q7 cells. (A) Cells were treated with 200 µM H2O2 and DNA isolated 3 hours after treatment. Frequency of mtDNA and nDNA lesions per 10 kb per strand after normalization for changes in mtDNA abundance. n=3 independent experiments and 3 QPCR analyses. *p<0.001 versus Q7 control and **p<0.001 versus Q111 control. (B) Relative abundance of mtDNA molecules. *p<0.01 versus Q7. n=6 independent experiments. (C) Cells were treated with 200 µM H2O2 and cell viability was determined after 6, 12, and 24 hours of treatment using the trypan blue exclusion method. Results are expressed as % of control. *p=0.02 and **p<0.001 versus WT Q7 cells. n=2−3 independent experiments in duplicate.
Mitochondrial DNA damage is associated with oxidative stress and the development of HD pathogenesis [29]. To determine the sensitivity of mutant Q111 and WT Q7 cells to oxidative damage, we treated cells with 200 µM H2O2 and determined cell viability 6, 12, and 24 hours after treatment. Our results show a time-dependent decrease in the percent of viable cells in both cell clones (Fig. 2C), however, mutant cells were more sensitive to H2O2-mediated cell death than WT cells following longer treatment (53.2% versus 69.0% cell survival 12 hours after treatment and 43.9% versus 21.8% after 24 hrs in Q7 versus mutant Q111, respectively).
Decreased mtDNA abundance and increased mtDNA lesions in human postmortem HD brain
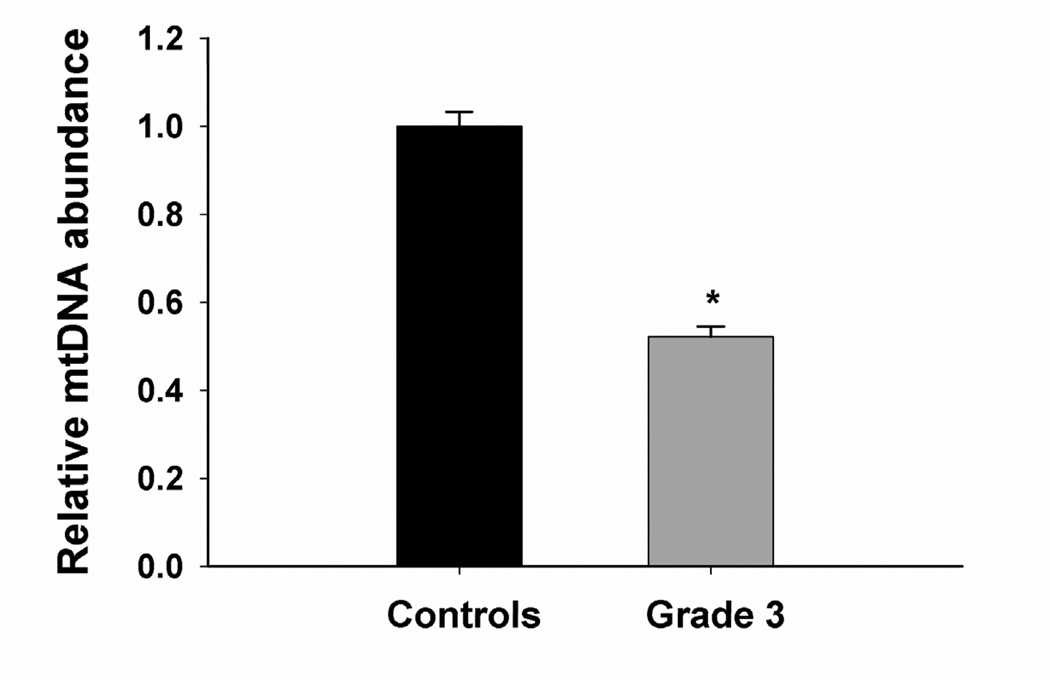
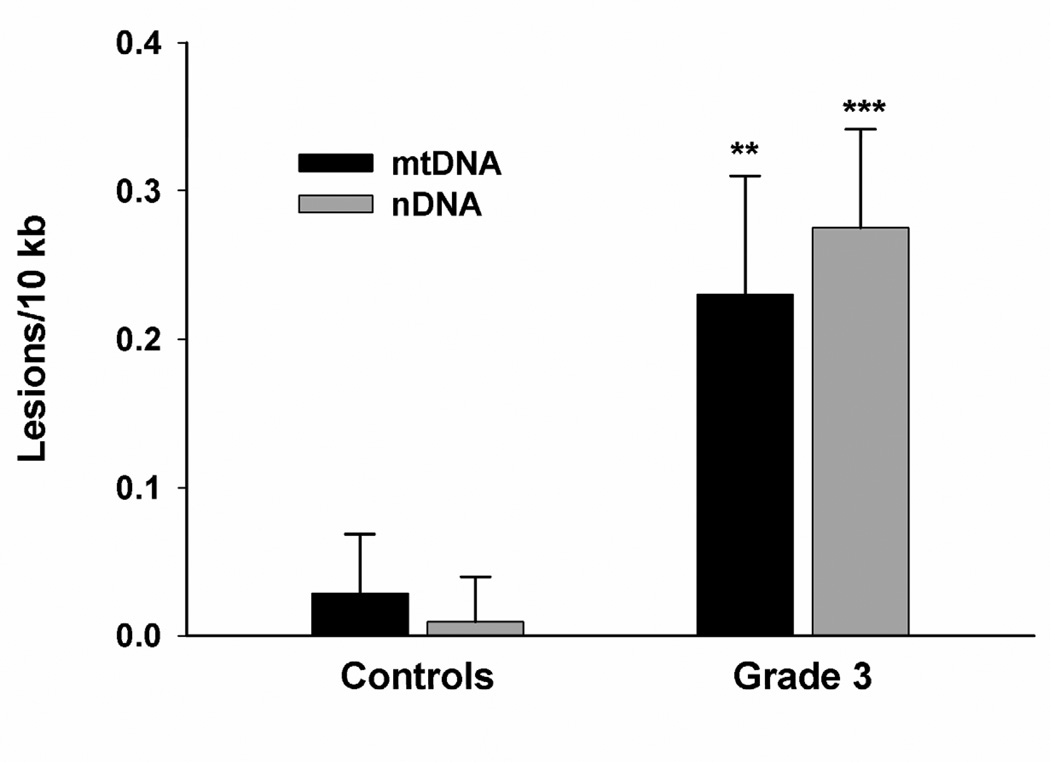
To determine if mitochondrial damage is associated with disease progression, we determined the extent of mtDNA damage in striatum from grade 3 HD postmortem subjects and control individuals. We found a significant ~50% decrease in mtDNA abundance/copy number in grade 3 HD striata compared to control tissue (Fig. 3A). Next we measured DNA damage and found a significant increase in mtDNA lesion frequency in grade 3 HD brain as shown by 0.23 lesions per 10 kb per strand compared to striata from control individuals (Fig. 3B). We also measured the presence of nDNA damage in the nuclear-encoded β-globin gene and found a significant increase in nDNA lesions (0.27 lesions per 10 kb) compared to WT striata. The frequency of nDNA lesions was not significantly different from those in the mtDNA (Fig. 3B). Similar results were observed in mtDNA and nDNA from grade 4 HD striata compared to control tissue (data not shown).
Fig. 3.
Striata from human postmortem grade 3 HD subjects show increased mtDNA depletion and increased levels of mtDNA and nDNA damage. DNA was isolated from caudate/putamen from control (n=4) and HD grade 3 brains (n=4). DNA lesions and mtDNA abundance were determined using QPCR. (A) Relative abundance of mtDNA molecules. *p<0.0001 versus control. (B) Frequency of mtDNA and nDNA lesions per 10 kb per strand. **p<0.05 and ***p<0.001 versus controls.
Immortalized mutant huntingtin-expressing Q111 cells and human skin HD fibroblasts exhibit reduced spare respiratory capacity
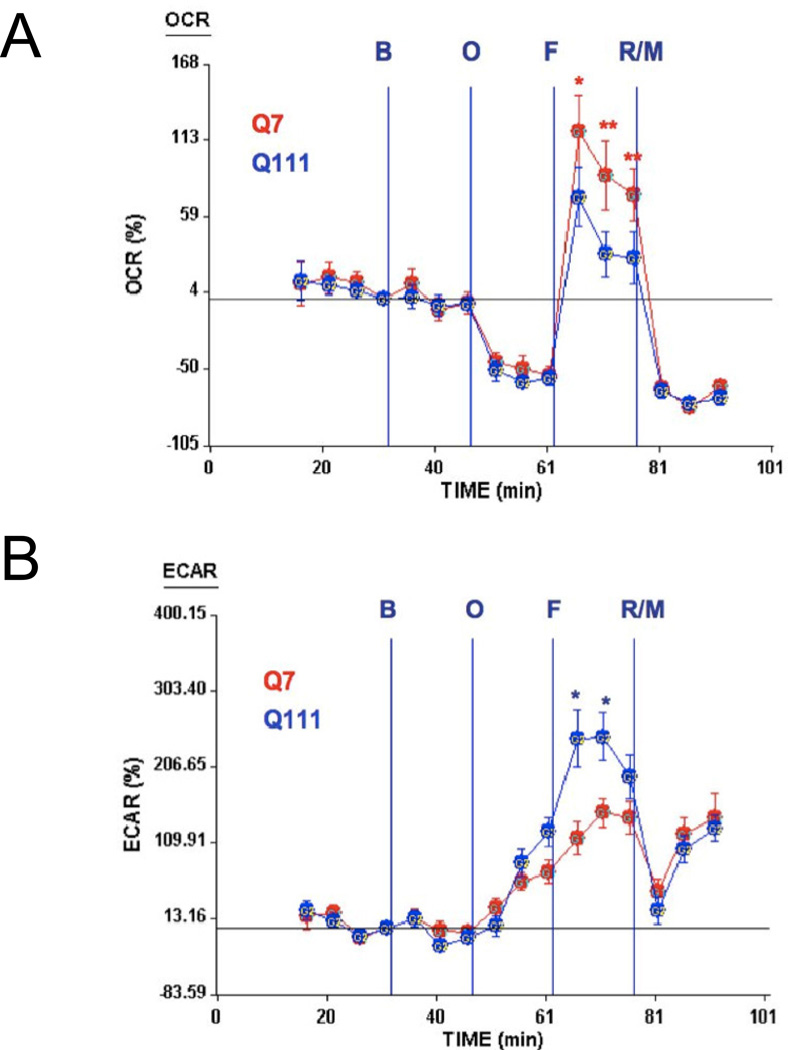
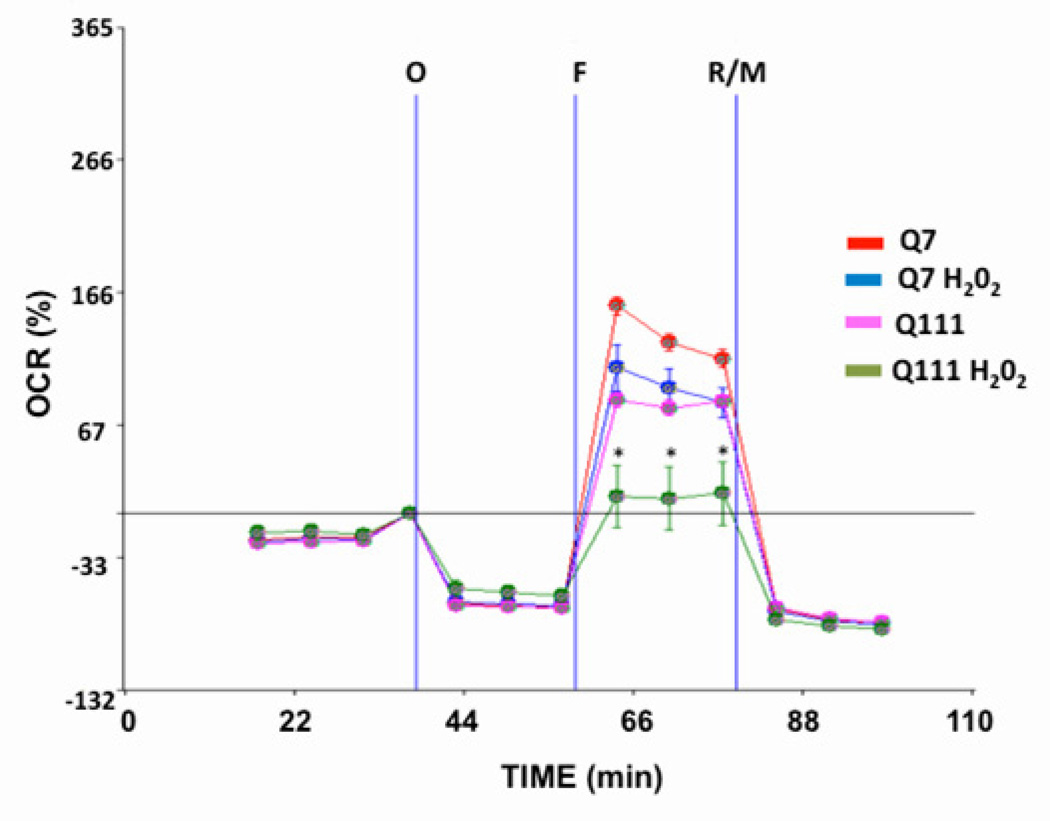
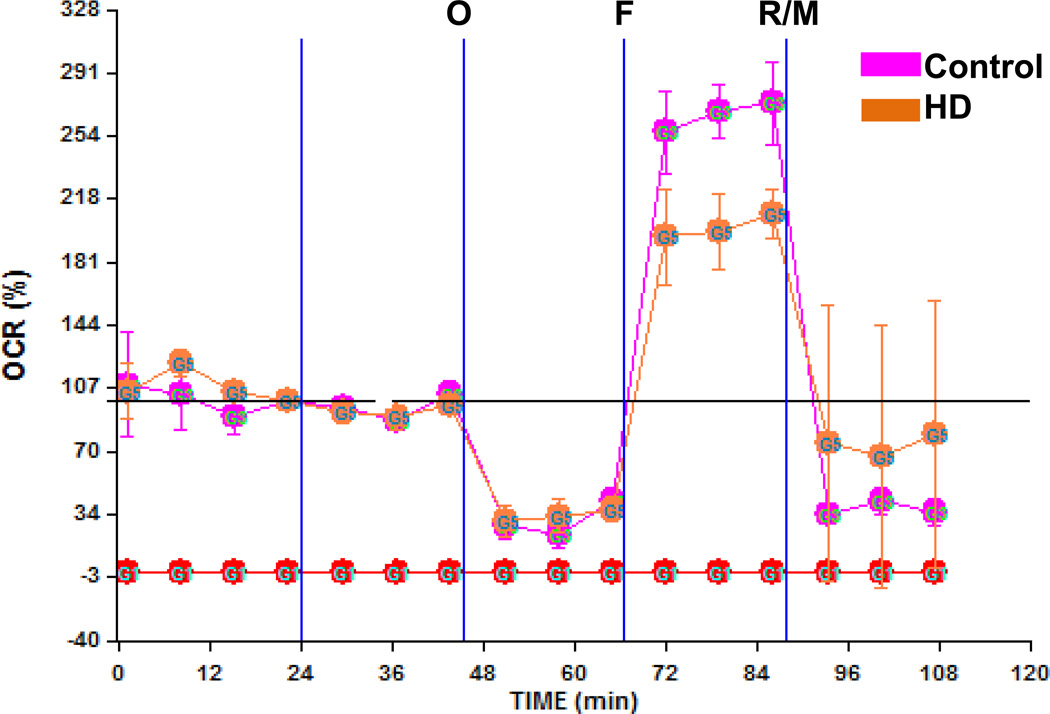
Whether increases in mtDNA damage contribute to mitochondrial dysfunction in HD is unknown. To test whether mtDNA damage observed in mutant cells impacts on mitochondrial function, we utilized the Seahorse XF24 extracellular flux analyzer and measure oxygen consumption rate (OCR) and the extracellular acidifcation rate (ECAR) in cells [52] to estimate spare respiratory capacity (the mitochondrial capability to exceed the OCR required to maintain basic cellular metabolic needs) versus glycolysis [53]. Cells were exposed first to oligomycin, which inhibits the ATP synthase and caused the expected decrease in OCR in both Q111 and Q7 cells (Fig. 4A). To measure maximal mitochondrial respiratory capacity, we then treated cells with carbonylcyanide-4-trifluorometho-xyphenylhydrazone (FCCP), an uncoupler of mitochondrial respiration. Cells normally increase OCR in response to FCCP to maintain proton gradients and mitochondrial function. Mutant cells exhibited 50% less of an increase in OCR after FCCP treatment than did WT cells, suggesting that these cells have less spare respiratory capacity than WT controls. Administration of rotenone and myxothiazol (complex I and III inhibitors, respectively) also inhibited the OCR. Concomitant to the decrease in OCR, FCCP induced an increase in the ECAR in both cell clones indicating a compensatory switch to glycolysis for ATP production (Fig. 4B). However, Q111 cells show higher levels of ECAR than Q7 cells. In order to determine whether an acute oxidative stress insult affects the mitochondrial spare respiratory capacity, we exposed Q7 and Q111 cells to H2O2. We found that Q7 cells show a decrease of 18% in spare respiratory capacity after 200 µM H2O2 treatment for 24 hours. Interestingly mutant Q111 cells show a more dramatic decrease (40%) after H2O2 versus untreated Q111 cells (Fig. 5). The increase in mtDNA lesion frequency precedes the loss in spare respiratory capacity since no difference in spare respiratory capacity was observed 6 hours after H2O2 treatment (data not shown). To further test whether the reduced mitochondrial spare respiratory capacity observed in the immortalized Q111 mutant cell line is also present in HD patients, we measured mitochondrial OCR in a primary culture of HD diploid skin fibroblasts. We found a significant 24% decrease in OCR after FCCP compared to control human fibroblasts (Fig. 6).
Fig. 4.
Mutant Q111 cells exhibit a lower spare respiratory capacity than wild type Q7 cells but higher extracellular acidification rate. (A) Oxygen consumption rate (OCR) was monitored after the addition of buffer only (B), oligomycin (O), FCCP (F), and a mixture of rotenone/myxothiazol (R/M). n=10 replicates per cell clone. Data are expressed as total percentage change from baseline. *p<0.03; **p<0.0001 versus Q111. (B) The extracellular acidification rate (ECAR) was monitored after the addition of buffer only, oligomycin, FCCP, and a mixture of rotenone/myxothiazol. n=10 replicates per cell clone. Data are expressed as total percentage change from baseline. *p<0.007 versus Q7.
Fig. 5.
Mutant Q111 cells exhibit decreased spare respiratory capacity after treatment with H2O2. Cells were treated with H2O2 for 24 hours and oxygen consumption rate (OCR) was monitored after the addition of buffer only (B), oligomycin (O), FCCP (F), and a mixture of rotenone/myxothiazol (R/M). *p<0.05 Q111 versus Q111 H2O2. n=2 independent experiments and n=5 replicates per cell clone.
Fig. 6.
A primary culture of HD diploid skin fibroblasts shows lower spare respiratory capacity than control skin fibroblasts. HD skin fibroblast and control fibroblasts were monitored on an XF-24 Seahorse and oxygen consumption rate was recorded as described above. *p<0.05 versus control fibroblasts after FCCP injection; n=3 experiments.
Increased APE1 localization to the mitochondria of WT but not in mutant huntingtin-expressing cells following hydrogen peroxide treatment
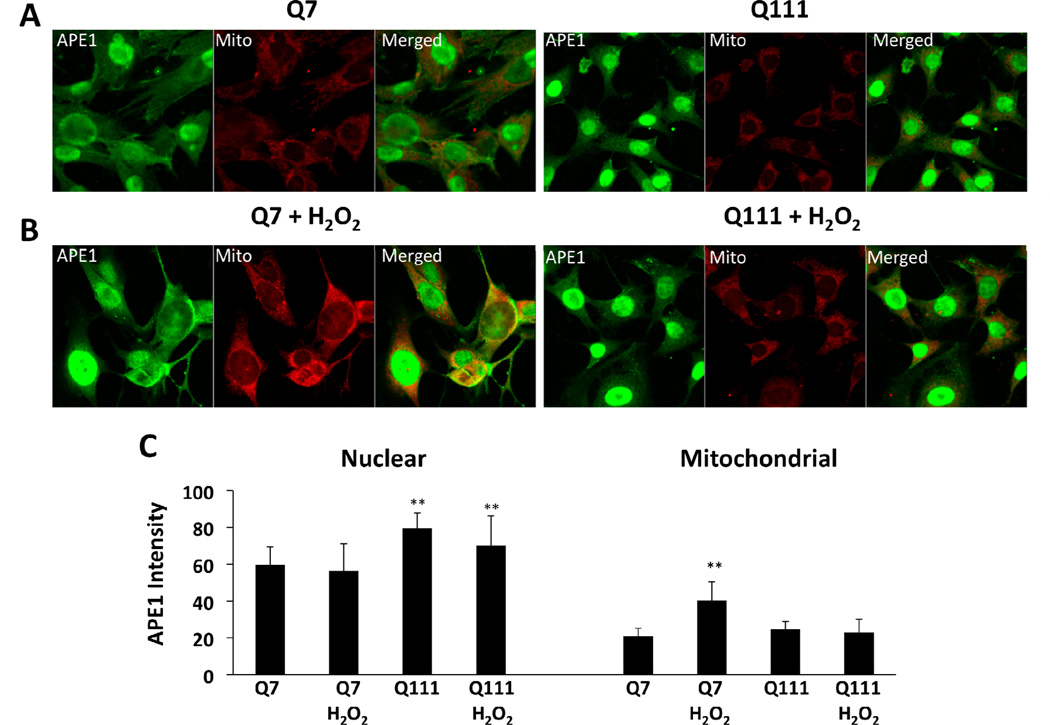
Others have shown that APE1 is localized both in the nucleus and the cytoplasm and that after DNA damage, APE1 preferentially moves to the nucleus and to mitochondria [34–37]. We determined the localization of APE1 in the Q7 and Q111 cells by immunofluorescence and observed that APE1 preferentially localizes in the nucleus of both cell lines (Fig. 7). Interestingly, we observed that Q111 cells show more nuclear APE1 immunofluorescence than Q7 (p<0.01 versus untreated Q7 cells). To test whether increased levels of ROS affects APE1 localization, Q7 and Q111 cells were exposed to 200 µM H2O2 for 6 hours. Nuclear levels of APE1 immunofluorescence did not change in Q7 and Q111 after H2O2 treatment (Fig. 7C). However, APE1 intensity increased significantly by 20% in mitochondria of Q7 cells (p<0.01 versus untreated Q7 cells). Surprisingly, no changes in mitochondrial APE1 intensity were observed in Q111 cells. These results were confirmed by Western blot analysis (Fig. 7D).
Fig. 7.
APE1 intensity increases in the mitochondria of Q7 but not in Q111 cells following hydrogen peroxide treatment. Cells were cultured as described in Methods, treated with 200 µM H2O2 for 6 hours, fixed and stained for APE1 (green) and mitochondria (red). (A) Confocal images of untreated Q7 and Q111 cells. (B) Confocal images of H2O2 treated Q7 and Q111 cells. (C) APE1 intensity after line scans were performed in 3 different fields with n=3; **p< 0.01 versus Q111 after H2O2 treatment. (D) Representative membrane showing APE1 expression in isolated mitochondria (upper panel). Expression levels of APE1 normalized using VDAC expression (lower panel). Data are expressed relative to Q7 control cells; n=2 independent experiments. *p< 0.02 versus Q7 control; **p <0.005 versus Q7 control and Q7 H2O2.
Silencing of APE1 leads to reductions in spare respiratory capacity in mutant Q111 cells
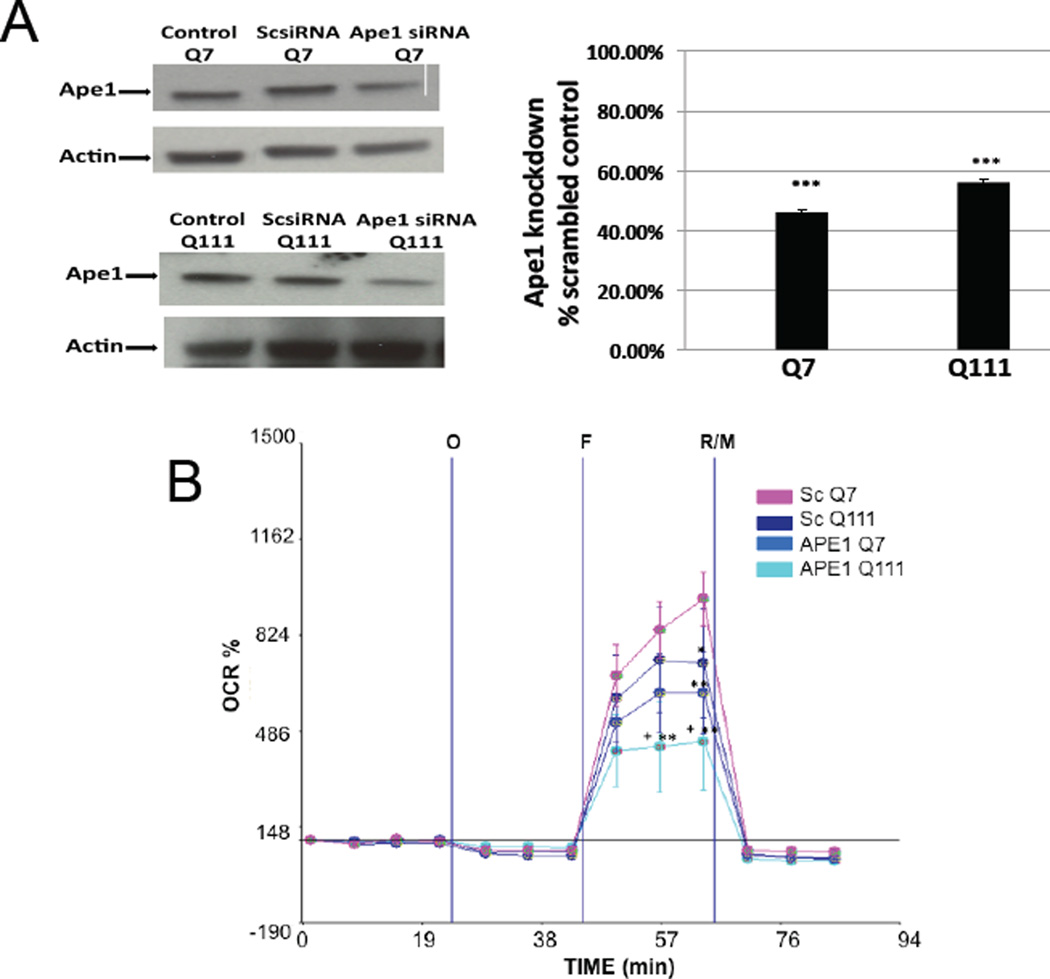
To further test the hypothesis that mtDNA damage can contribute to mitochondrial dysfunction in mutant Q111 cells, we assessed whether silencing of Ape1 exacerbated mitochondrial dysfunction in these cells. We transfected WT and mutant cells with Ape1 siRNA or a scrambled sequence of siRNA as control. Western blot analysis showed that exposure of striatal cells to Ape1 siRNA consistently resulted in a significant 50–60% reduction in APE1 protein levels 48 hours following transfection, whereas scrambled siRNA had no significant effect on APE1 protein levels (Fig. 8A). We next tested whether spare respiratory capacity was affected in these cells. Indeed, we observe that silencing Ape1 results in a significant 47% and 57% decrease of spare respiratory capacity in Q7 and Q111 cells, respectively, relative to the Q7 scramble controls (Fig. 8B). However, the 10% difference observed between Q111 Ape1 versus Q7 Ape1 knockdowns was not statistically significant. Mutant Q111 cells after Ape1 silencing shows a significant 33% decrease versus Q111 scramble controls (Fig. 8).
Fig. 8.
Silencing of Ape1 induces mitochondrial dysfunction in the mutant huntingtin-expressing Q111 cells. Cells were cultured and transfected with scrambled and Ape1 siRNAs as described in Methods. (A) Representative Western blots after transfecting cells with scrambled siRNA and Ape1 siRNA and quantification of APE1 protein expression showing that both Q7 and Q111 cells show a significant APE1 knock down compared with their respective scramble control; ***p<0.001. (B) Oxygen consumption rate (OCR) was monitored as described. *p<0.05 scrambled Q111 versus scrambled Q7; **p<0.01 scrambled Q7 versus Ape1 siRNA Q7 and Ape1 siRNA Q111; +p<0.05 represents Ape1 siRNA Q111 versus scrambled Q111; n=3 independent experiments and n=5 replicates per cell clone.
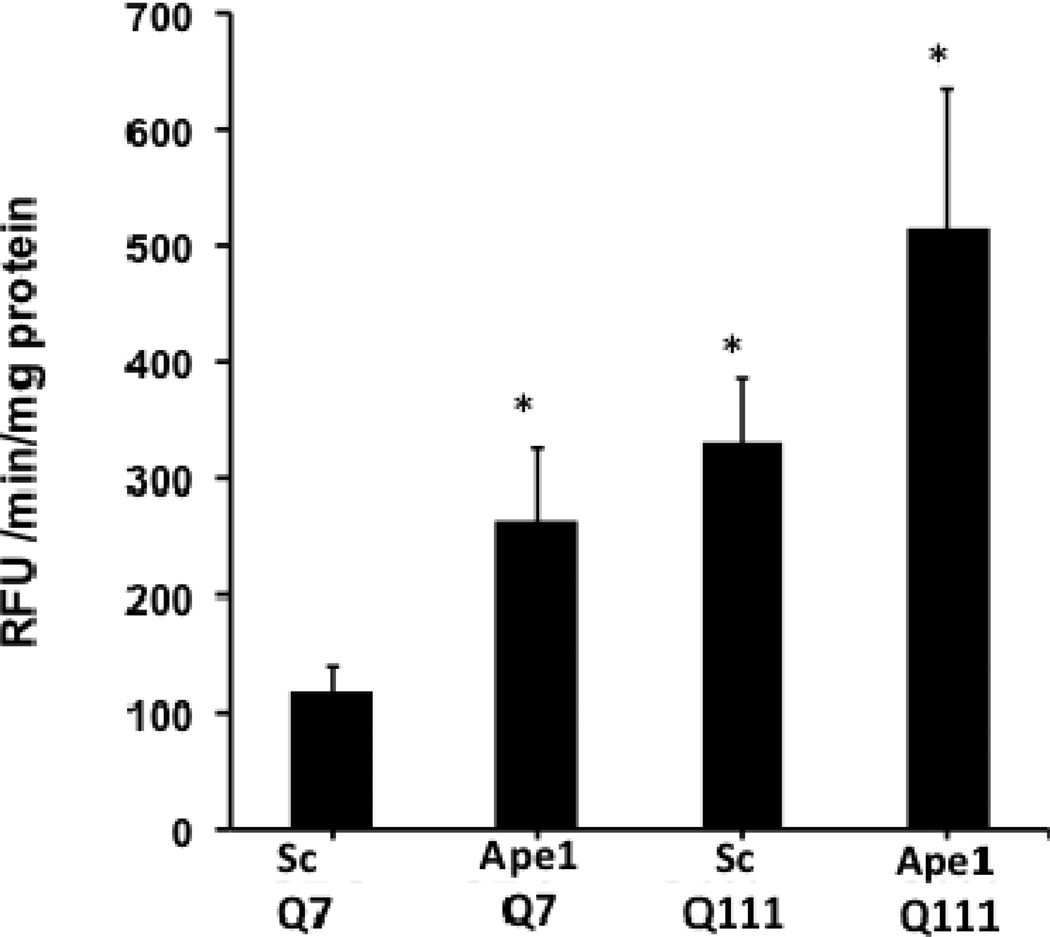
To investigate the impact of Ape1 silencing on apoptotic cell death, we measured caspase 3/7 activity and found a significant increase in both cell clones following APE1 knockdown. Interestingly, the increase in caspase 3/7 activities was higher in Q111 versus Q7 cells (Fig. 9).
Fig. 9.
Silencing of Ape1 results in enhanced caspase 3/7 activation. Cells were cultured and transfected with scrambled and Ape1 siRNAs as described in Methods. Representative bar graph shows significant increase (p<0.01) in activity in Q7 Ape1 siRNA, Q111 scramble control and Q111 Ape1 siRNA versus scramble control Q7. n=3 experiments.
Discussion
The role of oxidative stress in HD is well recognized, however, the possible roles of subsequent ROS-mediated mtDNA damage and altered BER in HD pathogenesis have not been explored. In this study, we measured the formation of DNA damage in both mitochondrial and nuclear genomes in correlation with mitochondrial bioenergetics. In the Q7/Q111 in vitro striatal model of HD we found that: 1) striatal cells expressing mutant huntingtin show higher basal levels of mitochondrial-generated ROS and mtDNA lesions and a lower spare respiratory capacity than WT controls; 2) silencing Ape1 caused further reductions in spare respiratory capacity in mutant huntingtin-expressing cells; 3) human postmortem striata exhibit significant increases in the levels of mtDNA and nDNA lesion frequencies and significant mtDNA depletion; and 4) a primary culture of HD diploid skin fibroblast from a HD patient shows significant reductions in spare respiratory capacity compared to control skin fibroblasts. Thus, the main findings we observe in the immortalized Q111 cells are recapitulated in human HD striata and in human HD primary skin fibroblasts.
We show that the mtDNA damage observed in HD animal models and in mutant huntingtin-expressing cells versus WT cells also occurs in HD postmortem brain. We observe a significant increase in mtDNA damage in striatum from grade 3 HD subjects in the form of mtDNA lesions and mtDNA depletion. The increased levels of mtDNA damage in postmortem human HD striata and in mutant huntingtin-expressing cells versus WT cells extends our previous observations that the R6/2 mouse model of HD differs from WT in having greater age-dependent accumulation of mtDNA lesions [29]. We observe a significant increase in mtDNA damage in striatum from grade 3 HD subjects in the form of mtDNA lesions and mtDNA depletion. The increase in mtDNA lesions extends prior observations of mtDNA damage in the temporal and frontal cortex of HD patients [19, 54]. The increased mtDNA depletion in HD striata is consistent with mitochondria being targets of oxidative damage in HD, as mtDNA depletion may result from the high levels of mtDNA lesions that are present in the HD striata. In addition, increased mtDNA depletion is consistent with the significant loss of striatal neurons observed in grade 3 HD brains [55] and/or with impaired mitochondrial biogenesis [56]. Supporting our findings in human HD striata, the immortalized mutant huntingtin-expressing Q111 cells show both significant levels of mtDNA lesions and a significant 10% decrease in mtDNA abundance. These data are in accordance with previous observations of mtDNA depletion in human HD leukocytes [57].
The immortalized mutant cells sustained higher basal levels of mtDNA lesions compared to damage in a nDNA fragment, suggesting that mtDNA is more sensitive to oxidative damage in HD. These data are consistent with previous observations that mtDNA from striata of R6/2 mice hold eight-fold more lesions than nDNA [29]. However, our results in human postmortem HD striata show similar levels of mtDNA and nDNA lesions in late stage (grade 3) HD subjects. It is possible that sensitivity of the mtDNA to oxidative damage versus nDNA may be associated to the early phases of HD progression as mutant Q111 cells are derived from embryonic neurons. Thus, expression of mutant huntingtin is associated with increasing DNA instability in both mtDNA and in nDNA in mutant huntingtin-expressing cells and in late stage HD postmortem striata.
One consequence of oxidative damage to mtDNA may be impairment of mitochondrial respiratory capacity. We demonstrated that increased ROS and mtDNA lesions correlate with significantly decreased levels of respiration and spare respiratory capacity under basal conditions in mutant Q111 versus WT cells. Importantly, the reduced spare respiratory capacity observed in the immortalized Q111 mutant cell line was recapitulated in a primary culture of HD diploid skin fibroblasts from a HD patient, supporting the observation that reduced mitochondrial bioenergetics is not associated to secondary sublethal effects independent of the huntingtin mutation in the Q111 cells. Mitochondrial respiration and ATP production are reduced in mutant Q111 cells [58]. Interestingly, we observe a concomitant increase in glycolysis, with Q111 cells exhibiting higher levels of glycolysis than Q7 cells. This response could represent a compensatory effect to decreased respiration and ATP production in mutant cells, suggesting that HD cells may be more dependent on glycolysis than respiration to compensate for ATP production. These findings are consistent with previous proton nuclear magnetic resonance spectroscopy experiments in symptomatic HD patients in whom lactate levels were increased in the basal ganglia and cortex, consistent with a defect in energy metabolism [59]. In addition, increased glycolysis has been shown to correlate with decreased OCR in a mouse model of Alzheimer’s disease [60].
Increased levels of mtDNA damage precede mitochondrial dysfunction in mutant Q111 cells treated with H2O2. Consistent with these results are the sustained levels of age-dependent mtDNA lesions observed in the striatum of mouse models of HD [29]. Other neurodegenerative diseases are associated with impairment of mitochondrial metabolism that leads to increased ROS and mitochondrial dysfunction [61–63].
We found higher levels of mtDNA lesions and a significant decrease in spare respiratory capacity in mutant Q111 cells compared to WT cells after exposure to H2O2. By treating cells with H2O2, we created a far greater oxidative stress burden than the one produced by mutant huntingtin. These data suggest that in mutant cells, in the face of a lower spare respiratory capacity, increases in mtDNA damage coupled to an increased demand for ATP may lead to mitochondrial dysfunction. Therefore, maintenance of the spare respiratory capacity under conditions of increased mtDNA damage may be a critical factor in determining neuronal survival in HD. These data are consistent with previous observations that maintenance of spare respiratory capacity is required for survival of primary neuronal cultures after glutathione depletion [64], in synaptosomes after inhibition of Complexes I and II, and in cerebellar granule neurons after Complex I inhibition [65]. In addition, impairment of Complex I or mitochondrial metabolic enzymes by oxidative stress results in loss of spare respiratory capacity in dopaminergic neurons [66].
Increased nuclear and mitochondrial localization of APE1 after exogenous oxidative stress has been previously reported [36, 42, 67]. This movement to the mitochondrial compartment has been proposed as a defense mechanism to deal with increased oxidative mtDNA lesions [68]. In fact, mitochondrial targeting of a truncated form of APE1 results in increased survival in human umbilical vein endothelial cells treated with H2O2 [69]. Consistent with previous reports we observed increased mitochondrial APE1 localization in Q7 cells. However, we observed that Q111 cells did not show increased mitochondrial APE1 localization in response to H2O2 treatment. These results suggest that mutant huntingtin may interfere with the mitochondrial import of APE1, which could lead to the deficient mitochondrial bioenergetic phenotype of the Q111 cells. We also observed that APE1 staining did not increase in the nucleus of the Q7 nor the Q111 cells 6 hour after H2O2 treatment. QPCR experiments show that 3 hours after H2O2 treatment there where no nDNA lesions (Fig. 2A). It is possible that treatment with H2O2 did not increase nuclear APE1 levels due to the absence of nDNA lesions either because they were already repaired or the treatment conditions did not result in significant induction of lesions.
The higher levels of mtDNA damage seen in cells expressing mutant huntingtin could reflect higher lesion occurrence, decreased lesion repair, or both. Intriguingly, silencing of Ape1 in HD cells but not in WT cells leads to exacerbated mitochondrial dysfunction, suggesting that APE1 is more critical to mitochondrial function in cells expressing mutant huntingtin. Partial knock down of Ape1 did not cause mtDNA damage in WT cells and no further damage in mutant cells in comparison to their non-targeted siRNA controls (data not shown). It is possible that APE1 is already overwhelmed in Q111 cells due to the high levels of mtDNA lesions and that reducing APE1 levels results in mitochondrial effects as BER is the most important repair mechanism in the mitochondria. Although the 10% difference in spare respiratory capacity between WT and mutant Q111 cells after partial knock down of Ape1 was not statistically significant, the Q111 cells showed a higher magnitude of decrease. This finding may be anticipated if the mutant huntingtin expressing Q111 cells already have reached their bioenergetic limit as a result of silencing Ape1. Our results showing that silencing APE1 results in increased activation of caspases in both WT and mutant cells are consistent with previous studies examining oxidative stress-induced reductions in APE1 expression and increased neuronal apoptosis in rat hippocampus [70, 71]. Interestingly, we show that in the context of mutant huntingtin, caspase activation is further increased suggesting that apoptosis may be partially dependent on BER. Indeed, reduced expression of APE1 increases cytotoxicity and apoptosis in neurons and mouse fibroblasts and over-expression of APE1 is neuroprotective [41, 72, 73].
APE1 is both a DNA repair enzyme and a reduction/oxidation protein that activates various transcription factors involved in neuronal function [74–79]. Although our results of increased mitochondrial dysfunction in the context of the HD mutation after APE1 silencing are consistent with APE1 repair function, we cannot discard the possibility that either repair or transcriptional gene regulation (or both) may be important as both functions have been shown to be essential for cell survival [73].
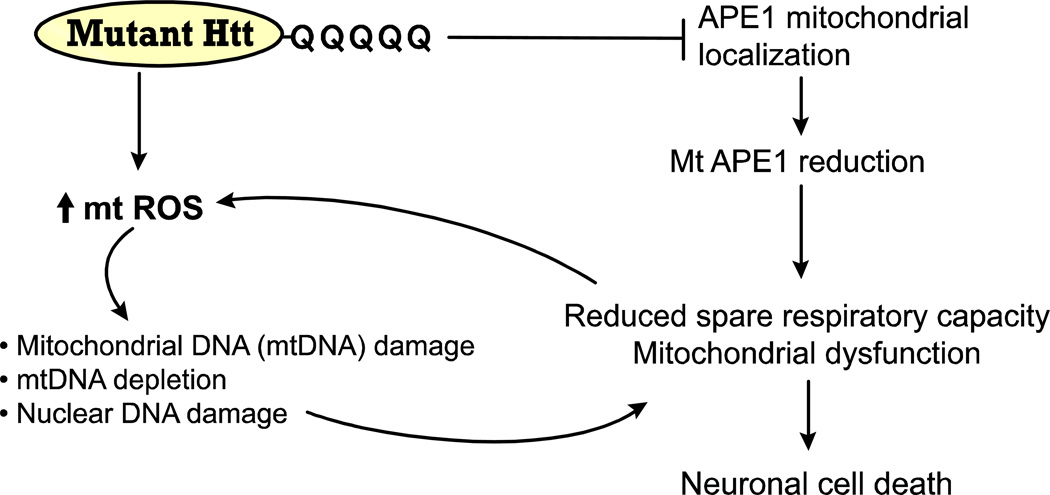
We propose a model for the effect of mutant huntingtin in the Q111 cells on the induction of ROS and mtDNA damage in the pathophysiology of HD (Fig. 10). In mutant Q111 cells, damaged mtDNA (mtDNA lesions and mtDNA depletion) and/or deficient repair of mtDNA damage reduces the efficiency of mitochondria, resulting in decreased spare respiratory capacity. The occurrence of these events in mutant cells further implicate mtDNA damage and failure of mtDNA repair as critical events in the molecular cascade leading to neuronal dysfunction and cell death in HD. Furthermore, these results suggest that a moderate reduction of APE1 has little impact on mitochondrial function under basal conditions, but does have an impact under conditions of oxidative stress (H2O2 treatment) coupled with expression of mutant huntingtin. It is possible that age-dependent increases in mtDNA damage and/or a decline in mtDNA repair capacity could lead to persistent mtDNA damage and exacerbate huntingtin-induced toxicity, ultimately leading to a marked decline in mitochondrial function contributing to HD-like pathology.
Fig. 10.
Model for mutant huntingtin-induced mtDNA damage, deficient mtDNA repair and mitochondrial dysfunction. Mutant huntingtin induces mitochondrial ROS which cause oxidative damage to mtDNA and mtDNA depletion. Concomitantly, APE1 cannot be translocated inside the mitochondria and hence mtDNA repair is affected. Oxidative damage to the nDNA may also contribute to mitochondrial dysfunction. The net effect is a reduction in the spare respiratory capacity, which leads to mitochondrial dysfunction and cell death associated with HD neurodegeneration.
Human HD striatum shows increased levels of mitochondrial DNA damage and depletion.
Human and mouse HD cells show reduced mitochondrial spare respiratory capacity.
Silencing of APE1 (BER) exacerbates mitochondrial dysfunction in HD cells.
Impaired mitochondrial localization of APE1 in HD cells after hydrogen peroxide.
Acknowledgments
We would like to thank Dr. Marcy E. McDonald (Harvard Medical School) for providing the STHdhQ7 and STHdhQ111 cells. The human postmortem brain samples were kindly provided by the Harvard Brain Tissue Resource Center, which is supported by grant number R24-MH068855. The authors acknowledge the help of Amarilys Irizarry Hernández, Graphic Designer of the University of Puerto Rico Medical Sciences Campus, School of Medicine in the development of the artwork (Figure 10). This work was supported in part by grants from the National Institutes of Neurological Diseases and Stroke (5U54-NS043011), the National Institute of General Medical Sciences (R25-GM061838), the National Center for Research Resources (2G12-RR003051) and the National Institute on Minority Health and Health Disparities (8G12-MD007600) from the National Institutes of Health.
Footnotes
Publisher's Disclaimer: This is a PDF file of an unedited manuscript that has been accepted for publication. As a service to our customers we are providing this early version of the manuscript. The manuscript will undergo copyediting, typesetting, and review of the resulting proof before it is published in its final citable form. Please note that during the production process errors may be discovered which could affect the content, and all legal disclaimers that apply to the journal pertain.
References
- 1.Harper P. Huntington’s disease. London: W.B. Saunders; 1991. [Google Scholar]
- 2.Vonsattel JP, et al. Neuropathological classification of Huntington’s disease. J. Neuropathol. Exp. Neurol. 1985;44:559–577. doi: 10.1097/00005072-198511000-00003. [DOI] [PubMed] [Google Scholar]
- 3.Vonsattel JP, DiFiglia M. Huntington disease. J Neuropathol Exp Neurol. 1998;57:369–384. doi: 10.1097/00005072-199805000-00001. [DOI] [PubMed] [Google Scholar]
- 4.Huntington’s Disease Collaborative Research Group. A novel gene containing a trinucleotide repeat that is unstable on Hntington’s Disease chromosomes. Cell. 1993;72:971–983. doi: 10.1016/0092-8674(93)90585-e. [DOI] [PubMed] [Google Scholar]
- 5.Brennan WA, Bird ED, Aprille JR. Regional mitochondrial respiratory activity in Huntington’s disease brain. J Neurochem. 1985;44:1948–1950. doi: 10.1111/j.1471-4159.1985.tb07192.x. [DOI] [PubMed] [Google Scholar]
- 6.Browne SE, Bowling AC, MacGarvey U, Baik MJ, Berger SC, Muqit MM, Bird ED, Beal MF. Oxidative damage and metabolic dysfunction in Huntington’s disease: selective vulnerability of the basal ganglia. Ann Neurol. 1997;41:646–653. doi: 10.1002/ana.410410514. [DOI] [PubMed] [Google Scholar]
- 7.Gu M, Gash MT, Mann VM, Javoid-Agid F, Cooper JM, Shapira AH. Mitochondrial defect in Huntington’s disease caudate nucleus. Ann. Neurol. 1996;39:385–389. doi: 10.1002/ana.410390317. [DOI] [PubMed] [Google Scholar]
- 8.Tabrizi SJ, Cleeter M, Xuereb J, Taanman JW, Cooper JM, Shapira AHV. Biochemical abnormalities and excitotoxicity in Huntington’s disease brain. Ann. Neurol. 1999;45:25–32. doi: 10.1002/1531-8249(199901)45:1<25::aid-art6>3.0.co;2-e. [DOI] [PubMed] [Google Scholar]
- 9.Benchoua A, Trioulier Y, Zala D, Gaillard M-C, Lefort N, Dufour N, Saudou F, Elalouf J-M, Hirsch E, Hantraye P, Deglon N, Brouillet E. Involvement of Mitochondrial Complex II Defects in Neuronal Death Produced by N-Terminus Fragment of Mutated Huntingtin. Mol. Biol. Cell. 2006;17:1652–1663. doi: 10.1091/mbc.E05-07-0607. [DOI] [PMC free article] [PubMed] [Google Scholar]
- 10.Orr A, Li S, Wang C-E, Li H, Wang J, Rong J, Xu X, Mastroberardino P, Greenamyre T, Li X-J. N-Terminal Mutant Huntingtin Associates with Mitochondria and Impairs Mitochondrial Trafficking. J. Neurosci. 2008;28:2783–2792. doi: 10.1523/JNEUROSCI.0106-08.2008. [DOI] [PMC free article] [PubMed] [Google Scholar]
- 11.Milakovic T, Quintanilla RA, Johnson GVW. Mutant Huntingtin Expression Induces Mitochondrial Calcium Handling Defects in Clonal Striatal Cells: Functional consequences. J. Biol. Chem. 2006;281:34785–34795. doi: 10.1074/jbc.M603845200. [DOI] [PubMed] [Google Scholar]
- 12.Gunawardena S, Her LS, Brusch RG, Laymon RA, Niesman IR, Gordesky-Gold B, Sintasath L, Bonini NM, Goldstein LS. Disruption of axonal transport by loss of huntingtin or expression of pathogenic polyQ proteins in Drosophila. Neuron. 2003;40:25–40. doi: 10.1016/s0896-6273(03)00594-4. [DOI] [PubMed] [Google Scholar]
- 13.Trushina E, Dyer RB, Badger JD, II, Ure D, Eide L, Tran DD, Vrieze BT, Legendre-Guillemin V, McPherson PS, Mandavilli BS, Van Houten B, Zeitlin S, McNiven M, Aebersold R, Hayden M, Parisi JE, Seeberg E, Dragatsis I, Doyle K, Bender A, Chacko C, McMurray CT. Mutant Huntingtin Impairs Axonal Trafficking in Mammalian Neurons In Vivo and In Vitro. Mol. Cell. Biol. 2004;24:8195–8209. doi: 10.1128/MCB.24.18.8195-8209.2004. [DOI] [PMC free article] [PubMed] [Google Scholar]
- 14.Panov A, Gutekunst C, Leavitt B, Hayden M, Burke J, Strittmatter W, Greenamyre T. Early mitochondrial calcium defects in Huntington’s disease are a direct effect of polyglutamines. Nature Neuroscience. 2002;5:731–736. doi: 10.1038/nn884. [DOI] [PubMed] [Google Scholar]
- 15.Anson RM, Hansford RG. Mitochondrial influence on aging rate in Caenorhabditis elegans. Aging Cell. 2004;3:29–34. doi: 10.1111/j.1474-9728.2003.00077.x. [DOI] [PubMed] [Google Scholar]
- 16.Petrassch-Parwez E, Nguyen H, Lobbecke-Schumacher M, Habbes H, Wieczorek S, Riess O, Andres K, Dermietzel R, Von Horsten S. Cellular and subcellular localization of Hunthingtin aggregates in the brain of a rat transgenic for Huntington disease. J. Comp. Neurol. 2007;501:716–730. doi: 10.1002/cne.21272. [DOI] [PubMed] [Google Scholar]
- 17.Browne SE, Ferrante RJ, Beal MF. Oxidative stress in Huntington’s disease. Brain Pathol. 1999;9:147–163. doi: 10.1111/j.1750-3639.1999.tb00216.x. [DOI] [PMC free article] [PubMed] [Google Scholar]
- 18.Stoy N, Mackay G, Forrest C, Christofides J, Egerton M, Stone T, Darlington L. Tryptophan metabolism and oxidative stress in patients with Huntington’s disease. J. Neurochem. 2005;93:611–623. doi: 10.1111/j.1471-4159.2005.03070.x. [DOI] [PubMed] [Google Scholar]
- 19.Polidori MC, Mecocci P, Browne SE, Senin U, Beal MF. Oxidative damage to mitochondrial DNA in Huntington’s disease parietal cortex. Neurosci. Lett. 1999;272:53–56. doi: 10.1016/s0304-3940(99)00578-9. [DOI] [PubMed] [Google Scholar]
- 20.Shirendeb U, Reddy A, Manczak M, Calkins M, Mao P, Tagle D, Reddy P. Abnormal mitochondrial dynamics, mitochondrial loss and mutant huntingtin oligomers in Huntington’s disease: imploications for selective neuronal damage. Hum Mol Genet. 2011;20:1438–1455. doi: 10.1093/hmg/ddr024. [DOI] [PMC free article] [PubMed] [Google Scholar]
- 21.Stack EC, Kubilus JK, Smith K, Cormier K, Del Signore SJ, Guelin E, Ryu H, Hersch SM, Ferrante RJ. Chronology of behavioral symptoms and neuropathological sequela in R6/2 Huntington’s disease transgenic mice. J Comp Neurol. 2005;490:354–370. doi: 10.1002/cne.20680. [DOI] [PubMed] [Google Scholar]
- 22.Bogdanov MB, Andreassen OA, Dedeoglu A, Ferrante RJ, Beal MF. Increased oxidative damage to DNA in a transgenic mouse model of Huntington’s disease. J Neurochem. 2001;79:1246–1249. doi: 10.1046/j.1471-4159.2001.00689.x. [DOI] [PubMed] [Google Scholar]
- 23.Browne SE, Beal MF. Oxidative damage in Huntington’s disease pathogenesis. Antioxid. Redox. Signal. 2006;8:2061–2073. doi: 10.1089/ars.2006.8.2061. [DOI] [PubMed] [Google Scholar]
- 24.Tabrizi SJ, Workman J, Hart PE, Mangiarini L, Mahal A, Bates G, Cooper JM, Schapira AH. Mitochondrial dysfunction and free radical damage in the Huntington R6/2 transgenic mouse. Ann Neurol. 2000;47:80–86. doi: 10.1002/1531-8249(200001)47:1<80::aid-ana13>3.3.co;2-b. [DOI] [PubMed] [Google Scholar]
- 25.Perez-Severiano F, Rios C, Segovia J. Striatal oxidative damage parallels the expression of a neurological phenotype in mice transgenic for the mutation of Huntington’s disease. Brain Res. 2000;862:234–237. doi: 10.1016/s0006-8993(00)02082-5. [DOI] [PubMed] [Google Scholar]
- 26.Perluigi M, Poon HF, Maragos W, Pierce WM, Klein JB, Calabrese V, Cini C, De Marco C, Butterfield DA. Proteomic Analysis of Protein Expression and Oxidative Modification in R6/2 Transgenic Mice: A Model of Huntington Disease. Mol. Cell. Proteomics. 2005;4:1849–1861. doi: 10.1074/mcp.M500090-MCP200. [DOI] [PubMed] [Google Scholar]
- 27.Hands S, Sajjad M, Newton M, Wyttenbach A. In vitro and in vivo aggregation of a fragment of huntingtin protein directly causes free radical production. J Biol Chem. 2011;286:44512–44520. doi: 10.1074/jbc.M111.307587. [DOI] [PMC free article] [PubMed] [Google Scholar]
- 28.Firdaus WJ, Wyttenbach A, Giuliano P, Kretz-Remy C, Currie RW, Arrigo AP. Huntingtin inclusion bodies are iron-dependent centers of oxidative events. Febs J. 2006;273:5428–5441. doi: 10.1111/j.1742-4658.2006.05537.x. [DOI] [PubMed] [Google Scholar]
- 29.Acevedo-Torres K, Berrios L, Rosario N, Dufault V, Skatchkov S, Eaton MJ, Torres-Ramos CA, Ayala-Torres S. Mitochondrial DNA damage is a hallmark of chemically induced and the R6/2 transgenic model of Huntington’s disease. DNA Repair (Amst) 2009;8:126–136. doi: 10.1016/j.dnarep.2008.09.004. [DOI] [PMC free article] [PubMed] [Google Scholar]
- 30.Maynard S, Schurman SH, Harboe C, de Souza-Pinto NC, Bohr VA. Base excision repair of oxidative DNA damage and association with cancer and aging. Carcinogenesis. 2009;30:2–10. doi: 10.1093/carcin/bgn250. [DOI] [PMC free article] [PubMed] [Google Scholar]
- 31.Fortini P, Pascucci B, Parlanti E, Sobol RW, Wilson SH, Dogliotti E. Different DNA polymerases are involved in the short- and long-patch base excision repair in mammalian cells. Biochemistry. 1998;37:3575–3580. doi: 10.1021/bi972999h. [DOI] [PubMed] [Google Scholar]
- 32.Frosina G, Fortini P, Rossi O, Carrozzino F, Raspaglio G, Cox LS, Lane DP, Abbondandolo A, Dogliotti E. Two pathways for base excision repair in mammalian cells. J Biol Chem. 1996;271:9573–9578. doi: 10.1074/jbc.271.16.9573. [DOI] [PubMed] [Google Scholar]
- 33.Klungland A, Lindahl T. Second pathway for completion of human DNA base excision-repair: reconstitution with purified proteins and requirement for DNase IV (FEN1) EMBO J. 1997;16:3341–3348. doi: 10.1093/emboj/16.11.3341. [DOI] [PMC free article] [PubMed] [Google Scholar]
- 34.Tomkinson AE, Bonk RT, Linn S. Mitochondrial endonuclease activities specific for apurinic/apyrimidinic sites in DNA from mouse cells. J Biol Chem. 1988;263:12532–12537. [PubMed] [Google Scholar]
- 35.Pinz KG, Bogenhagen DF. Efficient repair of abasic sites in DNA by mitochondrial enzymes. Mol Cell Biol. 1998;18:1257–1265. doi: 10.1128/mcb.18.3.1257. [DOI] [PMC free article] [PubMed] [Google Scholar]
- 36.Tell G, Crivellato E, Pines A, Paron I, Pucillo C, Manzini G, Bandiera A, Kelley MR, Di Loreto C, Damante G. Mitochondrial localization of APE/Ref-1 in thyroid cells. Mutat Res. 2001;485:143–152. doi: 10.1016/s0921-8777(00)00068-9. [DOI] [PubMed] [Google Scholar]
- 37.Chattopadhyay R, Wiederhold L, Szczesny B, Boldogh I, Hazra TK, Izumi T, Mitra S. Identification and characterization of mitochondrial abasic (AP)-endonuclease in mammalian cells. Nucleic Acids Res. 2006;34:2067–2076. doi: 10.1093/nar/gkl177. [DOI] [PMC free article] [PubMed] [Google Scholar]
- 38.Xanthoudakis S, Miao GG, Curran T. The Redox and DNA-Repair Activities of Ref-1 are Encoded by Nonoverlapping Domains. PNAS. 1994;91:23–27. doi: 10.1073/pnas.91.1.23. [DOI] [PMC free article] [PubMed] [Google Scholar]
- 39.Duguid JR, Eble JN, Wilson TM, Kelley MR. Differential Cellular and Subcellular Expression of the Human Multifunctional Apurinic/Apyrimidinic Endonuclease (APE/ref-1) DNA Repair Enzyme. Cancer Res. 1995;55:6097–6102. [PubMed] [Google Scholar]
- 40.Tell G, Damante G, Caldwell D, Kelley MR. The intracellular localization of APE1/Ref-1: more than a passive phenomenon? Antioxid Redox Signal. 2005;7:367–384. doi: 10.1089/ars.2005.7.367. [DOI] [PubMed] [Google Scholar]
- 41.Vasko M, Guo C, Kelley M. The multifunctional DNA repair/redox enzyme Ape1/Ref-1 promotes survival of neurons after oxidative stress. DNA Repair (Amst) 2005;4:367–379. doi: 10.1016/j.dnarep.2004.11.006. [DOI] [PubMed] [Google Scholar]
- 42.Frossi B, Tell G, Spessotto P, Colombatti A, Vitale G, Pucillo C. H(2)O(2) induces translocation of APE/Ref-1 to mitochondria in the Raji B-cell line. J Cell Physiol. 2002;193:180–186. doi: 10.1002/jcp.10159. [DOI] [PubMed] [Google Scholar]
- 43.Wheeler VC, Lebel L-A, Vrbanac V, Teed A, te Riele H, MacDonald ME. Mismatch repair gene Msh2 modifies the timing of early disease in HdhQ111 striatum. Hum. Mol. Genet. 2003;12:273–281. doi: 10.1093/hmg/ddg056. [DOI] [PubMed] [Google Scholar]
- 44.Owen BA, Yang Z, Lai M, Gajec M, Gajek M, Badger JD, Hayes JJ, Edelmann W, Kucherlapati R, Wilson TM, McMurray CT. (CAG)(n)-hairpin DNA binds to Msh2-Msh3 and changes properties of mismatch recognition. Nat Struct Mol Biol. 2005;12:663–670. doi: 10.1038/nsmb965. [DOI] [PubMed] [Google Scholar]
- 45.Slean MM, Panigrahi GB, Ranum LP, Pearson CE. Mutagenic roles of DNA "repair" proteins in antibody diversity and disease-associated trinucleotide repeat instability. DNA Repair (Amst) 2008;7:1135–1154. doi: 10.1016/j.dnarep.2008.03.014. [DOI] [PubMed] [Google Scholar]
- 46.Kovtun IV, Liu Y, Bjoras M, Klungland A, Wilson SH, McMurray CT. OGG1 initiates age-dependent CAG trinucleotide expansion in somatic cells. Nature. 2007;447:447–452. doi: 10.1038/nature05778. [DOI] [PMC free article] [PubMed] [Google Scholar]
- 47.Trettel F, Rigamonti D, Hilditch-Maguire P, Wheeler VC, Sharp AH, Persichetti F, Cattaneo E, MacDonald ME. Dominant phenotypes produced by the HD mutation in STHdhQ111 striatal cells. Hum. Mol. Genet. 2000;9:2799–2809. doi: 10.1093/hmg/9.19.2799. [DOI] [PubMed] [Google Scholar]
- 48.Philips HJ. Dye exclusion test for cell viability. New York: Academic Press; 1973. [Google Scholar]
- 49.Ayala-Torres S, Chen Y, Svoboda T, Rosenblatt J, Van Houten B. Analysis of gene-specific DNA damage and repair using quantitative PCR. In: Doetchst P, editor. Methods: A Companion to Methods in Enzymology. Academic Press; 2000. [DOI] [PubMed] [Google Scholar]
- 50.Santos JH, Meyer JN, Mandavilli BS, Van Houten B. Quantitative PCR-based measurement of nuclear and mitochondrial DNA damage and repair in mammalian cells. Methods Mol Biol. 2006;314:183–199. doi: 10.1385/1-59259-973-7:183. [DOI] [PubMed] [Google Scholar]
- 51.Miller J, Holcomb J, Al-Ramahi I, de Haro M, Gafni J, Zhang N, Kim E, Sanhueza M, Torcassi C, Kwak S, Botas J, Hughes R, Ellerby L. Matrix metalloproteinases are modifiers of huntingtin proteolysis and toxicity in Huntington’s disease. Neuron. 2010;67:199–212. doi: 10.1016/j.neuron.2010.06.021. [DOI] [PMC free article] [PubMed] [Google Scholar]
- 52.Wu M, Neilson A, Swift AL, Moran R, Tamagnine J, Parslow D, Armistead S, Lemire K, Orrell J, Teich J, Chomicz S, Ferrick DA. Multiparameter metabolic analysis reveals a close link between attenuated mitochondrial bioenergetic function and enhanced glycolysis dependency in human tumor cells. Am J Physiol Cell Physiol. 2007;292:C125–136. doi: 10.1152/ajpcell.00247.2006. [DOI] [PubMed] [Google Scholar]
- 53.Nicholls D, Johnson-Cadwell L, Vesce S, Jekabsons M, Yadava N. The bioenergetics of mitochondria incultured neurons and their role in glutamate excitotoxicity. J. Neuros Res. 2007;85:3206–3212. doi: 10.1002/jnr.21290. [DOI] [PubMed] [Google Scholar]
- 54.Horton TM, Graham BH, Corral-Debrinski M, Shoffner JM, Kaufman AE, Beal MF, Wallace DC. Marked increase in mitochondrial DNA deletion levels in the cerebral cortex of Huntington’s disease patients. Neurology. 1995;45:1879–1883. doi: 10.1212/wnl.45.10.1879. [DOI] [PubMed] [Google Scholar]
- 55.Vonsattel JP, Keller C, Cortes Ramirez EP. Huntington’s disease -neuropathology. Handb Clin Neurol. 2011;100:83–100. doi: 10.1016/B978-0-444-52014-2.00004-5. [DOI] [PubMed] [Google Scholar]
- 56.Johri A, Calingasan N, Hennessey T, Sharma A, Yang L, Wille E, Chandra A, Beal M. Pharmacologic activation of mitochondrial biogenesis exerts widespread beneficial effects in a transgenic mouse model of Huntington’s disease. Hum Mol Genet. 2012;21:1124–1137. doi: 10.1093/hmg/ddr541. [DOI] [PMC free article] [PubMed] [Google Scholar]
- 57.Liu C, Cheng W-L, Kuo S-J, Li J-Y, Soong B-W, Wei Y-H. Depletion of mitochondrial DNA in leukocytes of patients with poly-Q diseases. Journal of the Neurological Sciences. 2008;264:18–21. doi: 10.1016/j.jns.2007.07.016. [DOI] [PubMed] [Google Scholar]
- 58.Milakovic T, Johnson GV. Mitochondrial respiration and ATP production are significantly impaired in striatal cells expressing mutant huntingtin. J Biol Chem. 2005;280:30773–30782. doi: 10.1074/jbc.M504749200. [DOI] [PubMed] [Google Scholar]
- 59.Jenkins BG, Koroshetz WJ, Beal MF, Rosen BR. Evidence for impairment of energy metabolism in vivo in Huntington’s disease using localized 1H NMR spectroscopy. Neurology. 1993;43:2689–2695. doi: 10.1212/wnl.43.12.2689. [DOI] [PubMed] [Google Scholar]
- 60.Yao J, Irwin R, Zhao L, Nilse J, Hamilton R, Diaz Brinton R. Mitochondrial bioenergetic deficit precedes Alzheimer’s pathology in female mouse model of Alzheimer’s disease. PNAS. 2009;106:14670–14675. doi: 10.1073/pnas.0903563106. [DOI] [PMC free article] [PubMed] [Google Scholar]
- 61.Park L, Zhang H, Sheu K, Calingasan N, Kristal B, Lindsay J, Gibson G. Metabolic impairment induces oxidative stress, compromises inflammatory responses, and inactivates a key mitochondrial enzyme in microglia. J Neurochem. 1999;72:1948–1958. doi: 10.1046/j.1471-4159.1999.0721948.x. [DOI] [PubMed] [Google Scholar]
- 62.Muller W, Eckert A, Kurz C, Eckert G, Leuner K. Mitochondrial dysfunction: common final pathway in brain aging and Alzheimer’s disease--therapeutic aspects. Mol Neurobiol. 2010;41:159–171. doi: 10.1007/s12035-010-8141-5. [DOI] [PubMed] [Google Scholar]
- 63.Gibson G, Starkov A, Blass J, Ratan R, Beal M. Cause and consequence: mitochondrial dysfucntion initiates and propagates neuronal dysfunction, neuronal death and behavioral abnormalities in age-associated neurodegenerative disorders. Biochim Biophys Acta. 2010;1802:122–134. doi: 10.1016/j.bbadis.2009.08.010. [DOI] [PMC free article] [PubMed] [Google Scholar]
- 64.Vesce S, Jekabsons M, Johnson-Cadwell L, Nicholls D. Acute glutathione depletion restricts mitochondrial ATP export in cerebellar granule neurons. Journal of Biological Chemistry. 2005;280:38720–38728. doi: 10.1074/jbc.M506575200. [DOI] [PubMed] [Google Scholar]
- 65.Yadava N, Nicholls D. Spare respiratory capacity rather than oxidative stress regulates glutamate excitotoxicity after partial respiratory inhibition of mitochondrial complex I with rotenone. J Neuroscience. 2007;27:7310–7317. doi: 10.1523/JNEUROSCI.0212-07.2007. [DOI] [PMC free article] [PubMed] [Google Scholar]
- 66.Kumar M, Nicholls D, Andersen J. Oxidative alpha-ketoglutarate dehydrogenase inhibition via subtle elevations in monoamine oxidase B levels results in loss of spare respiratory capacity. The Journal of Biological Chemistry. 2003;278:46432–46439. doi: 10.1074/jbc.M306378200. [DOI] [PubMed] [Google Scholar]
- 67.Ramana CV, Boldogh I, Izumi T, Mitra S. Activation of apurinic/apyrimidinic endonuclease in human cells by reactive oxygen species and its correlation with their adaptive response to genotoxicity of free radicals. PNAS. 1998;95:5061–5066. doi: 10.1073/pnas.95.9.5061. [DOI] [PMC free article] [PubMed] [Google Scholar]
- 68.Mitra S, Izumi T, Boldogh I, Bhakat KK, Chattopadhyay R, Szczesny B. Intracellular trafficking and regulation of mammalian AP-endonuclease 1 (APE1), an essential DNA repair protein. DNA Repair (Amst) 2007;6:461–469. doi: 10.1016/j.dnarep.2006.10.010. [DOI] [PubMed] [Google Scholar]
- 69.Li MX, Wang D, Zhong ZY, Xiang DB, Li ZP, Xie JY, Yang ZZ, Jin F, Qing Y. Targeting truncated APE1 in mitochondria enhances cell survival after oxidative stress. Free Radic Biol Med. 2008;45:592–601. doi: 10.1016/j.freeradbiomed.2008.05.007. [DOI] [PubMed] [Google Scholar]
- 70.Edwards M, Kent T, Rea H, Wei J, Quast M, Izumi T, Mitra S, Perez-Polo J. APE/Ref-1 responses to ischemia in rat brain. Neuroreport. 1998;9:4015–4018. doi: 10.1097/00001756-199812210-00005. [DOI] [PubMed] [Google Scholar]
- 71.Walton M, Lawlor P, Sirimanne E, Williams C, Gluckman P, Dragunow M. Loss of Ref-1 protein expression precedes DNA fragmentation in apoptotic neurons. Brain Res. 1997;44:167–170. doi: 10.1016/s0169-328x(96)00291-4. [DOI] [PubMed] [Google Scholar]
- 72.Jiang Y, Guo C, Vasko M, Kelley M. Implications of apurinic/apyrimidinic endonuclease in reactive oxygen signalling response after cisplatin treatment of dorsal root ganglion neurons. Cancer Res. 2008;68:6425–6434. doi: 10.1158/0008-5472.CAN-08-1173. [DOI] [PMC free article] [PubMed] [Google Scholar]
- 73.Izumi T, Brown D, Naidu C, Bhakat K, Macinnes M, Saito H, Chen D, Mitra S. Two essential but distint functions of the mammalian abasic endonuclease. PNAS. 2005;102 doi: 10.1073/pnas.0500986102. [DOI] [PMC free article] [PubMed] [Google Scholar]
- 74.Xanthoudakis S, Miao G, Wang F, Pan Y, Curran T. Redox activation of fos-jun DNA binding activity is mediated by a DNA repair enzyme. EMBO J. 1992;11:3323–3335. doi: 10.1002/j.1460-2075.1992.tb05411.x. [DOI] [PMC free article] [PubMed] [Google Scholar]
- 75.Mitomo K, Nakayama K, Fujimoto K, Sun X, Seki S, Yamamoto K. Two cellular redox systems regulate the DNA-binding activity of the p50 subunit of NF-kappa B in vitro. Genes & Dev. 1994;145:197–203. doi: 10.1016/0378-1119(94)90005-1. [DOI] [PubMed] [Google Scholar]
- 76.Huang R, Adamson E. Characterization of the DNA-binding properties of the early growth response-1 (Egr-1) transcription factor: evidence for modulation by a redox mechanism. DNA Cell Biol. 1993;12:265–273. doi: 10.1089/dna.1993.12.265. [DOI] [PubMed] [Google Scholar]
- 77.Lando D, Pongratz I, Poellinger L, Whitelaw M. A redox mechanism controls differential DNA binding activities of hypoxia-inducible factor (HIF) 1 alpha and the HIF-like factor. J Biol. Chem. 2000;275:4618–4627. doi: 10.1074/jbc.275.7.4618. [DOI] [PubMed] [Google Scholar]
- 78.Gaiddon C, Moorthy N, Prives C. Ref-1 regulates the transactivation and pro-apoptotic functions of p53 in vivo. EMBO J. 1999;18:5609–5621. doi: 10.1093/emboj/18.20.5609. [DOI] [PMC free article] [PubMed] [Google Scholar]
- 79.Jayaraman L, Murthy K, Zhu C, Curran T, Xanthoudakis S, Prives C. Identification of redox/repair protein Ref-1 as a potent activator of p53. Genes Dev. 1997;11:558–570. doi: 10.1101/gad.11.5.558. [DOI] [PubMed] [Google Scholar]


