Abstract
Localized high-resolution diffusion tensor images (DTI) from the midbrain were obtained using reduced field-of-view (rFOV) methods combined with SENSE parallel imaging and single-shot echo planar (EPI) acquisitions at 7 T. This combination aimed to diminish sensitivities of DTI to motion, susceptibility variations, and EPI artifacts at ultra-high field. Outer-volume suppression (OVS) was applied in DTI acquisitions at 2- and 1-mm2 resolutions, b=1000 s/mm2, and six diffusion directions, resulting in scans of 7- and 14-min durations. Mean apparent diffusion coefficient (ADC) and fractional anisotropy (FA) values were measured in various fiber tract locations at the two resolutions and compared. Geometric distortion and signal-to-noise ratio (SNR) were additionally measured and compared for reduced-FOV and full-FOV DTI scans. Up to an eight-fold data reduction was achieved using DTI-OVS with SENSE at 1 mm2, and geometric distortion was halved. The localization of fiber tracts was improved, enabling targeted FA and ADC measurements. Significant differences in diffusion properties were observed between resolutions for a number of regions suggesting that FA values are impacted by partial volume effects even at a 2-mm2 resolution. The combined SENSE DTI-OVS approach allows large reductions in DTI data acquisition and provides improved quality for high-resolution diffusion studies of the human brain.
Keywords: DTI, OVS, Outer volume, Reduced FOV, Midbrain, 7 T, SENSE
1. Introduction
High-resolution diffusion tensor imaging (DTI) suffers from the effects of local field variations caused by B0 inhomogeneities or rapid susceptibility changes, as well as physiological and patient bulk motion. These problems result in a number of artifacts that degrade image quality such as ghosting, distortion, blurring, and/or signal dropout that can be severe enough to make image data unusable if not managed or minimized. DTI is particularly sensitive to small physiological or patient motions arising from the use of strong gradients that impart diffusion weighting. In the presence of motion, these gradients produce large phase shifts that cause ghost artifacts in multi-shot acquisitions.
To counter such motion sensitivity, DTI typically uses single-shot echo planar acquisitions that acquire a complete image from a single excitation [1–3]. As resolution increases, the number of data points acquired in k-space must be correspondingly larger, requiring longer echo train lengths. Signal attenuation caused by T2* then results in a greater degree of image blurring and distortions caused by off-resonance effects [4]. In practice, a tradeoff is established between the spatial resolution, signal bandwidth (which affects the signal-to-noise ratio (SNR)), and the magnitudes of EPI-based artifacts. Partial compensation for these effects can be achieved by using multi-shot EPI that lowers the fraction of k-space covered in a single acquisition [5], but multi-shot diffusion imaging demands navigator information or use of PROPELLER trajectories to correct for motion-induced phase shifts [6–9]. Due to the typically diminished SNR of diffusion-weighted images, spatial resolutions are constrained to be relatively low, and long scan durations of 10 to 20 min are employed, which increases the occurrence of patient movement artifacts.
To address these imaging constraints, previous efforts have applied parallel imaging techniques such as SENSE or GRAPPA [10,11]with DTI [2,12–16]. Here, data sizes are lowered by a factor of typically two to four, and aliasing artifacts are removed by using sensitivity encoding information in the reconstruction. Parallel imaging potentially reduces motion effects, echo train lengths, and EPI artifacts, but also reduces SNR. SENSE noise amplification is quantitatively described by the geometry factor, which places additional limits on the acceleration that can be achieved to still obtain adequate image quality.
A number of reports describe similar accelerations using reduced-FOV techniques to spatially localize signal to smaller regions within the full FOV [17–24]. This can be accomplished using a combination of radio-frequency (RF) pulses selective along specific dimensions that suppress the signals from outer volumes by saturation (OVS) [25–28]. As with SENSE, the benefit of using such techniques is to lower data set sizes for any given resolution, potentially diminishing scan times, motion effects, susceptibility effects, and EPI-based artifacts. To date, applications of this technique have largely been confined to diffusion imaging measurements in the spinal cord at field strengths of 3 T and lower [19,21,23], with use at 7 T less common [16,28,29]. Higher-field 7 T systems produce stronger signals that may be used to improve resolution for diffusion property measurements and tractography analysis [19,30–32], but is challenged by shorter T2* values, reduced B1 inhomogeneity, and increased RF power deposition [33]. Reduced-FOV offers potential advantages of improved resolution at higher field for brain imaging while countering short T2* effects.
The goal of this study was to combine reduced-FOV imaging using the outer-volume suppression (OVS) technique with SENSE parallel imaging to improve DTI quality at 7 T. We specifically aimed to achieve improved resolution of regions in the human midbrain. Partial Fourier or half-scan methods were additionally used to further reduce DTI echo trains. We first aimed to demonstrate that combining these techniques with a single-shot EPI DTI scan can provide localized diffusion measurements with improved resolution and without decreased image quality. Small FOV acquisitions in the pons were also compared against full-FOV scans to determine differences in geometric distortion levels, SNR, and measured diffusion properties. The combined parallel DTI-OVS scan was then used to determine the impact resolution improvements had on the measured apparent diffusion coefficient (ADC) and fractional anisotropy (FA) values and their variations within specific anatomical regions.
2. Methods
2.1. Outer-volume suppression diffusion tensor imaging
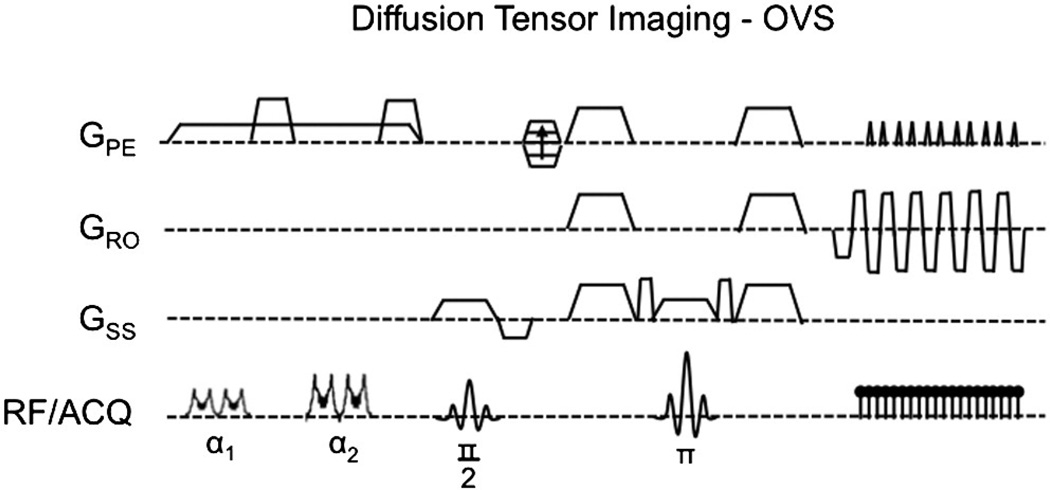
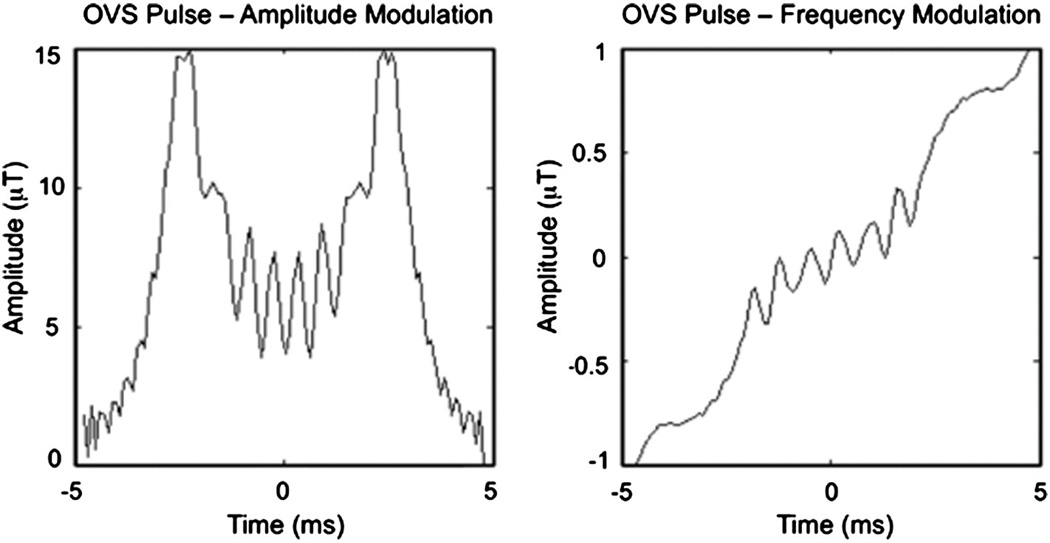
The combination of outer-volume suppression (OVS) with diffusion tensor imaging (DTI) was accomplished based on prior optimizations [29,34] using the pulse sequence shown in Fig. 1. Here, 100-mm-wide saturation bands were placed left and right of the target imaging FOV of interest, with both bands then repeated to improve overall saturation performance. The excited signal in each band was subsequently dephased using 40-mT/m spoiler gradients with 16-ms durations that occurred between the RF pulse repetitions and at the end of the OVS preparation. The applied RF pulse shape consisted of a numerically optimized chirp pulse [35] with a linear frequency modulation (FM) to achieve a quadratic-phase profile (Fig. 2) [25,28,36,37]. Quadratic-phase pulses enable a broader bandwidth with reduced RF power while providing sharp roll-off at pulse edges and significant saturation of signal. The first pair of pulses was set to a flip angle of 90°, the second set to 160°, with 8.25-and 15-µT amplitudes, respectively, 3.9-kHz bandwidths, and 9.63-ms durations, resulting in a time–bandwidth product (TBW) of 38. With a total preparation time of 76 ms, OVS was performed prior to each excitation in a diffusion-weighted sequence using a single-shot EPI readout along a Cartesian trajectory.
Fig. 1.
Outer-volume suppression (OVS) method for reduced-FOV diffusion tensor imaging scans using a single-shot EPI readout.
Fig. 2.
Amplitude and frequency modulation for applied OVS RF pulse.
2.2. Human imaging
Human images were acquired using a 7-T Philips Achieva System (Philips Healthcare, Cleveland, OH) with a 90-cm Magnex magnet, using a 32-channel head-coil receive array and quadrature volume transmission (Nova Medical, Wilmington, MA). System gradient strength, slew rate, and peak B1 amplitude were limited to 40 mT/ m, 200 mT/m/ms, and 15 µT, respectively. Scanning was performed on eight adult subjects, four male and four female between the ages of 20 and 54 years. All subjects provided informed consent per a protocol approved by the Vanderbilt University Medical Center (Nashville, TN) Institutional Review Board (IRB), and females of childbearing age were screened for a negative pregnancy test result prior to imaging.
2.3. Diffusion property measurements in localized midbrain regions
The DTI-OVS combination using single-shot EPI was executed with SENSE parallel imaging to target specific brain regions based on prior optimization for high-resolution imaging at 7 T [29,38] as described by the imaging parameters defined in Table 1. Images were acquired along three planes: a transverse orientation through the basal ganglia, a sagittal midline passing through the third ventricle, brain stem, and thalamus, and a coronal midbrain view with bilateral coverage of the hippocampus and internal capsule fiber pathways. FOV sizes ranging from 70×78 to 90×90 mm2 were restricted using the OVS technique (for reduction in the phase-encoding direction) and with band-pass filtering (for the readout dimension).
Table 1.
Human DTI-OVS scan parameters
| Region | EPI | HS | FOV (mm2) | TR (ms) | TE (ms) | NSA | Resolution (mm3) | WFS (pixels) | b-value (s/mm2) | R | Time (ms) |
|---|---|---|---|---|---|---|---|---|---|---|---|
| Transverse | 23 | NA | 80×80 | 3000 | 61.79 | 20 | 2.0×2.0×2.0 | 12.87 | 1000 | 2.0 | 7m6s |
| 43 | 0.732 | 80×80 | 3000 | 64.75 | 40 | 1.0×1.0×2.0 | 39.84 | 1000 | 2.0 | 14m3s | |
| Sagittal | 25 | NA | 90×90 | 3000 | 62.10 | 20 | 2.0×2.0×2.0 | 13.09 | 1000 | 2.0 | 7m6s |
| 47 | 0.732 | 90×90 | 3000 | 65.14 | 40 | 1.0×1.0×2.0 | 39.35 | 1000 | 2.0 | 14m3s | |
| Coronal | 21 | NA | 70×78 | 3000 | 60.68 | 20 | 2.0×2.0×2.0 | 11.45 | 1000 | 2.0 | 7m6s |
| 41 | 0.732 | 70×78 | 3000 | 64.06 | 40 | 1.0×1.0×2.0 | 34.69 | 1000 | 2.0 | 14m3s | |
| Pons–OVS | 37 | 0.788 | 45×45 | 2500 | 64.87 | 55 | 1.0×1.0×2.0 | 30.18 | 1000 | 1.4 | 16m8s |
| Pons–full | 109 | 0.788 | 210×210 | 2500 | 65.13 | 55 | 1.0×1.0×2.0 | 89.37 | 1000 | 1.4 | 16m8s |
| T1W TFE | NA | NA | 240×240 | 6.0 | 2.9 | 34 | 0.7×0.7×2.0 | 2.03 | NA | 1.0 | 16m8s |
Scan parameters for three target brain regions using diffusion tensor imaging OVS sequence with single-shot EPI for 1- and 2-mm2 resolutions, six diffusion directions, and a b-value of 1000 s/mm2. R corresponds to the SENSE factor; HS, partial Fourier half-scan value; and EPI, the EPI factor.
DTI images were acquired using six diffusion directions along (0, 1, ±1), (±1, 0, 1), and (±1, 1, 0) with a b-value of 1000 s/mm2. For each brain region, images with either 2.0×2.0- or 1.0×1.0-mm2 image resolutions were separately obtained in a single 2-mm-thick slice, for scan durations of 7m6s and 14m3s respectively. Partial Fourier or half-scan (HS) acquisitions were also used and the sampled k-space percentage was adjusted from 73% to 78% to maintain similar echo times for both resolutions, with Cartesian sampling of the remaining k-space lines based on the SENSE factor. Additional full-FOV T1-weighted anatomical images of each section without OVS preparation were acquired using a turbo field-echo (TFE) sequence to aid in identifying features in the DTI scans.
2.4. DTI parameter calculation and assessment
For each DTI-OVS image set corresponding to a specific localized brain region, the six diffusion direction images were first co-registered against the b=0 s/mm2 image using an affine transformation. Background noise was removed by thresholding. A matrix of diffusion values was then calculated at every pixel location along the six diffusion directions, which were then applied to calculate maps of apparent diffusion coefficient (ADC) and fractional anisotropy (FA) [39]. FA maps were color coded using the principal eigenvectors to identify primary fiber tract diffusion directions, with red corresponding to right–left; green, anterior–posterior; and blue, foot–head orientation. Sixteen specific fiber tract locations and anatomical regions were identified using the color-coded map, and mean FA and ADC values were calculated in selected regions of interest (ROI) at both 1- and 2-mm2 resolutions across all eight subjects.
For consistency of measurement, ROI positions for each unique feature were in matched locations and in the same hemisphere (where applicable) at both resolutions. The mean values for each ROI were compared at the two resolutions, and differences were evaluated using a two-tailed paired t-test to determine the significance of measured differences (p≤0.05). Mean FA and ADC values were also compared between regions at the same resolution to determine whether there were significant regional variations. A matrix was generated and color coded based on three significance thresholds: no significant difference (p>0.05), significant (p≤0.05), and highly significant differences (p≤0.001). The percentage of voxels within each region occupied by these different values was calculated for ADC and FA at both resolutions. To assess relative SNR between the two resolutions, the ratio of the mean signal and standard deviation were calculated in a uniform matched portion of the splenium of the corpus callosum.
2.5. DTI geometric distortion assessment in the pons
The differences in geometric distortion between the combined SENSE DTI-OVS approach and a full-FOV protocol were also analyzed. To accomplish this, three scans summarized in Table 1 were compared, including the following: DTI-OVS with a 45×45-mm FOV centered sagittally on the pons (b=1000 mm/s2, six directions); a full-FOV scan with a 210×210-mm FOV oriented in the same plane; and a T1-weighted image with no diffusion weighting, all three interpolated to 0.5-mm2 in-plane resolutions. The same partial Fourier k-space percentages and SENSE factors were used for both DTI scans, for a sequence duration of 16m8s.
To quantitatively describe differences in distortion between the scans, deformation-based morphometry was used [40]. The pons in each of the three image sets was first manually segmented and a threshold applied to generate a mask that matched the pons shape. The OVS and full-FOV pons masks were then both aligned with the T1 mask using affine registration, followed by a non-rigid registration using an adaptive basis algorithm [40] to transform each to the target T1 pons shape. The x and y displacements for each pixel location (i,j) calculated by the registration were then used to determine radial displacement, r:
| (1) |
As a final quantification of the displacement, an average r-value was computed for both the OVS and full data sets along points at the outer edge of the pons only, with the maximum displacement also determined. This calculation was repeated across eight subjects, and the mean displacements were compared to determine the statistical significance of any differences between the OVS and full values. FA, ADC, and SNR were also measured in the pons, with SNR additionally measured in the superior cerebellar peduncle (SCP).
3. Results
3.1. Diffusion property measurement in localized midbrain regions
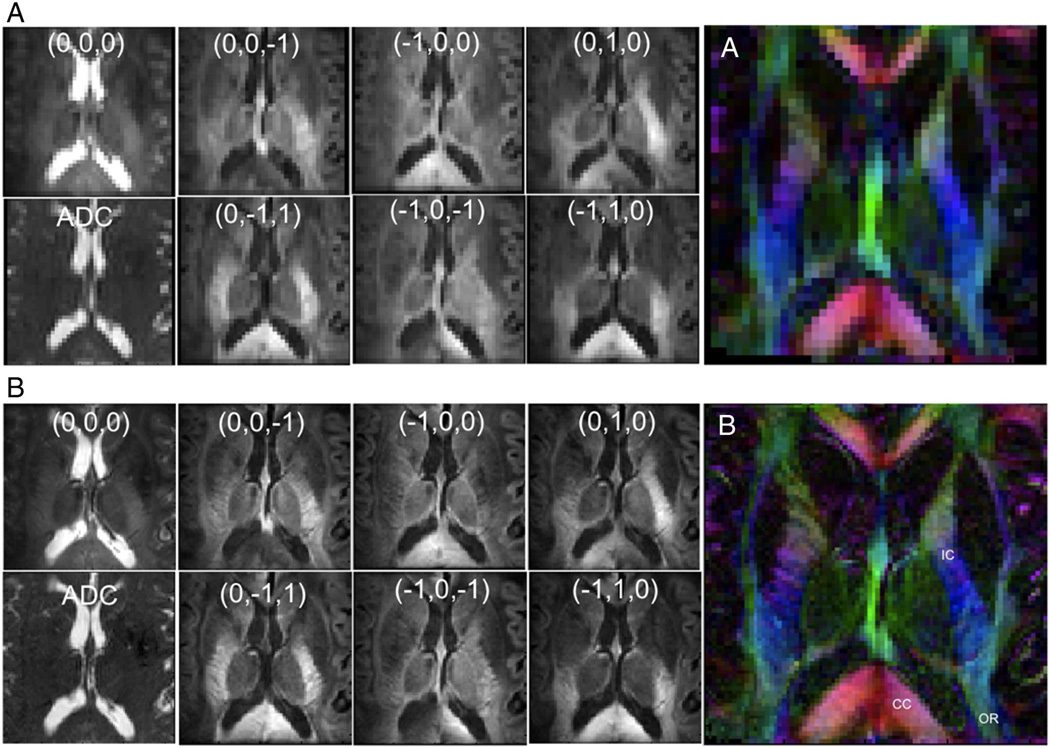
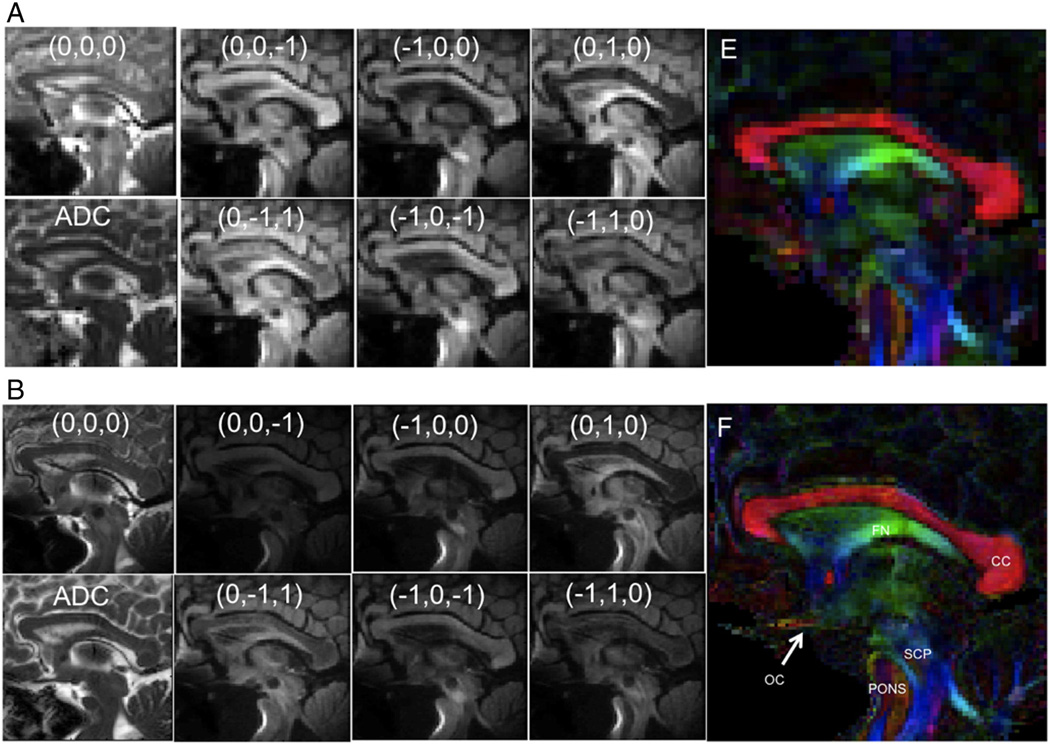
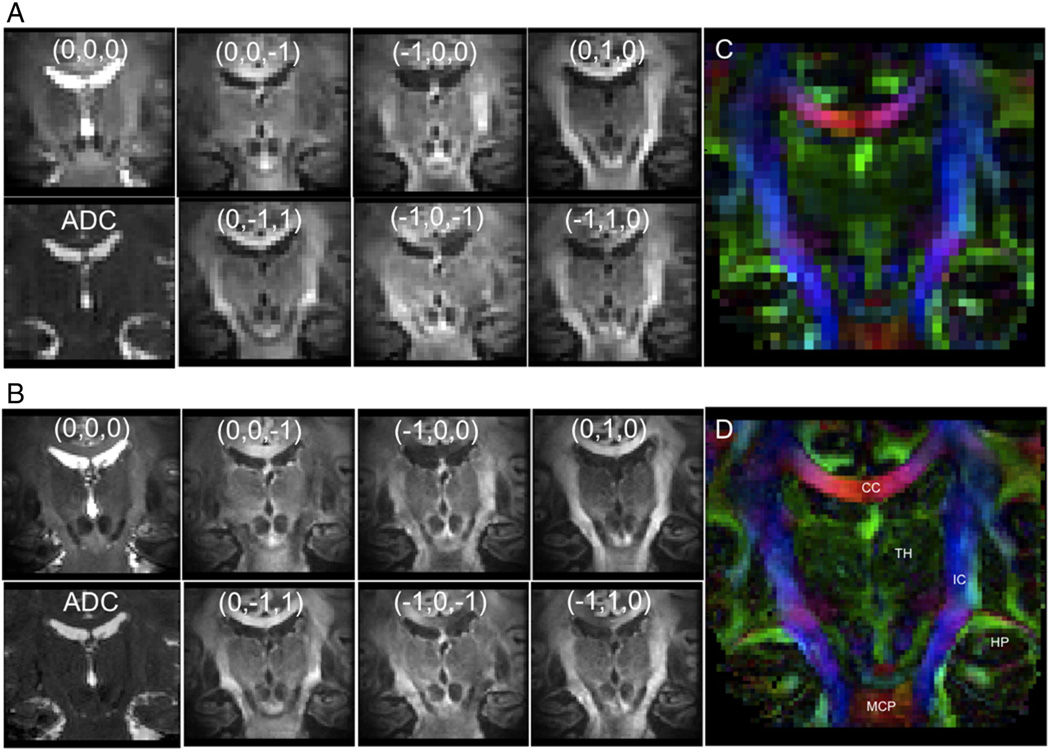
The T1 anatomical images cropped to the three targeted regions of interest are presented in Fig. 3, with matching reduced-FOV images using DTI-OVS presented in Figs. 4–6. Across all regions and resolutions, no visible fold-over artifacts or modulation of signal intensity across the reduced-FOV were observed. FOV reductions using OVS diminished matrix sizes by a factor of 2.6- to 3.4-fold, for a total reduction of 5.2 to 6.8 with a SENSE factor of 2.0. Geometric distortions were not visibly significant in most of the targeted areas, but were apparent in the sagittal pons, and at the edge of the frontal cortex. DTI images using OVS localized a number of prominent fiber tracts and features at the 1.0×1.0-mm2 resolution with diffusion orientations matching expected directions based on anatomy. Identified features are labeled in each figure, which includes specifically portions of the corpus callosum (CC), internal and external capsule (IC), optic chiasm (OC), pons, middle and superior cerebellar peduncles (MCP/SCP), fornix (FN), brain stem, and optic radiation (OR). Improving the resolution from 2.0 ×2.0 to 1.0×1.0 mm2 produced no visible additional distortions or artifacts and improved visualization of a number of tract features, including striations in the internal capsule limbs, corpus callosum, and optic radiation. Smaller tracts such as the optic chiasm and branches in the cerebellum became apparent that were difficult to define or not visible at lower resolution. Hippocampal features were also identified in coronal images, with sharper pathway boundaries in all areas throughout each image plane.
Fig. 3.
T1-weighted anatomical images of regions targeted with DTI-OVS. (A) Sagittal midbrain. (B) Transverse basal ganglia. (C) Coronal midbrain.
Fig. 4.
Diffusion-weighted OVS transverse basal ganglia images at 2 mm×2 mm×2 mm (A), and 1 mm×1 mm×2 mm (B), showing each diffusion direction for b = 1000 s/mm2 and b = 0 s/mm2 image, ADC map, and color-coded FA map.
Fig. 6.
Diffusion-weighted OVS sagittal brain midline images at 2 mm×2 mm×2 mm (A) and 1 mm×1 mm×2 mm (B), showing each diffusion direction for b = 1000 s/mm2 and b = 0 s/mm2 image, ADC map, and color-coded FA map.
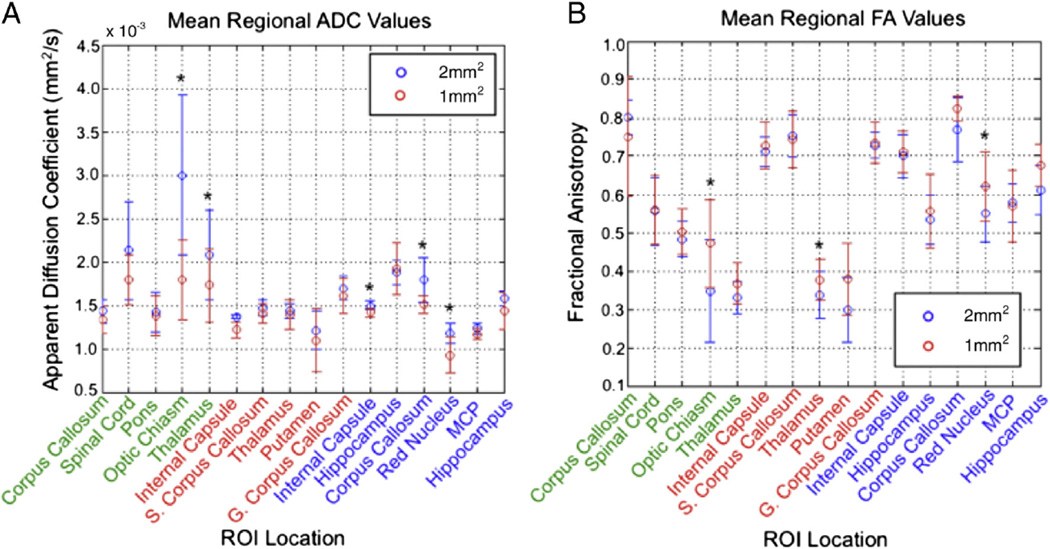
The measured means and variations in FA and ADC values across all eight subjects are summarized in Table 2 and Fig. 7 for the regions targeted at both resolutions. Across all subjects, regions, and resolutions, FA values ranged from 0.299 to 0.825, and ADC spanned 0.9×10⁻³ to 3.0×10⁻³ mm2/s, for an average FA of 0.583 and ADC of 1.55×10⁻³ mm2/s. The FA values measured at 1-mm2 resolution were 7.6% higher than at 2-mm2 measurements, and the ADC values were 10.6% lower at 1-mm2 resolution. The largest difference in ADC and FA values between the two resolutions occurred in the optic chiasm (40.2% and 35.6%, respectively). ADC differences between resolutions were statistically significant (p≤0.05) in the optic chiasm, thalamus, transverse and coronal internal capsule, coronal corpus callosum, and red nucleus. Measured FA differences were likewise statistically significant in the optic chiasm, transverse thalamus, and the red nucleus. The remaining regions showed similar trends in relative values at both resolutions. SNR was 12.5% higher in the corpus callosum at 2 mm2 versus 1 mm2, measured at 18.5 and 16.2, respectively, but this difference was not statistically significant (p=0.11).
Table 2.
Measured diffusion properties and significance.
| Region | FA values |
ADC values (×103 mm2/s) |
||||||
|---|---|---|---|---|---|---|---|---|
| 2 mm2 | 1 mm2 | p-Value | % Diff | 2 mm2 | 1 mm2 | p-Value | % Diff | |
| Corpus callosum | 0.801 | 0.751 | 0.449 | 6.28 | 1.43 | 1.33 | 0.069 | 6.91 |
| Spinal column | 0.555 | 0.559 | 0.882 | −0.70 | 2.13 | 1.79 | 0.066 | 15.99 |
| Pons | 0.483 | 0.502 | 0.348 | −3.93 | 1.42 | 1.38 | 0.680 | 2.63 |
| Optic chiasm | 0.347 | 0.471 | 0.018* | −35.60 | 3.00 | 1.79 | 0.005* | 40.20 |
| Thalamus | 0.330 | 0.367 | 0.144 | −11.40 | 2.08 | 1.73 | 0.040* | 17.08 |
| Internal capsule | 0.711 | 0.728 | 0.282 | −2.38 | 1.37 | 1.22 | 0.003* | 10.81 |
| S. Corpus callosum | 0.752 | 0.743 | 0.647 | 1.13 | 1.47 | 1.41 | 0.167 | 4.37 |
| Thalamus | 0.337 | 0.377 | 0.008* | −11.72 | 1.44 | 1.39 | 0.524 | 3.50 |
| Putamen | 0.299 | 0.379 | 0.098 | −26.78 | 1.21 | 1.10 | 0.341 | 9.24 |
| G. Corpus callosum | 0.729 | 0.735 | 0.646 | −0.85 | 1.70 | 1.61 | 0.182 | 5.46 |
| Internal capsule | 0.701 | 0.711 | 0.484 | −1.54 | 1.50 | 1.42 | 0.032* | 4.96 |
| Hippocampus | 0.533 | 0.557 | 0.422 | −4.55 | 1.88 | 1.92 | 0.515 | 2.39 |
| Corpus callosum | 0.770 | 0.825 | 0.111 | −7.24 | 1.79 | 1.51 | 0.025* | 15.34 |
| Red nucleus | 0.549 | 0.620 | 0.017* | −12.97 | 1.18 | 9.27 | 0.003* | 21.09 |
| MCP | 0.579 | 0.570 | 0.709 | 1.55 | 1.23 | 1.17 | 0.116 | 5.14 |
| Hippocampus | 0.611 | 0.676 | 0.060 | −10.61 | 1.58 | 1.43 | 0.074 | 9.62 |
Average measured ADC and FA values recorded across eight subjects at 2- and 1-mm2 resolutions in the listed target regions for each of the three midbrain planes. Listed p-values correspond to the significance of the change in values at the two resolutions, expressed additionally as a percentage difference.
Indicates statistically significant results.
Fig. 7.
Measured ADC (A) and FA (B) values in the three targeted planes through the midbrain for various ROIs selected. Features with green text correspond to the sagittal orientation; red, the transverse; and blue, coronal. Average values are displayed for both 2- and 1-mm2 resolutions. Those ROIs with significant difference between resolution are indicated with asterisk (*).
3.2. Comparison of measured FA and ADC between localized features
Comparisons of FA and ADC values between 16 independent midbrain regions are summarized in Fig. 8 for both resolutions. Here, black indicates no statistical difference in measured values, gray corresponds to a significant difference, and white a highly significant difference. Each row or column summarizes how each particular region compares to others measured. Overall, more regions were found to have statistically significant differences in FA and ADC at the 2-mm2 resolution versus 1 mm2 (Table 3). Most differed only at the lower significance threshold (p≤0.05), but FA differences were more widespread (>41% of regions). FA differences were especially distinct for the putamen and thalamus, while ADC differences were greatest in the red nucleus and middle cerebellar peduncle (MCP).
Fig. 8.
Matrix demonstrating whether FA and ADC values are significantly different when comparing the averages for the various regions measured. Black indicates no significance (p>0.05), gray is significant (p≤0.05), and white is highly significant (p≤0.001) for both resolutions tested.
Table 3.
Percentage of regions significantly different
| Property | 2 mm2p≤0.05 | 2 mm2p≤0.001 | 1 mm2p≤0.05 | 1 mm2p≤0.001 |
|---|---|---|---|---|
| ADC | 70% | 25% | 55% | 16% |
| FA | 73% | 53% | 66% | 41% |
Percentage of individual regions that demonstrated a statistically significant difference with the remaining 16 regions for both ADC and FA measurements. Separated to distinguish between significant (p≤0.05) and highly significant (p≤0.001) thresholds for both resolutions.
3.3. DTI geometric distortion assessment in the pons
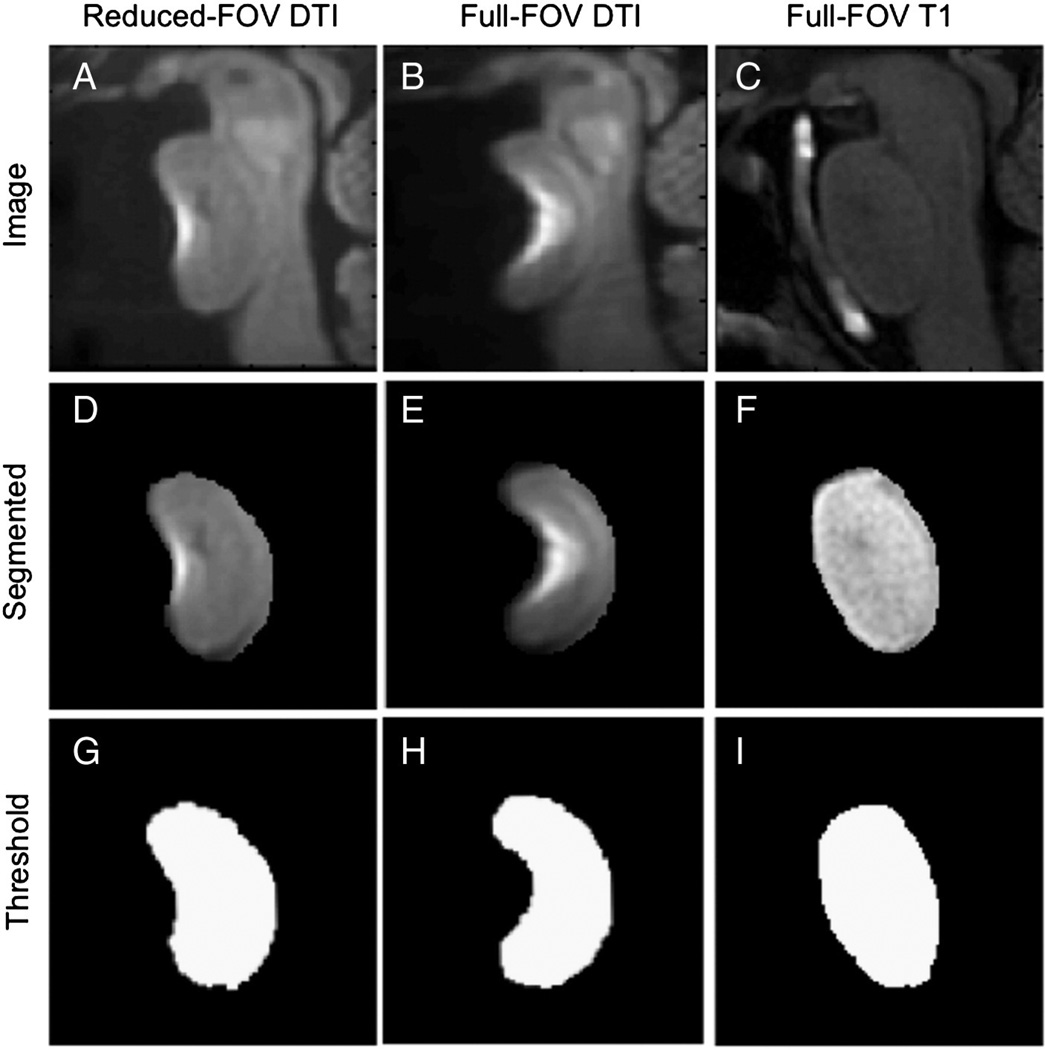
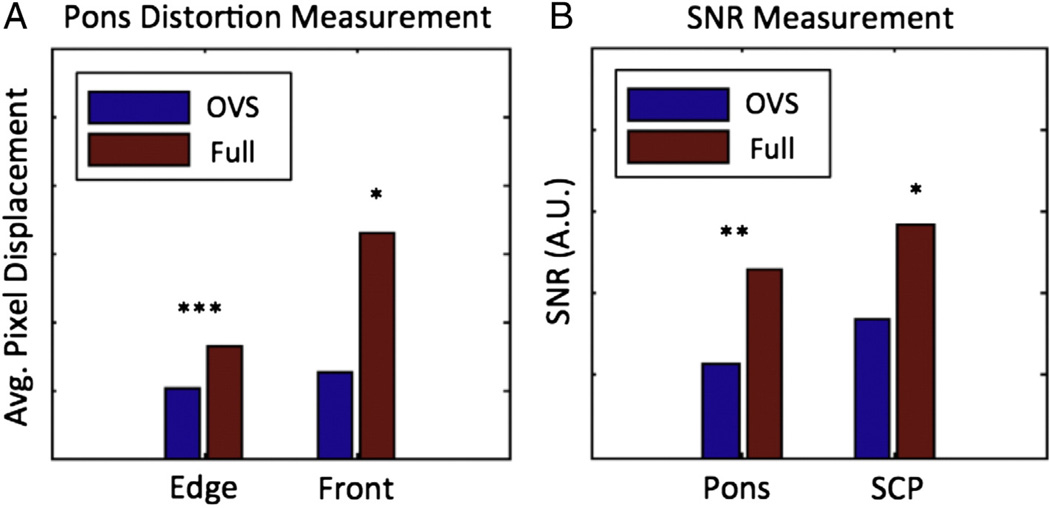
Fig. 9 provides a qualitative comparison between the segmented shapes of the pons in the diffusion-weighted images. Full-FOV images showed more distortion than OVS images, shifting by a distance that spans half the width of the pons for the subjects presented. This is demonstrated in the edge displacement map (Fig. 10) that presents the radial displacement at each edge point in the pons relative to the undistorted T1 shape, with greatest displacement at the front edge ranging from 0 to 30 pixels. The results across all eight subjects are summarized in Fig. 11, which shows the average edge and front surface displacements with and without OVS FOV reduction. Overall, the radial edge displacement was 1.63 times greater at a shift of 8.2 pixels when using a full-FOV scan, which corresponds to a highly significant difference (p =2×10⁻⁵). The front edge demonstrated a greater disparity, with displacements 2.6 times higher averaging 16.4 pixel offsets for the full case relative to 6.25 pixels for the OVS- reduced FOV (p = 0.002).
Fig. 9.
Processing steps to generate segmented pons masks for distortion analysis: OVS-reduced DTI, cropped full DTI, and T1-weighted images (A–C), pons manually segmented from panels A and B (D–F), and threshold pons mask demonstrating its shape (constant value 1 within borders) (G–I).
Fig. 10.
Color-coded FA map of the localized pons for two subjects using reduced-FOV OVS (A, C) and full FOV (B, D). (E–H) Matching distortion maps, where white mask demonstrates the outline of undistorted T1 pons, overlaid with the outline of the reduced-FOV and full-FOV pons edge segmentations. Color scale of edge demonstrates absolute radial displacement for each edge point. (I–L) SNR maps from diffusion-weighted data with and without OVS FOV reduction.
Fig. 11.
(A) Measured mean radial displacement and average edge displacement in the pons using reduced-FOV OVS and full FOV. (B) SNR measured in the pons and SCP for both diffusion data sets. *Significant result (p≤0.05).
Both full- and reduced-FOV DTI data sets of the pons used a SENSE factor of 1.4. An additional reduction of 4.67 was achieved using OVS for a total reduction in matrix size of 6.5 when accounting for both approaches, and an 8.3 total reduction in echo train length when including the use of partial Fourier half-scan. As expected, the additional reduction in phase-encoding steps with OVS beyond SENSE produced a loss in SNR relative to the full-FOV scan, measured at 50% in the pons, and 58% in the SCP compared to 46% expected due to a 4.67 reduction in the phase-encoding FOV alone (). Mean ADC values were 8.8% higher (p = 0.072) and mean FA values were 2.5% lower (p =0.654) when comparing diffusion properties between the full to the OVS-reduced data.
4. Discussion
Measurements of diffusion properties can identify local fiber orientations and other tissue characteristics on a voxel level. Such information is important not only to delineate the broad anatomical organization and connectivity of remote brain regions, but also to provide a baseline to compare against in the presence of disease and injury. Improving spatial resolution could be important to further refine the accuracy of characterizing white matter substructures and the fidelity of derived tractography. Our work is the first study to demonstrate a qualitative improvement in diffusion images with increased resolution arising from a combination of the use of ultra-high-field strength (7 T), parallel imaging-based acceleration, and reduced FOV. The up-to-6.8-fold reduction used here for the three midbrain planes has been previously demonstrated to result in significant geometry factor artifacts and SNR losses when implemented using SENSE alone [31,41]. In contrast, the combination of SENSE and reduced FOV provides a compromise between the imaging size, distortion level, and SNR. Further localizing measurements to the pons with greater than eight-fold reduction in echo train length demonstrated the benefit of combining SENSE and OVS to significantly reduce geometric distortions even while using a single-shot EPI readout. The compromise in SNR is balanced against the reduced distortion that, in some areas, is essential. Shortening the echo train length additionally enables for shorter echo times that can improve SNR for DTI [12]. In this study, the SNR loss was not significant enough to prevent accurate ADC and FA measurements and demonstration of fiber orientations in the localized pons.
For the three midbrain areas studied, the differences in diffusion properties found at the two resolutions qualitatively confirmed that partial volume effects are significant at 2-mm2 resolution, and that at higher resolution, fiber tracts in areas such as the optic chiasm, regional striation properties, and cerebellum are more clearly separated. This may be accomplished without significantly and negatively impacting image quality with artifacts or increased noise. The improved resolution generates distinct and significant differences in the measured FA and ADC properties in those areas. Prior studies have indicated that diffusion values can vary due to differences in voxel size and SNR [30,42,43]; however, SNR was determined to not be significantly different at the two resolutions imaged here. The measured SNR values were also above the thresholds of greater than 10 and 15 for ADC and FA, respectively, as suggested by Choi et al. [31], below which, greater variability is observed. The FA and ADC values in healthy controls in 16 distinct regions largely localized to the midbrain were also consistent with those previously published [13,44–47]. The measured differences in parameters between resolutions could impact comparisons between studies that use unmatched resolutions, as diffusion values vary because of acquisition differences rather than from biological factors. Our results also provide evidence for differences between specific anatomical features or tracts, which may vary in fiber density, orientation, degree of fiber crossing, and the presence of other nuclei or cell types.
Our work shares similarities to prior studies by Heidemann et al [16,28] and von Morze et al. [28], which that both applied parallel imaging and OVS to improve single-shot EPI performance for human diffusion MRI at 7 T. Von Morze et al. used ASSET parallel imaging with a quadratic-phase pulse for OVS, qualitatively describing DWI with EPI in the brain at a lower 1.8-mm isotropic resolution using two-fold FOV reduction. Heidemann et al. applied GRAPPA with an asymmetric adiabatic pulse for OVS, achieving a higher 800-µm isotropic resolution in a larger volume to primarily assess DTI tractography. Relative to our work using SENSE and a quadratic-phase pulse for OVS, 800 µm required a longer scan time of 65 min, a larger TR of 14 s, and a larger reduced-FOV size of 143×147 mm2. The 7- to 16-min scan times described here in a single slice using an FOV as small as 45×45 mm2 enabled imaging of three orientations in each subject at two resolutions to support ADC, FA, and geometric distortion analysis. An additional compromise in scan time would allow for a larger number of slices with this design. Overall, the FOV reduction applied using OVS alone was higher than that achieved previously, at 2.6 to 4.6 versus the prior factor of 1.39 to 1.53 [16]. The smaller reduced-FOV sizes enabled lower SENSE factors and higher overall reductions to prevent substantial SNR loss from g-factor noise.
Limitations of our approach include the high specific absorption rate (SAR) of the pulses used for the OVS preparation, which constrains the scan parameters applied for the study, limiting the number of slices, TR value, number of diffusion directions, and the minimum scan duration for a given resolution. Additional improvements using alternate pulse shapes or angles could help to alleviate these constraints, but have to be balanced against the ability to sufficiently excite and suppress signal to prevent fold-over artifacts in the localized FOV. Adiabatic waveforms with a variety of profile shapes offer insensitivity to B1 inhomogeneity for reduced-FOV use [26], but in general, have higher pulse energy than quadratic-phase pulses [37]. TR values and the number of slices could additionally be adjusted to enable greater volume coverage, but increase opportunities for motion artifacts, and constrain the number of scans possible for clinically based protocols. Despite this, relative to past 3-and 7-T DTI studies using parallel imaging with single-shot EPI and a full FOV [13,14,31,47], the 1-mm2 in-plane resolution achieved corresponds to a significant improvement with comparable imaging times and diffusion directions.
4. Conclusion
The work presented here demonstrates how outer-volume suppression and parallel imaging can be combined to reduce the FOV for localized high-resolution diffusion tensor imaging. In the midbrain, we obtained improved resolution without loss of image quality and with significantly reduced geometric distortion. A dependence of FA and ADC values on resolution was demonstrated in a number of areas. The parallel DTI-OVS approach described may offer a better strategy for assessing normal and pathological brain properties based on local diffusion measurements.
Fig. 5.
Diffusion-weighted OVS coronal hippocampus images at 2 mm×2 mm×2 mm (A) and 1 mm×1 mm×2 mm (B), showing each diffusion direction for b = 1000 s/mm2 and b = 0 s/mm2 image, ADC map, and color-coded FA map.
Acknowledgments
Funding for this work was provided by NIH Grant No. R01EB000461 and Training Grant No. T32EB001628.
References
- 1.Turner R, Le Bihan D. Single-shot diffusion imaging at 2.0 Tesla. J Magn Reson. 1990;86:445–452. [Google Scholar]
- 2.Bammer R, Auer M, Keeling SL, Augustin M, Stables LA, Prokesch RW, et al. Diffusion tensor imaging using single-shot SENSE-EPI. Magn Reson Med. 2002;48(1):128–136. doi: 10.1002/mrm.10184. [DOI] [PubMed] [Google Scholar]
- 3.Speck O, Stadler J, Zaitsev M. High resolution single-shot EPI at 7 T. MAGMA. 2008;21(1–2):73–86. doi: 10.1007/s10334-007-0087-x. [DOI] [PubMed] [Google Scholar]
- 4.Farzaneh F, Riederer SJ, Pelc NJ. Analysis of T2 limitations and off-resonance effects on spatial resolution and artifacts in echo-planar imaging. Magn Reson Med. 1990;14(1):123–139. doi: 10.1002/mrm.1910140112. [DOI] [PubMed] [Google Scholar]
- 5.Butts K, Riederer SJ, Ehman RL, Thompson RM, Jack CR. Interleaved echo planar imaging on a standard MRI system. Magn Reson Med. 1994;31(1):67–72. doi: 10.1002/mrm.1910310111. [DOI] [PubMed] [Google Scholar]
- 6.Feinberg DA, Oshio K. Phase errors in multi-shot echo planar imaging. Magn Reson Med. 1994;32(4):535–539. doi: 10.1002/mrm.1910320418. [DOI] [PubMed] [Google Scholar]
- 7.Ordidge RJ, Helpern JA, Qing ZX, Knight RA, Nagesh V. Correction of motional artifacts in diffusion-weighted MR images using navigator echoes. Magn Reson Imaging. 1994;12(3):455–460. doi: 10.1016/0730-725x(94)92539-9. [DOI] [PubMed] [Google Scholar]
- 8.Pipe JG, Farthing VG, Forbes KP. Multishot diffusion-weighted FSE using PROPELLER MRI. Magn Reson Med. 2002;47(1):42–52. doi: 10.1002/mrm.10014. [DOI] [PubMed] [Google Scholar]
- 9.Pierpaoli C, Jezzard P, Basser PJ, Barnett A, Di Chiro G. Diffusion tensor MR imaging of the human brain. Radiology. 1996;201(3):637–648. doi: 10.1148/radiology.201.3.8939209. [DOI] [PubMed] [Google Scholar]
- 10.Pruessmann KP, Weiger M, Scheidegger MB, Boesiger P. SENSE: sensitivity encoding for fast MRI. Magn Reson Med. 1999;42(5):952–962. [PubMed] [Google Scholar]
- 11.Griswold MA, Jakob PM, Heidemann RM, Nittka M, Jellus V, Wang J, et al. Generalized autocalibrating partially parallel acquisitions (GRAPPA) Magn Reson Med. 2002;47(6):1202–1210. doi: 10.1002/mrm.10171. [DOI] [PubMed] [Google Scholar]
- 12.Jaermann T, Crelier G, Pruessmann KP, Golay X, Netsch T, van Muiswinkel AM, et al. SENSE-DTI at 3 T. Magn Reson Med. 2004;51(2):230–236. doi: 10.1002/mrm.10707. [DOI] [PubMed] [Google Scholar]
- 13.Alexander AL, Lee JE, Wu YC, Field AS. Comparison of diffusion tensor imaging measurements at 3.0 T versus 1.5 T with and without parallel imaging. Neuroimaging Clin N Am. 2006;16(2):299–309. xi. doi: 10.1016/j.nic.2006.02.006. [DOI] [PubMed] [Google Scholar]
- 14.Truong TK, Chen B, Song AW. Integrated SENSE DTI with correction of susceptibility- and eddy current-induced geometric distortions. Neuroimage. 2008;40(1):53–58. doi: 10.1016/j.neuroimage.2007.12.001. [DOI] [PMC free article] [PubMed] [Google Scholar]
- 15.Heidemann RM, Porter DA, Anwander A, Feiweier T, Heberlein K, Knosche TR, et al. Diffusion imaging in humans at 7 T using readout-segmented EPI and GRAPPA. Magn Reson Med. 2010;64(1):9–14. doi: 10.1002/mrm.22480. [DOI] [PubMed] [Google Scholar]
- 16.Heidemann RM, Anwander A, Feiweier T, Knosche TR, Turner R. k-Space and q-space: combining ultra-high spatial and angular resolution in diffusion imaging using ZOOPPA at 7 T. Neuroimage. 2012;60(2):967–978. doi: 10.1016/j.neuroimage.2011.12.081. [DOI] [PubMed] [Google Scholar]
- 17.Feinberg DA, Hoenninger JC, Crooks LE, Kaufman L, Watts JC, Arakawa M. Inner volume MR imaging: technical concepts and their application. Radiology. 1985;156(3):743–747. doi: 10.1148/radiology.156.3.4023236. [DOI] [PubMed] [Google Scholar]
- 18.Wang JJ, Deichmann R, Turner R, Ordidge R. 3D DT-MRI using a reduced-FOV approach and saturation pulses. Magn Reson Med. 2004;51(4):853–857. doi: 10.1002/mrm.20012. [DOI] [PubMed] [Google Scholar]
- 19.Jeong EK, Kim SE, Guo J, Kholmovski EG, Parker DL. High-resolution DTI with 2D interleaved multislice reduced FOV single-shot diffusion-weighted EPI (2D ss-rFOV-DWEPI) Magn Reson Med. 2005;54(6):1575–1579. doi: 10.1002/mrm.20711. [DOI] [PubMed] [Google Scholar]
- 20.Wheeler-Kingshott CA, Trip SA, Symms MR, Parker GJ, Barker GJ, Miller DH. In vivo diffusion tensor imaging of the human optic nerve: pilot study in normal controls. Magn Reson Med. 2006;56(2):446–451. doi: 10.1002/mrm.20964. [DOI] [PubMed] [Google Scholar]
- 21.Saritas EU, Cunningham CH, Lee JH, Han ET, Nishimura DG. DWI of the spinal cord with reduced FOV single-shot EPI. Magn Reson Med. 2008;60(2):468–473. doi: 10.1002/mrm.21640. [DOI] [PubMed] [Google Scholar]
- 22.Dowell NG, Jenkins TM, Ciccarelli O, Miller DH, Wheeler-Kingshott CA. Contiguous-slice zonally oblique multislice (CO-ZOOM) diffusion tensor imaging: examples of in vivo spinal cord and optic nerve applications. J Magn Reson Imaging. 2009;29(2):454–460. doi: 10.1002/jmri.21656. [DOI] [PubMed] [Google Scholar]
- 23.Finsterbusch J. High-resolution diffusion tensor imaging with inner field-of-view EPI. J Magn Reson Imaging. 2009;29(4):987–993. doi: 10.1002/jmri.21717. [DOI] [PubMed] [Google Scholar]
- 24.Hiepe P, Herrmann KH, Ros C, Reichenbach JR. Diffusion weighted inner volume imaging of lumbar disks based on turbo-STEAM acquisition. Z Med Phys. 2011 doi: 10.1016/j.zemedi.2010.10.009. [DOI] [PubMed] [Google Scholar]
- 25.Le Roux P, Gilles RJ, McKinnon GC, Carlier PG. Optimized outer volume suppression for single-shot fast spin-echo cardiac imaging. J Magn Reson Imaging. 1998;8(5):1022–1032. doi: 10.1002/jmri.1880080505. [DOI] [PubMed] [Google Scholar]
- 26.Pfeuffer J, van de Moortele PF, Yacoub E, Shmuel A, Adriany G, Andersen P, et al. Zoomed functional imaging in the human brain at 7 Tesla with simultaneous high spatial and high temporal resolution. Neuroimage. 2002;17(1):272–286. doi: 10.1006/nimg.2002.1103. [DOI] [PubMed] [Google Scholar]
- 27.Wilm BJ, Svensson J, Henning A, Pruessmann KP, Boesiger P, Kollias SS. Reduced field-of-view MRI using outer volume suppression for spinal cord diffusion imaging. Magn Reson Med. 2007;57(3):625–630. doi: 10.1002/mrm.21167. [DOI] [PubMed] [Google Scholar]
- 28.von Morze C, Kelley DA, Shepherd TM, Banerjee S, Xu D, Hess CP. Reduced field-of-view diffusion-weighted imaging of the brain at 7 T. Magn Reson Imaging. 2010;28(10):1541–1545. doi: 10.1016/j.mri.2010.06.025. [DOI] [PMC free article] [PubMed] [Google Scholar]
- 29.Wargo CJ, Gore JC. 20th Proc Int Soc Magn Reson Med. Australia: Melbourne; 2012. Localized high resolution DTI of the human brain using parallel imaging and outer-volume suppression at 7 T. [DOI] [PMC free article] [PubMed] [Google Scholar]
- 30.Polders DL, Leemans A, Hendrikse J, Donahue MJ, Luijten PR, Hoogduin JM. Signal to noise ratio and uncertainty in diffusion tensor imaging at 1.5, 3.0, and 7.0 Tesla. JMRI. 2011;33(6):1456–1463. doi: 10.1002/jmri.22554. [DOI] [PubMed] [Google Scholar]
- 31.Choi S, Cunningham DT, Aguila F, Corrigan JD, Bogner J, Mysiw WJ, et al. DTI at 7 and 3 T: systematic comparison of SNR and its influence on quantitative metrics. Magn Reson Imaging. 2011;29(6):739–751. doi: 10.1016/j.mri.2011.02.009. [DOI] [PubMed] [Google Scholar]
- 32.Jeong HK, Gore JC, Anderson AW. High-resolution human diffusion tensor imaging using 2-D navigated multishot SENSE EPI at 7 T. Magn Reson Med. 2012 doi: 10.1002/mrm.24320. [DOI] [PMC free article] [PubMed] [Google Scholar]
- 33.Vaughan JT, Garwood M, Collins CM, Liu W, DelaBarre L, Adriany G, et al. 7 T vs. 4 T: RF power, homogeneity, and signal-to-noise comparison in head images. Magn Reson Med. 2001;46(1):24–30. doi: 10.1002/mrm.1156. [DOI] [PubMed] [Google Scholar]
- 34.Wargo CJ, Jankiewicz M, Gore JC. 18th Proc Int Soc Magn Reson Med. Sweden: Stockholm; 2010. Comparison of reduced-FOV techniques for high resolution imaging at 7 T. [Google Scholar]
- 35.Boehlen JM, Ray M, Bodenhausen G. Refocusing with chirped pulses for broadband excitation without phase dispersion. J Magn Reson. 1989;84:191–197. [Google Scholar]
- 36.Schulte RF, Henning A, Tsao J, Boesiger P, Pruessmann KP. Design of broadband RF pulses with polynomial-phase response. J Magn Reson. 2007;186(2):167–175. doi: 10.1016/j.jmr.2007.02.004. [DOI] [PubMed] [Google Scholar]
- 37.Schulte RF, Tsao J, Boesiger P, Pruessmann KP. Equi-ripple design of quadratic-phase RF pulses. J Magn Reson. 2004;166(1):111–122. doi: 10.1016/j.jmr.2003.10.009. [DOI] [PubMed] [Google Scholar]
- 38.Wargo CJ, Gore JC. 19th Proc Int Soc Magn Reson Med. Canada: Montreal; 2011. Rapid acquisition of targeted high resolution human brain images using a combined SENSE, inner volume imaging, and multi-shot EPI spin echo sequence at 7 T. [Google Scholar]
- 39.Basser PJ, Pierpaoli C. Microstructural and physiological features of tissues elucidated by quantitative-diffusion-tensor MRI. J Magn Reson B. 1996;111(3):209–219. doi: 10.1006/jmrb.1996.0086. [DOI] [PubMed] [Google Scholar]
- 40.Rohde GK, Aldroubi A, Dawant BM. The adaptive bases algorithm for intensity-based nonrigid image registration. IEEE Trans Med Imaging. 2003;22(11):1470–1479. doi: 10.1109/TMI.2003.819299. [DOI] [PubMed] [Google Scholar]
- 41.Jaermann T, Pruessmann KP, Valavanis A, Kollias S, Boesiger P. Influence of SENSE on image properties in high-resolution single-shot echo-planar DTI. Magn Reson Med. 2006;55(2):335–342. doi: 10.1002/mrm.20769. [DOI] [PubMed] [Google Scholar]
- 42.Oouchi H, Yamada K, Sakai K, Kizu O, Kubota T, Ito H, et al. Diffusion anisotropy measurement of brain white matter is affected by voxel size: underestimation occurs in areas with crossing fibers. AJNR Am J Neuroradiol. 2007;28(6):1102–1106. doi: 10.3174/ajnr.A0488. [DOI] [PMC free article] [PubMed] [Google Scholar]
- 43.Landman BA, Farrell JA, Huang H, Prince JL, Mori S. Diffusion tensor imaging at low SNR: nonmonotonic behaviors of tensor contrasts. Magn Reson Imaging. 2008;26(6):790–800. doi: 10.1016/j.mri.2008.01.034. [DOI] [PMC free article] [PubMed] [Google Scholar]
- 44.Xu D, Henry RG, Mukherjee P, Carvajal L, Miller SP, Barkovich AJ, et al. Single-shot fast spin-echo diffusion tensor imaging of the brain and spine with head and phased array coils at 1.5 T and 3.0 T. Magn Reson Imaging. 2004;22(6):751–759. doi: 10.1016/j.mri.2004.01.075. [DOI] [PubMed] [Google Scholar]
- 45.Karampinos DC, Van AT, Olivero WC, Georgiadis JG, Sutton BP. High resolution reduced-FOV diffusion tensor imaging of the human pons with multi-shot variable density spiral at 3 T. Conf Proc IEEE Eng Med Biol Soc. 2008;2008:5761–5764. doi: 10.1109/IEMBS.2008.4650523. [DOI] [PubMed] [Google Scholar]
- 46.Chen HJ, Panigrahy A, Dhall G, Finlay JL, Nelson MD, Jr, Bluml S. Apparent diffusion and fractional anisotropy of diffuse intrinsic brain stem gliomas. AJNR Am J Neuroradiol. 2010;31(10):1879–1885. doi: 10.3174/ajnr.A2179. [DOI] [PMC free article] [PubMed] [Google Scholar]
- 47.Kasahara K, Hashimoto K, Abo M, Senoo A. Voxel- and atlas-based analysis of diffusion tensor imaging may reveal focal axonal injuries in mild traumatic brain injury—comparison with diffuse axonal injury. Magn Reson Imaging. 2012;30(4):496–505. doi: 10.1016/j.mri.2011.12.018. [DOI] [PubMed] [Google Scholar]


