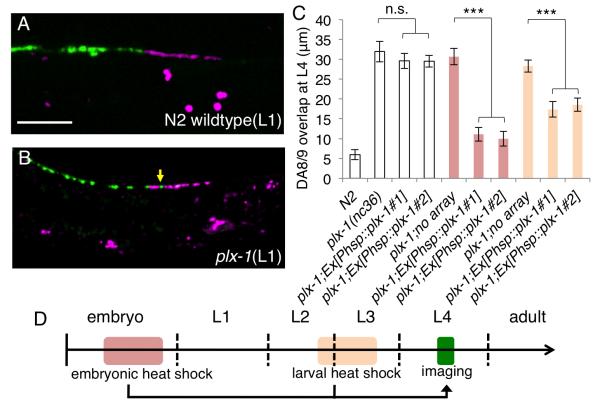
Figure 4. PLX-1 functions throughout development.
(A and B) Synaptic tiling at early L1 stage of wild type (A) and plx-1 mutants (B). A tiling defect was observed at this stage in the plx-1 mutants (yellow arrow). Scale bar, 10μm. (C) Quantification of DA8/DA9 overlap at L4 stage. Two independent transgenic lines and their siblings without the transgenes were quantified. Heat shock induction of plx-1 gene expression from the hsp promoter at the embryonic (red bars) and larval (orange bars) stages significantly rescued the plx-1 mutant phenotype while there was no significant difference between transgenic animals and non-transgenic siblings without heat shock (white bars). Error bars; standard error of mean. Triple asterisks: p<0.001, n.s.: not significant (ANOVA/Tukey-HSD). (D) Schematic representation of worm developmental time course and the timing of heat shock and imaging.

