

Abstract
Chronic exposure to excessive levels of nutrients is postulated to affect the function of several organs and tissues and to contribute to the development of the many complications associated with obesity and the metabolic syndrome, including type 2 diabetes. To study the mechanisms by which excessive levels of glucose and fatty acids affect the pancreatic beta-cell and the secretion of insulin, we have established a chronic nutrient infusion model in the rat. The procedure consists of catheterizing the right jugular vein and left carotid artery under general anesthesia; allowing a 7-day recuperation period; connecting the catheters to the pumps using a swivel and counterweight system that enables the animal to move freely in the cage; and infusing glucose and/or Intralipid (a soybean oil emulsion which generates a mixture of approximately 80% unsaturated/20% saturated fatty acids when infused with heparin) for 72 hr. This model offers several advantages, including the possibility to finely modulate the target levels of circulating glucose and fatty acids; the option to co-infuse pharmacological compounds; and the relatively short time frame as opposed to dietary models. It can be used to examine the mechanisms of nutrient-induced dysfunction in a variety of organs and to test the effectiveness of drugs in this context.
Keywords: Biomedical Engineering, Issue 78, Medicine, Anatomy, Physiology, Basic Protocols, Surgery, Metabolic Diseases, Infusions, Intravenous, Infusion Pumps, Glucolipotoxicity, Rat, Infusion, Glucose, Intralipid, Catheter, canulation, canula, diabetes, animal model
Introduction
Chronically elevated levels of glucose and lipids in the circulation have been proposed to contribute to the pathogenesis of type 2 diabetes by altering the function of several organs implicated in the maintenance of glucose homeostasis including, but not limited to, the pancreatic beta-cell (reviewed in 1). The glucotoxicity hypothesis posits that chronic hyperglycemia aggravates the beta-cell defect which gave rise to hyperglycemia in the first place, thus creating a vicious cycle and contributing to the deterioration of glucose control in type 2 diabetes patients. Likewise, the glucolipotoxicity hypothesis proposes that concomitant elevations of glucose and lipid levels, as often observed in type 2 diabetes, are detrimental to the beta cell.
Deciphering the cellular and molecular mechanisms of the deleterious effects of chronically elevated nutrients on pancreatic beta-cell function is key to the understanding of the pathogenesis of type 2 diabetes 1. To that end, a large number of studies have examined the mechanisms of chronic nutrient excess ex vivo in isolated islets of Langerhans or in vitro in clonal, insulin-secreting cell lines. However, translation of the findings obtained in these model systems to the whole organism is complex, in particular because the concentrations of fatty acids used in cultured cells or islets rarely match the circulating levels in the vicinity of the beta cells in vivo 2. On the other hand, the mechanisms of beta-cell failure in response to nutrient excess have been examined in rodent models of diabetes, as exemplified by the Zucker Diabetic Fatty rat 3,4, the gerbil Psammomys obesus 5 and the high-fat diet-fed mouse 6. These models, however, are characterized by intrinsic metabolic abnormalities and are not easily amenable to manipulations of blood glucose and/or lipid levels in a more controlled and less chronic setting. To be able to alter circulating nutrient levels in a timeframe of days in otherwise normal animals, we have developed a chronic infusion model in normal rats which enables us to examine the effects of lipids and glucose, alone or in combination, on physiological parameters and function 7,8.
Protocol
Overview: The procedure consists of catheterizing the right jugular vein and left carotid artery under general anesthesia; allowing a 7-day recuperation period; connecting the catheters to the pumps using a swivel and counterweight system that enables the animal to move freely in the cage; and infusing glucose and/or Intralipid (a soybean oil emulsion which generates a mixture of approximately 80% unsaturated/20% saturated fatty acids when infused with heparin 9) for 72 hr.
1. Canulation of the Right Jugular Vein and the Left Carotid Artery
Sterilize surgical instruments. Canulation tubing must also be cold-sterilized using a liquid sterilizing agent (2.6% glutaraldehyde) prior to the procedure. Immerse the tubing in an autoclaved container for 16-24 hr. Rinse and flush thoroughly with sterile distilled water to remove all traces of glutaraldehyde before use.
Weigh the rat to calculate drug dosages: Carprofen 5 mg/kg: dilution 1/10 = Body weight (g) x 0.001 ml SC (analgesic) Glycopyrrolate 0.01 mg/kg : dilution 1/10 = BW (g) X 0.0012 ml SC (anticholinergic)
Anesthetize the rat using isoflurane and oxygen.
Place the rat on its stomach. Shave the area behind the ears to the base of the shoulders. Lay the rat on its back. Shave the region under the neck to the front paws.
Prep the surgical site with chlorhexidine, alcohol, and iodine. Administer drugs.
Transfer the rat to the surgical field.
Using aseptic technique, canulate the right jugular vein and the left carotid artery with a PE-50 canula attached to a 1 ml syringe filled with 5 U of heparinized saline. Flush the canulas with 50 U of heparinized saline to avoid clotting during the recovery period. Use blunted 23G needles. Close each canula with a 23G pin.
After the surgery, trim approximately 2.5 mm off the bottom incisors and place the rat in an infusion jacket to prevent the canulas from being eaten.
Provide oxygen (1 L/min for 10 min) to help evacuate isoflurane.
Place the rat in a heated cage until it is fully awake.
Operate four rats to use one per infusion condition (Table 1).
2. Post-operative Care (Post-surgical Treatment and Connection of the Catheters)
Weigh the rats on day 1 and day 2 post-surgery.
Administer glycopyrrolate (BW(g) x 0.00048 ml) SC twice on day 1 post-surgery and once on day 2 post-surgery.
Additional supportive treatments can be administered if necessary: fluids, heating pad, wet diet, oxygen therapy, analgesics, anticholinergics.
On day 7 post-surgery, weigh the rats to calculate the flow rates for infusion.
Connect each rat to an infusion system using a tether and swivel mounted on a cage grill top (Figure 1).
Flush the canulas with 5 U of heparinized saline to remove clots. Flush the canulas once more with 50 U of heparinized saline to prevent clotting.
Allow the rats to acclimate to the tether and swivel for at least 24 hr before starting the infusion.
3. Infusion
Draw 0.15 ml of blood from the carotid of each rat and measure glycemia. Flush the jugular canulas. Use 50 U of heparinized saline to prevent clotting in both canulas of each rat.
Transfer the blood sample to a 0.5 ml collection tube containing 2% EDTA. Centrifuge at 10,000 rpm for 2 min and freeze the plasma at -20 °C.
Fill two 60 ml syringes for each of the infusion conditions listed below. Place Syringe 1 on the front position of the pump and place Syringe 2 on the back position of the pump.
Join each pair of solutions together with y-connectors and CO-EX T22 tubing that has been sterilized. Place the syringes on a Harvard 33 dual syringe pump.
Change the cage bottom and remove all food from the cage grill top.
Weigh 150 g of standard chow and place on the cage grill top.
Connect the syringes to the swivel on the cage grill. Flush the syringes properly to remove trapped air from the lines.
Calculate the infusion flow rates using the body weight that was taken prior to connecting the rat to the infusion system. Rates are calculated with a Microsoft Excel file that converts the glucose infusion rate (GIR) into ml/h.
Set the pump to administer flow rates for 60 ml syringes according to the manufacturer's settings. Enter the rate for Syringe 1 (front syringe) and the rate for Syringe 2 (back syringe).
Start the pump.
4. Monitoring
After starting the pump, verify that there is no leaking from the swivel or from the canulas and that infusion tubing is not twisted. Also verify that there are no air bubbles in the tubing.
After 3 hr of infusion, take a blood sample to monitor glycemia. Repeat after 6, 24, 48, and 72 hr of infusion. As a precaution, glycemia is also monitored after 30, 34, 54, and 60 hr of the infusion. Blood glucose can be measured using one drop of whole blood using a portable glucose monitor. This limits the amount of blood drawn during the infusion and therefore avoids significantly altering blood volume and/or hematocrit.
The rate for Syringe 1 is modified based on glycemia values to maintain blood glucose at 220-250 mg/dl. The rate for Syringe 2 does not change during the 72 hr of infusion because free fatty acids are maintained at 1 mmol/L.
Infusion conditions are paired so that the volume received for the control animals is equivalent to the volume received for the test animals (Table 1).
After 24 hr of infusion, change the cage bottom and weigh the food remaining in the cage grill. Return the uneaten portion to the cage grill. Repeat after 48 hr.
Refill syringes daily as needed during the 72 hr of infusion.
During the infusion, always observe the rat for any signs of inflammation or discomfort. Administer appropriate care if needed.
5. Post-infusion Euthanasia
After 72 hr of infusion, rats are anesthetized intravenously with 0.5 ml of a ketamine/xylazine cocktail (182 mg/kg of ketamine and 11.6 mg/kg of xylazine diluted 1:2 with 0.9% NaCl).
The toe-pinch reflex is used to verify the level of anesthesia. Additional anesthetic is administered as needed.
When the rat is anesthetized, the abdominal cavity is opened with surgical scissors. The rat is exsanguinated by drawing 10-15 ml of blood in a syringe from the aorta or the vena cava.
Representative Results
Out of a series of 42 rats which underwent surgery, 5 rats were lost during the post-operative period and 1 rat was lost during the infusion, representing an overall success rate of 86%. The average body weight of the 37 rats that were eventually infused was 608±5 g before surgery and 588±6 g at the initiation of the infusion (mean±SE; n=37; P<0.0001 by paired t-test). The following representative results were obtained in 2 infusion groups: Saline (SAL), and Glucose + Intralipid (GLU+IL). Figures 2A and 2B show blood glucose and fatty acid levels, respectively, during the 72-hr infusion period. By design, the glucose levels are maintained around 220-250 mg/dl throughout the infusion, based on regular measurements and adjustments of the glucose infusion rate (GIR) as shown in Figure 3. Rodents have a strong capacity to compensate for the glucose infusion by increasing endogenous insulin secretion. Therefore, the GIR must be increased during the course of the infusion for blood glucose levels to be maintained at a relative steady-state. Nevertheless, blood glucose levels tend to decrease towards the end of the infusion, as seen in Figure 2A. Since the animals are infused with caloric nutrients, they spontaneously decrease their food intake (Figure 4).
| Infusion Condition | Syringe 1 (front position) | Syringe 2 (back position) |
| 1 | Dextrose 70% | Saline |
| 2 | Saline | Saline |
| 3 | Dextrose 70% | Intralipid 20% + Heparin 20U/ml |
| 4 | Saline | Intralipid 20% % + Heparin 20U/ml |
Table 1. Infusion regimens.
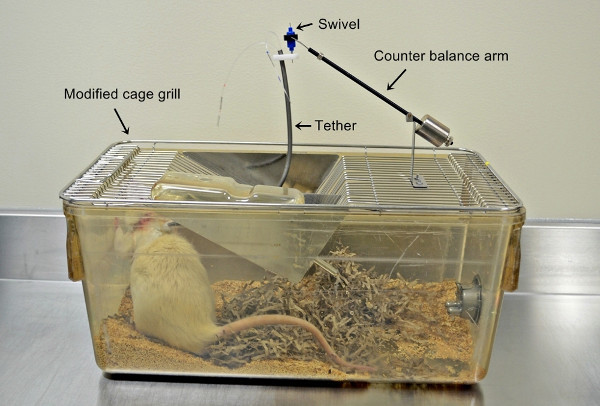 Figure 1. Photograph of the infusion system showing the rat with the catheters in place and the tether, swivel, and counterbalance arm mounted on the cage grill.
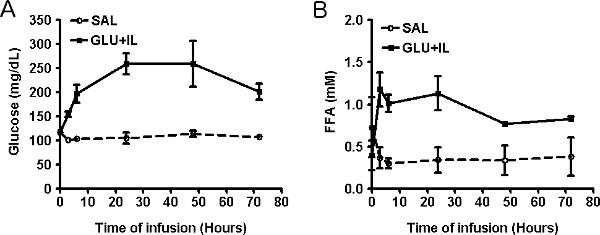 Figure 2. Plasma levels of glucose (A) and free fatty acids (B) during infusion of saline (SAL) or co-infusion of glucose and Intralipid (GLU+IL) in 6-month old Wistar rats. Data are mean ± SEM of 3-4 animals in each group.
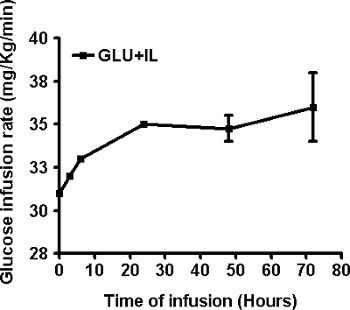 Figure 3. Adjustment of the glucose infusion rate during the co-infusion of glucose and Intralipid (GLU+IL) in 6-month old Wistar rats. Data are mean ± SEM of 4 animals.
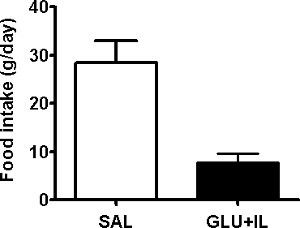 Figure 4. Average daily food intake of 6-month old Wistar rats infused with saline (SAL) or co-infused with glucose and Intralipid (GLU+IL). Data are mean ± SEM of 3-4 animals in each group. **p<0.01.
Discussion
Although a number of previous studies have employed chronic infusions of glucose (e.g. 10-15) or lipids (e.g. 16,17) in rodents, to our knowledge the combined infusion of both fuels has only been reported in mice 18. The chronic infusion model presented here offers several advantages to study the effects on nutrient excess on a variety of biological functions in rats. First, it does not involve genetically obese rodents, and since common obesity in humans is polygenic 19, the findings are therefore more likely to be relevant to the effects of nutrient oversupply in the general population. Second, this model offers the possibility to test the effects of different nutrients (particularly sugars or fats) at different circulating levels, by changing their nature and the infusion flow rate. Third, the IV route of administration enables the co-infusion of compounds or drugs together with the nutrients 20. Finally, the relatively short time frame of the experiment (72 hr vs. weeks for high-fat diet induced models) is cost- and time-effective for preclinical studies.
This model also has some disadvantages and limitations. First, as any surgical model is requires highly trained and skilled personnel in aseptic surgery. Second, as mentioned in the Representative Results section the animals tend to compensate for the glucose infusion by increasing endogenous insulin secretion, which requires frequent monitoring of blood glucose levels and adjustments of the GIR to maintain the target blood glucose levels throughout the infusion. Third, the procedure is not easily applicable to mice, which would be required in order to use it in genetically modified animals. In our experience, catheterization of both jugular vein and carotid artery in mice in technically challenging and the easiest approach in these smaller animals is to place a jugular catheter for the infusion and to sample from a peripheral vessel. This, however considerably limits the volume and frequency of sampling during the infusion.
Given the focus of our laboratory, we have used this model to study the mechanisms of glucolipotoxicity in the pancreatic beta-cell 7,8. However, it can be applied to study the effects of nutrient excess in any tissue and organ such as, but not limited to, the heart 21, skeletal muscle, 22, and liver 23.
Disclosures
Vincent Poitout is co-founder of and received research contracts from Bêtagenex Inc., a contract research organization which offers the infusion model presented in this article as a commercial service.
Acknowledgments
This work was supported by the National Institutes of Health (R01DK58096 to Vincent Poitout). Vincent Poitout holds the Canada Research Chair in Diabetes and Pancreatic Beta-cell Function. Bader Zarrouki received post-doctoral fellowships from Merck and Eli Lilly. Ghislaine Fontés was supported by a post-doctoral fellowship from the Canadian Diabetes Association.
References
- Poitout V, Robertson RP. Glucolipotoxicity: fuel excess and beta-cell dysfunction. Endocr. Rev. 2008;29:351–366. doi: 10.1210/er.2007-0023. [DOI] [PMC free article] [PubMed] [Google Scholar]
- Poitout V, et al. Glucolipotoxicity of the pancreatic beta cell. Biochim. Biophys. Acta. 2010;1801:289–298. doi: 10.1016/j.bbalip.2009.08.006. [DOI] [PMC free article] [PubMed] [Google Scholar]
- Unger RH. Minireview: weapons of lean body mass destruction: the role of ectopic lipids in the metabolic syndrome. Endocrinology. 2003;144:5159–5165. doi: 10.1210/en.2003-0870. [DOI] [PubMed] [Google Scholar]
- Harmon JS, Gleason CE, Tanaka Y, Poitout V, Robertson RP. Antecedent hyperglycemia, not hyperlipidemia, is associated with increased islet triacylglycerol content and decreased insulin gene mRNA level in Zucker diabetic fatty rats. Diabetes. 2001;50:2481–2486. doi: 10.2337/diabetes.50.11.2481. [DOI] [PubMed] [Google Scholar]
- Bachar E, Ariav Y, Cerasi E, Kaiser N, Leibowitz G. Neuronal nitric oxide synthase protects the pancreatic beta cell from glucolipotoxicity-induced endoplasmic reticulum stress and apoptosis. Diabetologia. 2010;53:2177–2187. doi: 10.1007/s00125-010-1833-6. [DOI] [PubMed] [Google Scholar]
- Peyot ML, et al. Beta-cell failure in diet-induced obese mice stratified according to body weight gain: secretory dysfunction and altered islet lipid metabolism without steatosis or reduced beta-cell mass. Diabetes. 2010;59:2178–2187. doi: 10.2337/db09-1452. [DOI] [PMC free article] [PubMed] [Google Scholar]
- Hagman DK, et al. Cyclical and alternating infusions of glucose and intralipid in rats inhibit insulin gene expression and Pdx-1 binding in islets. Diabetes. 2008;57:424–431. doi: 10.2337/db07-1285. [DOI] [PMC free article] [PubMed] [Google Scholar]
- Fontes G, et al. Glucolipotoxicity age-dependently impairs beta cell function in rats despite a marked increase in beta cell mass. Diabetologia. 2010;53:2369–2379. doi: 10.1007/s00125-010-1850-5. [DOI] [PMC free article] [PubMed] [Google Scholar]
- Stein DT, et al. Essentiality of circulating fatty acids for glucose-stimulated insulin secretion in the fasted rat. J. Clin. Invest. 1996;97:2728–2735. doi: 10.1172/JCI118727. [DOI] [PMC free article] [PubMed] [Google Scholar]
- Leahy JL, Cooper HE, Weir GC. Impaired insulin secretion associated with near normoglycemia. Study in normal rats with 96-h in vivo glucose infusions. Diabetes. 1987;36:459–464. doi: 10.2337/diab.36.4.459. [DOI] [PubMed] [Google Scholar]
- Hager SR, Jochen AL, Kalkhoff RK. Insulin resistance in normal rats infused with glucose for 72 h. The American Journal of Physiology. 1991;260:353–362. doi: 10.1152/ajpendo.1991.260.3.E353. [DOI] [PubMed] [Google Scholar]
- Laybutt DR, Chisholm DJ, Kraegen EW. Specific adaptations in muscle and adipose tissue in response to chronic systemic glucose oversupply in rats. The American Journal of Physiology. 1997;273:E1–E9. doi: 10.1152/ajpendo.1997.273.1.E1. [DOI] [PubMed] [Google Scholar]
- Jonas JC, et al. High glucose stimulates early response gene c-Myc expression in rat pancreatic beta cells. The Journal of Biological Chemistry. 2001;276:35375–35381. doi: 10.1074/jbc.M105020200. [DOI] [PubMed] [Google Scholar]
- Tang C, et al. Glucose-induced beta cell dysfunction in vivo in rats: link between oxidative stress and endoplasmic reticulum stress. Diabetologia. 2012;55:1366–1379. doi: 10.1007/s00125-012-2474-8. [DOI] [PubMed] [Google Scholar]
- Alonso LC, et al. Glucose infusion in mice: a new model to induce beta-cell replication. Diabetes. 2007;56:1792–1801. doi: 10.2337/db06-1513. [DOI] [PMC free article] [PubMed] [Google Scholar]
- Magnan C, Gilbert M, Kahn BB. Chronic free fatty acid infusion in rats results in insulin resistance but no alteration in insulin-responsive glucose transporter levels in skeletal muscle. Lipids. 1996;31:1141–1149. doi: 10.1007/BF02524288. [DOI] [PubMed] [Google Scholar]
- Goh TT, et al. Lipid-induced beta-cell dysfunction in vivo in models of progressive beta-cell failure. Am. J. Physiol. Endocrinol. Metab. 2007;292:549–560. doi: 10.1152/ajpendo.00255.2006. [DOI] [PubMed] [Google Scholar]
- Pascoe J, et al. Free fatty acids block glucose-induced beta-cell proliferation in mice by inducing cell cycle inhibitors p16 and p18. Diabetes. 2012;61:632–641. doi: 10.2337/db11-0991. [DOI] [PMC free article] [PubMed] [Google Scholar]
- Bell CG, Walley AJ, Froguel P. The genetics of human obesity. Nature Reviews. Genetics. 2005;6:221–234. doi: 10.1038/nrg1556. [DOI] [PubMed] [Google Scholar]
- Fontes G, Hagman DK, Latour MG, Semache M, Poitout V. Lack of preservation of insulin gene expression by a glucagon-like peptide 1 agonist or a dipeptidyl peptidase 4 inhibitor in an in vivo model of glucolipotoxicity. Diabetes Res. Clin. Pract. 2010;87:322–328. doi: 10.1016/j.diabres.2009.12.020. [DOI] [PMC free article] [PubMed] [Google Scholar]
- Crawford PA, Schaffer JE. Metabolic stress in the myocardium: Adaptations of gene expression. Journal of Molecular and Cellular Cardiology. 2012. [DOI] [PMC free article] [PubMed]
- Kewalramani G, Bilan PJ, Klip A. Muscle insulin resistance: assault by lipids, cytokines and local macrophages. Curr. Opin. Clin. Nutr. Metab Care. 2010;13:382–390. doi: 10.1097/MCO.0b013e32833aabd9. [DOI] [PubMed] [Google Scholar]
- Cusi K. Role of obesity and lipotoxicity in the development of nonalcoholic steatohepatitis: pathophysiology and clinical implications. Gastroenterology. 2012;142:711–725. doi: 10.1053/j.gastro.2012.02.003. [DOI] [PubMed] [Google Scholar]