

Abstract
In primates and other animals, reverse transcription of mRNA followed by genomic integration creates retroduplications. Expressed retroduplications are either “retrogenes” coding for functioning proteins, or expressed “processed pseudogenes,” which can function as noncoding RNAs. To date, little is known about the variation in retroduplications in terms of their presence or absence across individuals in the human population. We have developed new methodologies that allow us to identify “novel” retroduplications (i.e., those not present in the reference genome), to find their insertion points, and to genotype them. Using these methods, we catalogued and analyzed 174 retroduplication variants in almost one thousand humans, which were sequenced as part of Phase 1 of The 1000 Genomes Project Consortium. The accuracy of our data set was corroborated by (1) multiple lines of sequencing evidence for retroduplication (e.g., depth of coverage in exons vs. introns), (2) experimental validation, and (3) the fact that we can reconstruct a correct phylogenetic tree of human subpopulations based solely on retroduplications. We also show that parent genes of retroduplication variants tend to be expressed at the M-to-G1 transition in the cell cycle and that M-to-G1 expressed genes have more copies of fixed retroduplications than genes expressed at other times. These findings suggest that cell division is coupled to retrotransposition and, perhaps, is even a requirement for it.
Retrotransposition has been widespread in animal evolution (Rhesus Macaque Genome Sequencing and Analysis Consortium 2007; Cordaux and Batzer 2009; de Koning et al. 2011; Locke et al. 2011; Hancks and Kazazian 2012), and extensive variation (presence/absence from individual genomes) in retrotransposons in the human population has also been observed (Tsirigos and Rigoutsos 2009; Ewing and Kazazian 2010; Huang et al. 2010; Iskow et al. 2010; Witherspoon et al. 2010; Hormozdiari et al. 2011; Stewart et al. 2011). L1 retrotransposons are believed to be able to incorporate a gene's mRNA instead of their own RNA (Esnault et al. 2000) into the genome, and thus create a retroduplication—an exon-only version of a gene inserted into a novel genomic context, which may be full-length or truncated. It is reasonable to expect that retroduplications are not expressed since they lack the promoters of their parent genes and, consequently, are considered nonfunctional, i.e., “dead on arrival.”
However, some retroduplications can become “retrogenes” coding for proteins, identical or very similar to those encoded by their parent genes. These expressed retrogenes can also gain new functions by accumulating mutations and, consequently, diverging from their parent gene (Supplemental Fig. S1; McCarrey and Thomas 1987; Betrán et al. 2002; Burki and Kaessmann 2004; Emerson et al. 2004; Marques et al. 2005; Vinckenbosch et al. 2006; Bai et al. 2007; Sakai et al. 2007; Baertsch et al. 2008; Kaessmann et al. 2009). Other retroduplications, termed “processed pseudogenes,” acquire mutations in the coding sequence that disable them from coding for functional proteins. However, recent studies provided evidence that the RNA of these processed pseudogenes may remain under selective constraint, indicating functional relevance (Tam et al. 2008; Watanabe et al. 2008; Poliseno et al. 2010; Wen et al. 2011; Pei et al. 2012). For instance, some transcribed processed pseudogenes express antisense transcripts which pair to the mRNA of their parent genes, generating a natural endogenous small interfering RNA and, consequently, reducing the expression of the parent gene (Tam et al. 2008; Watanabe et al. 2008; Wen et al. 2011). Another suggested mechanism of processed pseudogene function is that their transcripts can affect expression of parent genes by buffering miRNAs (Poliseno et al. 2010). This is debated, however, because housekeeping genes were observed to be prone to generating processed pseudogenes (Gonçalves et al. 2000; Zhang et al. 2003, 2004) yet avoid regulation by miRNAs (Stark et al. 2005). Overall, processed pseudogenes can play an important role in gene regulation (Sasidharan and Gerstein 2008; Salmena et al. 2011). In fact, the ENCODE Project revealed that at least 8% of pseudogenes are transcribed (The ENCODE Project Consortium 2012; Pei et al. 2012). Below, we will use the term retroduplication to refer to gene copies created by retrotransposition. We do not, however, make a judgment as to whether a particular copy is a retrogene with protein coding function or a processed pseudogene (i.e., a nonfunctional, exon-only copy of the ancestral gene).
The reference human genome (build GRCh37) contains 7806 retroduplications annotated by GENCODE (Harrow et al. 2012). As described earlier, recent studies have shown various functional roles for these retroduplications and, as such, analysis of retroduplication variation (RDV; presence/absence of retroduplications in individual genomes) within human populations is important for understanding human evolution and phenotypic variation. However, only a handful of studies of RDVs in humans and Drosophila have been conducted (Conrad et al. 2009; Karakoc et al. 2011; Schrider et al. 2011, 2013; Ewing et al. 2013).
In this study, we have performed the most comprehensive analysis to date of RDVs between almost a thousand unrelated human individuals from multiple populations using whole genome sequencing data from the The 1000 Genomes Project Consortium (The 1000 Genomes Project Consortium 2012). We developed methods for discovering novel retroduplications not present in the reference genome, which allowed us to perform an extensive analysis of RDVs, both present and absent from the reference genome. The breadth of this analysis allowed us to hypothesize on the coupling of retrotransposition to cell division.
Results
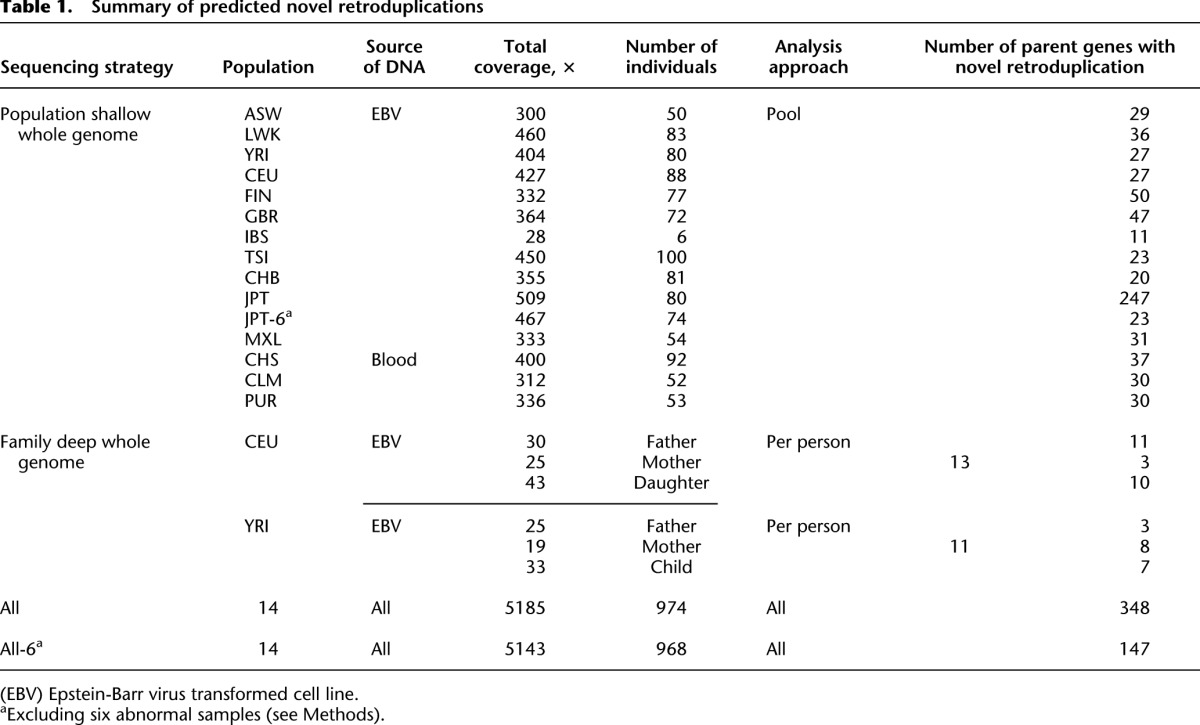
To analyze RDVs within human populations, we used Illumina sequencing data, generated by The 1000 Genomes Project Consortium. The data consisted (Table 1; Supplemental Table S1) of deep (19–43×) whole genome (WG) sequencing of two family trios (father, mother, and child), and shallow (4–7×) WG sequencing of 968 individuals from 14 diverse populations (Supplemental Table S1). While the overall data set was extremely diverse in its quality (e.g., read length varies from 30 to 150 bp), the data for individuals within each population tend to be similar (i.e., most individuals in each population are sequenced with the same or similar technology). Using these data, we identified retroduplication variants that are present in the reference human genome but are absent in some of the analyzed genomes, as well as variants that are absent from the reference genome but present in some of the analyzed individuals. We termed the nonreference retroduplication variants as novel retroduplications. They are insertions relative to the reference genome (also see glossary in Supplemental Material).
Table 1.
Summary of predicted novel retroduplications
Discovering novel retroduplications
The main idea behind our computational approach to discover novel retroduplications is to utilize the sequence of exon-exon junctions as a signature for a retroduplication (Fig. 1). We used sequencing reads that do not map to the reference genome but map to an exon-exon junction as markers of a retroduplication of a gene. We further developed a null model to optimize selection parameters for post-alignment processing and filtering to confidently predict novel retroduplications (see Methods; Supplemental Fig. S2). For the deeply sequenced trios, we analyzed data from each individual (i.e., discovered retroduplications for each person), while for genomes sequenced at shallow coverage, we pooled data from individuals within the same population (i.e., discovered retroduplications present in a population, rather than in an individual). To account for data heterogeneity, we optimized calling parameters using the null model for each population and each individual in the trios (Supplemental Table S2). In total, after excluding six Japanese (JPT) samples that show abnormal results (see Methods), we discovered novel retroduplications of 147 parent genes (Table 1; Supplemental Table S3). By examining read-depth evidence and detected insertion points of novel retroduplications, we found two genes, CDC27 (Supplemental Fig. S3) and TMEM126B (Supplemental Table S3), for which we could conclude that they have more than one novel retroduplication. Thus, a single novel retroduplication is observed for most parent genes.
Figure 1.

Approach for novel retroduplication discovery. (A) If an analyzed genome has an unknown (i.e., absent from reference genome) retroduplication, then sequencing reads originating from the retroduplication can be used for it to be discovered. (B) Reads aligned to the reference genome provide three lines of evidence for the novel retroduplication: reads clustering around the insertion point, increased read depth in exons, and mapping of unaligned reads to a splice-junction library. (C) The existence of a novel retroduplication for the SKA3 gene in the CEU trio is supported by the three lines of evidence. The retroduplication is polymorphic as it is not present in the mother's genome. (D) PCR validation strategy. Two sets of primers test for the presence of a splice junction and for the insertion point, respectively. (E) Existence of novel retroduplication for SKA3 is validated in the daughter's and father's genomes but not in the mother's. (F) The novel retroduplication for SKA3 is polymorphic in the CEU population, as PCR across the insertion point yields a product in only some of the individuals tested.
We collected three additional lines of evidence to further validate the presence of novel retroduplications (Table 2; Supplemental Table S4). In trios (Table 2), we predicted novel retroduplications for 17 genes of which (1) 11 (65%) had increased depth of mapped reads in exons as compared to introns (Fig. 1; Supplemental Figs. S3–S22), (2) eight (47%) had insertion points identified by mapping of paired reads (Fig. 1; Methods), and (3) five (29%) were found within contigs of the HuRef assembly of the human genome (Levy et al. 2007). In total, of the 17 novel retroduplications in the trio samples, 12 of them had at least one of the three additional lines of evidence. Finally, we performed experimental validation in the CEU trio by amplifying the predicted retroduplications by polymerase chain reaction (PCR) across exon-exon junctions and, when available, across predicted insertion junctions. We further confirmed the retroduplications by Sanger sequencing the PCR product for those in which the reference genome already contained a retroduplication for that parent gene. For two, suitable primers could not be designed due to the repetitive nature of these regions. Nine out of the remaining 11 predicted retroduplications were validated. Two of the regions showed unclear/nonspecific amplification. Therefore, we estimate a conservative FDR of 18% for the novel retroduplications we identified. Note that the confidence of our predictions depends on the amount of read support. Thus, validation rates are likely to vary depending on the sequencing coverage and allelic frequency of the novel retroduplications.
Table 2.
Prediction of retroduplications in CEU and YRI trios
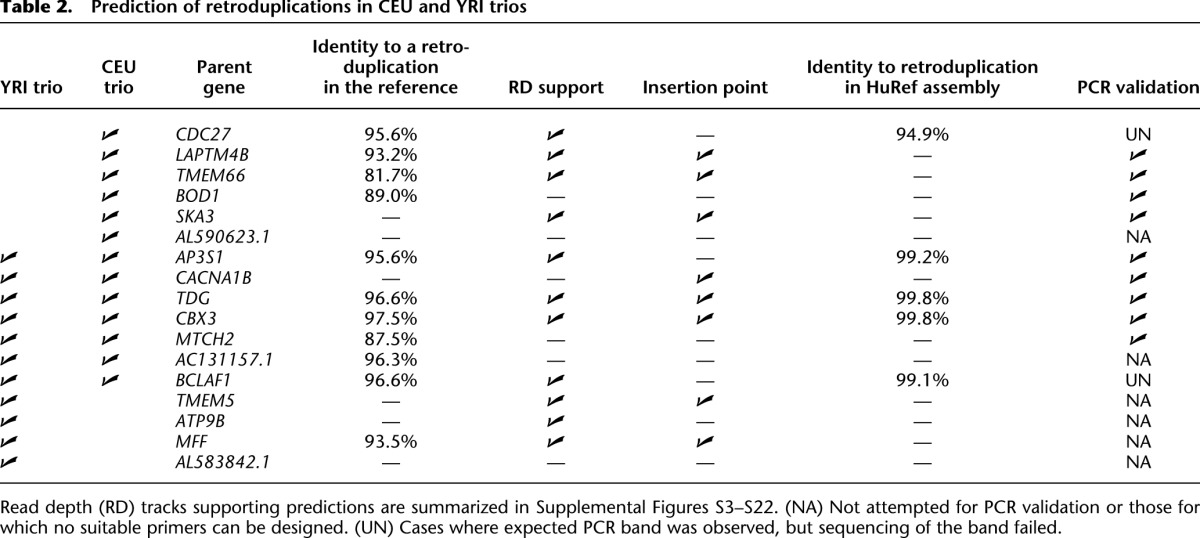
We were able to find seven predicted novel retroduplications in alternative assemblies of the reference genome. All of them had poly-A tails and target site duplications—the signature of L1 retrotransposition (see Supplemental Material). Remarkably, our approach was sensitive enough to find novel retroduplications of genes that already have highly similar (97.5% sequence identity to the parent gene) retroduplications in the reference genome, including that of the CDC27 (Supplemental Fig. S3), BCLAF1 (Supplemental Fig. S4), and RBMX genes (Supplemental Fig. S20).
Overall, novel retroduplications tend to be rare or population-specific, as 66% of them are genotyped in, at most, three populations (Fig. 2). This suggests that retrotransposition and retroduplication is an ongoing process in human evolution, and RDVs account for a previously unappreciated portion of genetic variation between and within populations. Novel retroduplications for 21 parent genes are shared between at least 12 populations, suggesting that these retroduplications are very common in the human population but absent from the reference genome (Supplemental Table S3). This can be due to the reference representing minor alleles, or these retroduplications may be fixed in the human population but reside in the undetermined “gaps” in the reference human genome (e.g., in telomeres and centromeres).
Figure 2.

Frequency of novel retroduplications by populations. Most of the novel retroduplications are discovered in only one population (due to conservative calling) but are present in a few more as evident from genotyping. The phylogenetic tree was constructed based on the overlap of novel retroduplications between different populations. The tree shows that, except in one case, populations separate perfectly by continental groups. Outlier clustering of the Finnish population (FIN) is likely due to its distinct data properties allowing discovery of more unique retroduplications (see text). Admixed populations and the Iberian population (with just a few sequenced individuals) were excluded from phylogenetic analysis.
After genotyping, we typically observed 35–47 parent genes with novel retroduplications per population. One exception with 13 parent genes is the Iberian (IBS) population, for which we only had six sequenced individuals. Overall, we did not see an apparent bias in discovering parent genes when using DNA extracted from cell lines or blood (Table 1). The presence/absence of novel retroduplications within populations, similar to other types of genetic variations, can be used for phylogenetic tree construction (see Methods). We showed that all but Finnish (FIN) populations clearly segregate into clusters, corresponding to geographic continents (Fig. 2). FIN is an outlier because we were able to discover 60% more novel retroduplications compared to the average number of novel retroduplications discovered in other populations due to the availability of longer sequencing reads (up to 150 bp). In fact, we observed the largest number of population-specific retroduplication variants in this population (Supplemental Fig. S23).
For 36 (24%) of the total 147 parent genes, we could find an insertion point for the novel retroduplication (Supplemental Table S3). We could not detect insertion sites for all novel retroduplications for several reasons. First, we used very stringent criteria for predicting insertion sites (e.g., required support for an insertion by reads from both sides), which reduced our sensitivity (see Methods). Second, many novel retroduplications are discovered for parent genes that already have other retroduplications in the reference genome, thus compromising reliable mapping of reads to parent genes. Third, the sequencing coverage at the insertion points for rare retroduplications may not be sufficient for discovery. Indeed, we detected more insertion points for novel retroduplications present in multiple populations and for retroduplications discovered in the deeply sequenced trio samples (47% of the 17 novel retroduplications in Table 2). Finally, as mentioned above, novel common retroduplications could be in undetermined genomic regions such as sequencing gaps, centromeres, or telomeres.
Enrichment of parent genes in functional categories
When analyzing novel retroduplications discovered in the trios, we noticed that 13 out of 17 parent genes have retroduplications already present in the reference genome (Table 2). Based on validation and additional lines of evidence (see above), we believe that additional retroduplications, and not just those already in the reference genome, exist. Thus, it appears that novel retroduplications are enriched for genes which already have retroduplications. We tested for the same trend on a larger scale using all discovered novel retroduplications and all annotated GENCODE retroduplications in the reference genome (see Methods; Supplemental Table S5). We observe a strong (greater than threefold) and very significant (P-value < 10−27 by proportion test) enrichment of novel retroduplications for genes with known retroduplications (Supplemental Table S6).
Based on this result, we hypothesized that retrotransposition leading to retroduplication may be coupled to a particular biological process. Analysis of gene functional categories with DAVID (Huang et al. 2009) revealed significant enrichment (corrected P-value < 10−6) of retroduplication for genes associated with the intracellular lumen. We further hypothesized that retrotransposition and retroduplication are related to open mitosis (where the nuclear envelope breaks down before the chromosomes separate) during which the lumen is perturbed and related genes are highly expressed to rebuild it. At the same time, perhaps, similar to most retroviruses (Nisole and Saïb 2004; Goff 2007), disruption of the nuclear membrane gives the highest possibility for reverse transcriptase to access nuclear DNA in order to create retroduplications. We suggest that timing of gene expression during the cell cycle (i.e., during open mitosis) is conducive to the insertion of retroduplications into the genome. When using the list of all parent genes with retroduplications in the reference genome, we observed even more significant (corrected P-value < 10−41) enrichment for intracellular lumen genes along with significant enrichment for cell division related categories, including macromolecular complexes and mitotic cell cycle (Supplemental Table S7).
Constructing a set of RDVs
For further analysis, we constructed a set of 174 RDVs. The set consisted of 147 genes with novel retroduplications (i.e., insertion relative to the reference genome) and 27 genes with variable retroduplications absent in analyzed samples but present in the reference genome (i.e., deletion relative to the reference genome) (Supplemental Fig. S24; Supplemental Table S3). The latter were defined as those having 50% reciprocal overlap with deletions discovered in Phase 1 of the The 1000 Genomes Project Consortium (The 1000 Genomes Project Consortium 2012). Deletions were discovered by methods utilizing different approaches in order to be comprehensive (see Methods).
Correlation of expression data with cell cycle
To obtain further evidence to support our hypothesis, expression levels of parent genes during different phases of the cell cycle were analyzed. We utilized a data set of genes periodically expressed during the HeLa cell cycle (Whitfield et al. 2002). The data set, consisting of 565 genes with determined phases of maximum expression, was downloaded from Cyclebase (Gauthier et al. 2010). Six of the 565 genes are found in our set of RDVs (Supplemental Table S8). They are significantly enriched (twofold, P-value = 0.012 by proportion test) for genes with maximum expression in M and M/G1 phases (Fig. 3A; Supplemental Fig. S25), where M/G1 represents genes with an uncertain phase assignment close to the M to G1 transition, due to measurement imprecision. Similarly, significant (P-value = 0.008 by proportion test) enrichment in expression during M and M/G1 phases is observed for 12 periodic genes with recent retroduplications (>97% identity to parent) in the reference (Supplemental Table S8). Here, considering only recent retroduplications restricts the analysis to a short evolutionary time scale.
Figure 3.

Enrichment of parent genes for expression at different phases of the cell cycle. A list of periodic genes was produced previously (Whitfield et al. 2002) and downloaded from Cyclebase (Gauthier et al. 2010). (A) Genes with RDVs and recent retroduplication in the reference genome are significantly enriched (with P-values = 0.012 and 0.008, respectively, and denoted by [*]), for expression in the M and M/G1 cell cycle phases. M/G1 represents genes with uncertain phase assignment close to the M-to-G1 transition due to measurement imprecision. During M/G1, cell division occurs (red horizontal bar). Due to the saturation effect (see text), the enrichment for parent genes being expressed during M or M/G1 is not obvious when analyzing all known retroduplications. (B) Average number of retroduplications in the reference genome per gene (y-axis) is depicted for periodic genes with maximum expression at particular cell cycle phases (x-axis). Genes expressed in M and M/G1 phases generate significantly more (P-value = 0.0047) retroduplications than genes expressed during other phases, suggesting that cell cycle timing directly relates to retroduplication frequency.
When considering all periodic genes with retroduplications in the reference (i.e., over a long evolutionary time scale), we observed the same trend, though it was not statistically significant. This, however, can be explained by the saturation effect, namely, a higher chance of retroduplication for genes being expressed at the M-to-G1 transition leads to recurrent retroduplications. Such recurrence leads to the formation of new retroduplications, but the number of parent genes does not change because those genes already had retroduplications. Genes with expression in other cell cycle phases have a low chance for recurrent retroduplications, and so each retrotransposition of their mRNA likely increases the number of parent genes as, previously, these genes had no retroduplications. Over a long evolutionary time, the fractions of parent genes at each phase become statistically indistinguishable. This reasoning, however, implies that the number of retroduplications per gene should be higher for genes expressed at M and M/G1 phases. Indeed, there exists a clear tendency of more retroduplications per gene as genes are expressed closer to cell division with the maximum reached for M/G1 phase (Fig. 3B). In fact, genes with maximum expression at M and M/G1 phases generate, on average, 2.2 times more retroduplications and are different in the distribution of the number of retroduplications per gene (P-value = 0.0047 by t-test) than genes with maximum expression at other phases of the cell cycle.
To summarize, analyses for RDVs for both recent retroduplications in the reference and for all retroduplications in the reference point in the direction that genes expressed in M and M/G1 phases generate retroduplications more frequently than genes expressed in the other cell cycle phases. Finally, we conducted a proof of concept analysis and showed that using the gene expression value and taking into account the cell cycle phase of maximum expression leads to a better prediction of the number of retroduplications of the gene than using the gene expression alone (see Supplemental Material). We also observed consistent results (see Supplemental Material) when utilizing a different set of cycling genes derived from analysis of expression in primary foreskin fibroblasts (Bar-Joseph et al. 2008).
Discussion
Retrotransposition is one of the major mechanisms driving diversity in animals. While any retrotransposition event can have functional consequences, retrotransposition of messenger RNA resulting in the formation of retroduplications is particularly interesting. If expressed, retroduplications can regulate expression of the parent gene through RNA interference and/or miRNA sponging, increase the expression of the parent gene, or even evolve a new function. Also, while underappreciated, sequence variation in retroduplications can be misinterpreted as variation in the original parent gene. For instance, samples with novel retroduplications will have sequencing reads derived from both the parent gene and the retroduplication variant of that gene. However, both sets of reads will be mapped back only to the parent gene, since the retroduplication is missing from the reference genome. If the retroduplication contains sequence changes from the parent gene, spurious SNPs/indels within coding sequences may be called. Thus, realizing that novel retroduplications exist is of primary importance for accurate analysis of exome data. One can envision simple strategies to avoid or minimize such misinterpretations. For example, reads supporting a SNP/indel in a coding region should have mates uniquely mapped in an intron or intron-exon boundary with correct orientation and expected distance to the variant. This would confirm that the reads supporting coding variants are derived from parent genes as opposed to retroduplicated genes located elsewhere in the genome.
Here, we describe a comprehensive catalog of genes with variable retroduplications in human populations. In our analysis, we used data from genome sequencing of almost 1000 individuals from 14 populations. We have identified 174 RDVs, including 147 genes that have novel retroduplications absent from the reference genome. Despite data heterogeneity, the observed RDVs between populations allowed the reconstruction of a correct phylogenetic tree of the human population. Theoretically, RDVs could be even better markers than other forms of genetic variation for reconstructing phylogenies since there is a known ancestral state and low incidence of homoplasy.
Retroduplications are accepted to be generated through mRNA retrotransposition by L1 elements, instead of the L1's own RNA (Esnault et al. 2000). Consistent with this, we observed that novel retroduplications for which we found an exact insertion allele all have poly-A tails and target site duplications—a signature of L1-mediated target primed reverse transcription.
Our analysis allowed us to hypothesize that retrotransposition is coupled to cell division. In particular, RDVs were enriched for functional categories that are related to cell division. Also, periodic genes with RDVs typically have the highest expression when transitioning from the M to G1 phases, i.e., around the time a cell divides. And finally, other parent genes expressed at this time of the cycle produce retroduplications more frequently, in general, than genes expressed during other phases of the cycle. The coupling of retrotransposition to cell division can be explained by easier access for retrotransposon proteins carrying mRNA into the nucleus due to disruption of the nuclear membrane and/or endoplasmic reticulum as part of division. Previously, Shi and colleagues (Shi et al. 2007) suggested cell division as a necessity for retrotransposition by L1 elements. Also, Kubo et al. (2006) observed dramatically reduced rates of retrotransposition in nondividing cells which implicates cell division as a rate-limiting step for retrotransposition. Similar results were observed in the recent study by Xie et al. (2013). Thus, our observation is in line with these studies.
It has been known for a while that retroduplications are found for only a small fraction—2762 (∼14%)—of all protein coding genes in the human genome. It was suggested that expression level is one of the determinants of whether a gene can be retroduplicated (Zhang et al. 2003), and more highly expressed genes are more often retroduplicated. In this study, we provide evidence that timing of expression is also crucially important, i.e., genes that are expressed long before or long after cell division have less chance of being retroduplicated (Supplemental Fig. S26). In fact, expression timing could be the more explicit determinant for retroduplication, as the higher the gene expression, the higher the chance that it is also expressed at M-to-G1 transition or that the gene's mRNA remains in the cell during this time. In addition, it was previously postulated that compositional content of genes also affects the rate at which they are retroduplicated (Zhang et al. 2002). Thus, we may expect that not all genes with properly timed expression can be retroduplicated.
Another consequence of coupling retrotransposition and cell division is that faster dividing tissues can be prone to accumulating somatic retrotranspositions and retroduplications. This, however, is contingent on the activity of retrotransposons in those tissues, yet should not be neglected when dealing with studies involving cancer tissues or other somatic-driven diseases.
Methods
Predicting novel retroduplications
Conceptually, methods to predict novel retroduplications are outlined in Figure 1 and Supplemental Figure S27. Due to technical reasons, variation in retroduplications is significantly less studied than single-nucleotide or copy number variants. First, SNP arrays investigate sites with known SNPs, which are strongly depleted in exons. Second, the cost of capillary sequencing is prohibitively expensive for population scale analysis of RDV. Third, CGH arrays (array comparative genomic hybridization; aCGH) need to be custom-made to specifically target exons and introns (and away from exon-intron junctions) to be able to see retroduplications. Also, multiple retroduplications of the same parent gene dilute the aCGH signal and mask the presence of novel retroduplications (i.e., a gene with a single RDV in an individual will have an ∼50% increase in the aCGH signal of its exons, but if it has a common retroduplication and an additional second one in the specific array sample, there will only be an ∼25%–33% increase in signal observed by aCGH). This fact is particularly important as we showed in this study that new retroduplications are preferentially created from genes that already have retroduplication(s). However, with the advent of next-generation sequencing, the cost of sequencing has dropped precipitously, and now it is feasible to study RDV in detail for large sample populations. Many methods have been developed to discover CNVs using sequencing data (Chen et al. 2009; Korbel et al. 2009; Lee et al. 2009; Sindi et al. 2009; Wang et al. 2009; Ye et al. 2009; Hajirasouliha et al. 2010; Hormozdiari et al. 2010; Abyzov and Gerstein 2011; Abyzov et al. 2011; Handsaker et al. 2011; Zhang et al. 2011), but only a few attempted to analyze RDVs (Conrad et al. 2009; Karakoc et al. 2011; Schrider et al. 2011, 2013; Ewing et al. 2013).
Overall, our discovery methodology is designed to predict novel retroduplications from reads mapping to exons of parent genes. Thus, it is likely that predicted novel retroduplications are the result of the parent gene's mRNA retrotransposition rather than duplication of a known retroduplication in the reference genome (if such a one exists). In the latter scenario, reads are likely to map to the known retroduplication in the reference genome rather than to the parent gene. In fact, for all but one (the CDC27 gene) retroduplications found in alternative assemblies, we could establish (based on sequence similarity of flanking regions) that the predicted retroduplication was generated by retrotransposition and not by duplication of an existing retroduplication. CDC27 has multiple novel retroduplications (Supplemental Fig. S3), and some of them could be generated by retrotransposition.
Constructing a splice-junction library
Using human genome reference hg19 and GENCODE annotation v6, we constructed a splice-junction sequence library by joining 100 bases preceding the 5′ end of each intron and 100 bases succeeding the 3′ ends of the same and all downstream introns. For stringency, we excluded introns shorter than 70 bp in length, as they may represent misannotation (Supplemental Fig. S28). The library consisted of 2,191,960 sequences, each 200 bp in length.
Aligning reads
For our analysis, we used only reads that could not be mapped to the reference genome by The 1000 Genomes Project Consortium (The 1000 Genomes Project Consortium 2012; ftp://ftp-trace.ncbi.nih.gov/1000genomes/ftp/phase1/data). The reference consisted of the chromosome sequences, unplaced contigs, and mitochondrial sequence but did not include alternative contigs (e.g., for the MHC locus). The reads were trimmed at the low quality end (i.e., 3′ end) up to quality 15 the same way as BWA does (Li and Durbin 2010) and then aligned using Bowtie 0.12.7 (Li and Durbin 2010) to the splice-junction library with options “–best–strata -v 3 -m 1”. This option forces the program to align reads with up to three mismatches and report only one best hit in best strata, i.e., report only uniquely mapped reads. Reads mapped to the splice-junction sequence were also aligned to the reference genome by Bowtie with the same options.
Selecting supportive reads for a splice junction
A read aligned to a splice junction was considered to be supportive if (1) it could not align to the reference genome with the same or lesser number of mismatches, (2) the number of mismatched bases is no more than 3% of all bases in the reads after trimming, and (3) it spans a minimum number of bases on either side of the junction. The exact cutoffs on the number of bases across splice junctions were selected from analysis of a null placement model for each data set from each population and likewise for the high-coverage individuals.
Null placement model
We developed a null placement model to assess possible random mapping of reads to splice-junction libraries. In our null placement model, we shifted coordinates of annotated introns and exons by 10,000 bp upstream (null #1) and downstream (null #2) (Supplemental Fig. S2), i.e., gene structure was preserved. Null junction-libraries were constructed from the shifted annotation. We then replicated our computational analysis (i.e., mapping, selection of supportive reads, and retroduplication calling) with each null junction-library.
Note that such a null placement model imitates combinatorial complexity of splice-junction sequences, when considering all theoretically possible alternative splicing isoforms. Also, in the real junction library, some sequences are similar to sequences of retroduplications and/or junctions from paralogous genes. In a null junction library, on the other hand, no junction sequences are similar to retroduplications, as the latter are not shifted. Moreover, shifting annotation of paralogous genes by such distance could result in their different junction sequences, when shifted annotation is out of duplicated regions of the paralogous genes. Because of this, the null junction library will have fewer redundant sequences compared to the real junction library. Hence, it is likely that more random reads will map uniquely to null junction libraries rather than to the real junction library. Thus, the applied null model is conservative and optimization of calling parameters against it leads to additional stringency.
Calling novel retroduplications
A priori, it is not obvious what is more important when making a confident call for a novel retroduplication: more junctions with fewer read support or more read support with fewer junctions. Thus, we vary the value of the cut-off Δ on the number of bases a read alignment extends to the left and right from a junction and consider three scenarios to call a novel retroduplication: (1) At least two nonoverlapping splice junctions are supported by mapped reads and at least 1 splice junction has two supportive reads; (2) at least three nonoverlapping splice junctions are supported by mapped reads and at least one splice junction has two supportive reads; and (3) at least two nonoverlapping splice junctions are supported by mapped reads and at least two splice junctions have two supportive reads. For each scenario, we require evidence from mapped reads for at least two splice junctions to avoid calling novel retroduplication for a gene with one misannotated intron due to an indel. For each scenario, we first chose the value of the cut-off Δ such that the number of retroduplication calls with each null splice-junction library is <5% of the number of retroduplication calls with the real splice-junction library. We then chose a scenario that yields the maximum number of retroduplication calls with real splice junctions (Supplemental Table S2). Note that we are unlikely to confuse duplications of known (i.e., existing in the reference) retroduplications with novel retroduplication. In the former case, as explained above, reads are much more likely to map to the known retroduplication rather than to a splice junction of a gene.
Excluding six Japanese samples from analysis
Surprisingly, we discovered 247 parent genes in the Japanese (JPT) population. We further found that most of them were discovered in just six (NA19010, NA19088, NA18977, NA18963, NA19084, and NA19087) individuals (Supplemental Fig. S29). This may reflect cell line artifacts, mRNA contamination, or problems with data quality (e.g., misestimation of base quality scores). When excluding data from those listed individuals, the number of discovered parent genes in the Japanese population was comparable to other populations. Also, the total number of predicted parent genes with novel retroduplications decreased by 201 (Supplemental Table S3). Of these 201 retroduplications from the six outlier samples, 72% could not be genotyped in any other population, and for none we found an insertion point. We concluded, therefore, that either the cell lines or the data from these individuals are likely compromised, and we omitted these samples from our analysis.
Obtaining additional evidence from depth of coverage
For individuals with high coverage, we calculated the depth of coverage track with CNVnator (Abyzov et al. 2011). CNVnator calculated GC corrected genome-wide read depth (RD) of coverage for user-defined bins. For our analysis, we used 100-bp bins. The resulting tracks were also depicted with CNVnator and visually correlated (Supplemental Figs. S3–S22) with graphical representation of gene models generated by the UCSC Genome Browser (http://genome.ucsc.edu).
Detecting insertion points for novel retroduplications
We clustered pairs of reads where one read maps (with quality of at least 15) within the parent gene and the other read maps on different chromosomes or at least 1000 bp away from the gene (Fig. 1B). Only pairs of reads in proper read orientation and placement (Supplemental Fig. S30) were clustered, using average linkage clustering, with the score being the distance in base pairs between the other (i.e., mapped away from parent gene) reads. It is possible to estimate (see Supplemental Material) that reads supporting an insertion point, i.e., those scattered around it, will have an expected average distance between them of
where n is the number of reads and L is the average insert distance between pairs of reads in the sequencing library. This estimate is based on the assumption that reads are equidistantly distributed in the range L downstream from and upstream of the insertion point. As libraries in our data sets typically had inserts of 250–450 bp, we stopped clustering when the score between any two existing clusters exceeds 500 bp. We consider a cluster valid if, among the reads aligned to the parent gene, there are at least two on positive and at least two on negative strands.
Genotyping retroduplications
We term an informative splice junction as those junctions that had read support while discovering novel retroduplications. In this case, a supportive read should have satisfied the value of the Δ cutoff outlined in Supplemental Table S2. We then genotype a novel retroduplication in a population by finding supportive reads for its informative splice junctions. We considered two scenarios for genotyping: relaxed, Δ = 5%, and conservative, Δ = 15%, where the percentage is counted with respect to read length. The majority of parent genes with novel retroduplications were discovered in only one population. This is likely due to our conservative discovery pipeline rather than due to false positives. In support of this, genotyping (i.e., determining presence of a particular novel retroduplication regardless of the population in which it was discovered) (see Methods) across all populations showed that 61% of the novel retroduplications are present in at least two populations (Fig. 2).
Extracting retroduplication sequences from reference and HuRef genome assemblies
Retroduplication sequences from hg19 and HuRef assemblies were extracted (1) to determine the highest sequence identity of a known retroduplication to the parent gene, and (2) to confirm our predictions of novel retroduplications by searching for the retroduplication in the HuRef genome. For a parent gene predicted to have a novel retroduplication (only those in Table 2 and Supplemental Table S4), we constructed a composite transcript (consisting of all bases in all annotated exons) with the aid of RSEQtools (Habegger et al. 2011). The sequence of the composite transcript was aligned against the reference genome with BLAT (http://genome.ucsc.edu/cgi-bin/hgBlat). We used the highest scoring and continuous (no large gaps indicative of introns) alignment to define a retroduplication in the reference with the highest identity to the parent. The same sequence was also aligned against all assembled human contigs using Megablast (http://blast.ncbi.nlm.nih.gov/Blast.cgi). The first 10 highest scoring alignments were manually curated to identify retroduplications not present in the reference genome.
Constructing a population phylogenetic tree
The tree was constructed using Jaccard distance, which is a proper metric (Lipkus 1999). Specifically, the phylogenetic distance between two populations was calculated using the equation  , where
  is the number of common parent genes with novel retroduplications and
  is the total number of parent genes for novel retroduplications in either population. Once two populations are clustered, they are considered as one population. For tree constructions, we used information from conservative genotyping.
While we observed diversity (number of discovered parent genes) in retroduplications between populations, we attributed it to differences in sensitivity of our discovery due to different input data. For Yoruba (YRI), Utah residents with Northern and Western European ancestry (CEU), Tuscan (TSI), Japanese (JPT), and Han Chinese (CHB) populations, we discovered fewer parent genes giving rise to retroduplications. These same populations were largely sequenced by earlier technologies with shorter reads (30–50 bp). On the contrary, for British (GBR) and Finnish (FIN) populations, sequenced by the recent technology with longer (≥100 bp) reads, we find the largest number of parent genes. We observed a similar trend when genotyping (i.e., determining presence or absence of retroduplications in populations) retroduplications in different populations (Supplemental Fig. S23). We concluded, therefore, that it is premature to say that the number of discovered parent genes per population reflects diversity of retroduplications between the populations. However, retroduplications that are shared between populations are likely to have higher allele frequencies than population-specific ones. Thus, the former are easier to discover because they are likely to produce a stronger signal and, consequently, their discovery is likely to be less affected by uneven population sampling, sequencing coverage, and data characteristics (e.g., read length). In turn, a phylogenetic tree based on retroduplications found in multiple populations will be less affected. Indeed, we could reconstruct a proper phylogenetic tree of human populations (Fig. 2). The topology of the tree remains unchanged irrespective of whether all novel or just rare retroduplications are used.
Comparison with other methods discovering novel retroduplications
Four parent genes (ZNF664, TYRO3, TDG, and PRKRA) in our set were predicted to have a novel retroduplication from analysis of aCGH data (Conrad et al. 2009). We also compared (Supplemental Fig. S31) our set of predicted parent genes with novel retroduplications to two other sets recently published (Ewing et al. 2013; Schrider et al. 2013). These two sets were also derived from The 1000 Genomes Project Consortium data. Thirty-seven of the predicted parent genes from our set were also found by these two studies. The larger number of parent genes found in our study is likely due to our larger sample size when compared to the study by Schrider et al. (2013), and our less conservative approach (i.e., Ewing et al. reported only parent genes for which the insertion points of novel retroduplications could be found). Additional findings in those two studies are likely due to differences in methodology used by Ewing et al. (2013) and perhaps, more sensitive discovery by Schrider et al. (2013).
Discovering RDVs as deletions relative to the reference genome
Retroduplications that are variable in the population but are in the reference genome can be identified in an individual as a deletion relative to the reference (Supplemental Fig. S24). We used the set of retroduplications annotated by the ENCODE Project (Harrow et al. 2012; Pei et al. 2012) and overlapped them with the deletions discovered by The 1000 Genomes Project Consortium. Deletions were discovered by methods utilizing three different approaches for discovery: read depth (RD); read pair (RP); and split read (SR) (Mills et al. 2011). The RD approach predicts deletions by finding regions with depleted (compared to average) coverage by mapped reads. The RP approach detects deletions by finding mated pairs of mapped reads with a significantly larger distance than expected from the library preparation. SR finds deletions by finding split alignments for reads that cannot be aligned continuously to the reference genome. The combination of different approaches yields a more comprehensive discovery of deletions. Most of the methods used for deletion discovery have been previously described (Chen et al. 2009; Korbel et al. 2009; Wang et al. 2009; Ye et al. 2009; Abyzov and Gerstein 2011; Abyzov et al. 2011; Handsaker et al. 2011; Mills et al. 2011; Zhang et al. 2011).
PCR validation
Overall results
For trio samples, we performed three different kinds of validation experiments. First, we validated the presence of novel retroduplications by PCR with primers spanning exon-exon junctions. By looking for bands of the size predicted when the gene is lacking introns, we could confirm the presence of the retroduplication. This strategy is effective for novel retroduplications which do not have a known retroduplication with >90% identity to the parent gene in the reference genome. Second, for those RDVs which already had a high identity (>90%) retroduplication in the reference genome, we amplified across exon-exon junctions, cloned, and sequenced the product. We then aligned the resulting sequences back to the human reference genome (hg19) to demonstrate that (1) the amplified RDV is unlike any known retroduplication in the reference genome, and (2) the amplified RDV has high identity to its parent gene's mRNA. Finally, for four novel retroduplications with insertion site predictions, we confirmed their presence with a primer near the 3′ end of the retroduplication and a second primer downstream in the flanking genomic DNA, thereby amplifying the insertion junction.
Designing primers for PCR validation
Primers were designed to confirm the presence of particular splice junctions in the tested genome as well as to confirm the insertion point of the retroduplications (Fig. 1D). Except in the cases where we identified the sequence in an alternative assembly, retroduplications were assumed to be identical to the annotated exons of parent genes. Therefore, PCR may not work in cases when a novel retrogene has diverged from the parent gene. The optimal sequence of primers was chosen by the Primer3 server (http://frodo.wi.mit.edu), and in a number of cases we manually shifted primers downstream/upstream to allow for a more selective amplification of novel retroduplications as compared to those found in the reference genome. Resulting primer pairs were tested by the Primer3 server as well as NetPrimer software (Premier Biosoft) for being acceptable to run the PCR reaction, and by PrimerBlast server (http://www.ncbi.nlm.nih.gov/tools/primer-blast) to yield no amplicons from the reference genome. Thus, designed primers are unlikely to amplify retroduplications from the reference. In this manner, we designed primers for 11 predicted novel retroduplications. The remaining two in the CEU trio (for genes AC131157.1 and AL590623.1) overlap simple repeats which prevented us from designing specific primers. All primers are listed in Supplemental Table S9.
Running PCR validation
Primer sequences are available in Supplemental Table S9. All PCR reactions were performed using Invitrogen Platinum Taq polymerase in a 25-μL reaction volume with 10 ng of template DNA. An annealing temperature of 60°C was used, and the reactions had 35 cycles. We purified the PCR product using the MinElute PCR Purification Kit (Qiagen) and eluted in 10 μL of water. Three microliters of purified PCR product was used to clone into the Invitrogen TOPO TA pCR4-TOPO vector following recommended protocols, with the exception of using 0.5 μL of vector instead of 1.0 μL. Plasmids were then transformed into Escherichia coli DHFα and plated on LB Amp plates with Xgal. Individual colonies were used to inoculate 3 mL of LB Amp liquid medium, which then underwent DNA extraction and standard Sanger sequencing using the M13F and M13R primers.
Extracting retroduplication annotation from GENCODE
We utilized the processed pseudogene annotation with level indices 1 or 2 for the human reference genome (GRCh37) from GENCODE v7 GTF file (Derrien et al. 2012; Harrow et al. 2012). The index means the confidence in annotation (level 1 is the most confident). Pseudogenes' parent genes were determined as those having high sequence similarities (>90%) to pseudogenes or as assigned by pseudopipe (Pei et al. 2012). About 15% of pseudogenes' parent genes were ambiguous, and such pseudogenes were not included in the analysis. To calculate the sequence identities between pseudogenes and their parent genes, exons of each sequence were concatenated and aligned by ClustalW2 (http://www.ebi.ac.uk/Tools/msa/clustalw2/) with default parameters.
Acknowledgments
We acknowledge support from the NIH (including training grant F32AG039979) and from the A.L. Williams Professorship funds. We also acknowledge the Yale University Biomedical High Performance Computing Center, its support team (in particular, Robert Bjornson and Nicholas Carriero), and NIH grant RR19895, which funded the instrumentation. We thank Joel Rozowsky, Amy Langdon, and Declan Clarke for useful discussions during the course of the study and help in preparing the manuscript.
Footnotes
[Supplemental material is available for this article.]
Article published online before print. Article, supplemental material, and publication date are at http://www.genome.org/cgi/doi/10.1101/gr.154625.113.
Freely available online through the Genome Research Open Access option.
References
- The 1000 Genomes Project Consortium 2012. An integrated map of genetic variation from 1,092 human genomes. Nature 491: 56–65 [DOI] [PMC free article] [PubMed] [Google Scholar]
- Abyzov A, Gerstein M 2011. AGE: Defining breakpoints of genomic structural variants at single-nucleotide resolution, through optimal alignments with gap excision. Bioinformatics 27: 595–603 [DOI] [PMC free article] [PubMed] [Google Scholar]
- Abyzov A, Urban AE, Snyder M, Gerstein M 2011. CNVnator: An approach to discover, genotype, and characterize typical and atypical CNVs from family and population genome sequencing. Genome Res 21: 974–984 [DOI] [PMC free article] [PubMed] [Google Scholar]
- Baertsch R, Diekhans M, Kent WJ, Haussler D, Brosius J 2008. Retrocopy contributions to the evolution of the human genome. BMC Genomics 9: 466. [DOI] [PMC free article] [PubMed] [Google Scholar]
- Bai Y, Casola C, Feschotte C, Betrán E 2007. Comparative genomics reveals a constant rate of origination and convergent acquisition of functional retrogenes in Drosophila. Genome Biol 8: R11. [DOI] [PMC free article] [PubMed] [Google Scholar]
- Bar-Joseph Z, Siegfried Z, Brandeis M, Brors B, Lu Y, Eils R, Dynlacht BD, Simon I 2008. Genome-wide transcriptional analysis of the human cell cycle identifies genes differentially regulated in normal and cancer cells. Proc Natl Acad Sci 105: 955–960 [DOI] [PMC free article] [PubMed] [Google Scholar]
- Betrán E, Thornton K, Long M 2002. Retroposed new genes out of the X in Drosophila. Genome Res 12: 1854–1859 [DOI] [PMC free article] [PubMed] [Google Scholar]
- Burki F, Kaessmann H 2004. Birth and adaptive evolution of a hominoid gene that supports high neurotransmitter flux. Nat Genet 36: 1061–1063 [DOI] [PubMed] [Google Scholar]
- Chen K, Wallis JW, McLellan MD, Larson DE, Kalicki JM, Pohl CS, McGrath SD, Wendl MC, Zhang Q, Locke DP, et al. 2009. BreakDancer: An algorithm for high-resolution mapping of genomic structural variation. Nat Methods 6: 677–681 [DOI] [PMC free article] [PubMed] [Google Scholar]
- Conrad D, Pinto D, Redon R, Feuk L, Gokcumen O, Zhang Y, Aerts J, Andrews T, Barnes C, Campbell P, et al. 2009. Origins and functional impact of copy number variation in the human genome. Nature 464: 704–712 [DOI] [PMC free article] [PubMed] [Google Scholar]
- Cordaux R, Batzer MA 2009. The impact of retrotransposons on human genome evolution. Nat Rev Genet 10: 691–703 [DOI] [PMC free article] [PubMed] [Google Scholar]
- de Koning APJ, Gu W, Castoe TA, Batzer MA, Pollock DD 2011. Repetitive elements may comprise over two-thirds of the human genome. PLoS Genet 7: e1002384. [DOI] [PMC free article] [PubMed] [Google Scholar]
- Derrien T, Johnson R, Bussotti G, Tanzer A, Djebali S, Tilgner H, Guernec G, Martin D, Merkel A, Knowles DG, et al. 2012. The GENCODE v7 catalog of human long noncoding RNAs: Analysis of their gene structure, evolution, and expression. Genome Res 22: 1775–1789 [DOI] [PMC free article] [PubMed] [Google Scholar]
- Emerson JJ, Kaessmann H, Betrán E, Long M 2004. Extensive gene traffic on the mammalian X chromosome. Science 303: 537–540 [DOI] [PubMed] [Google Scholar]
- The ENCODE Project Consortium 2012. An integrated encyclopedia of DNA elements in the human genome. Nature 489: 57–74 [DOI] [PMC free article] [PubMed] [Google Scholar]
- Esnault C, Maestre J, Heidmann T 2000. Human LINE retrotransposons generate processed pseudogenes. Nat Genet 24: 363–367 [DOI] [PubMed] [Google Scholar]
- Ewing AD, Kazazian HH 2010. High-throughput sequencing reveals extensive variation in human-specific L1 content in individual human genomes. Genome Res 20: 1262–1270 [DOI] [PMC free article] [PubMed] [Google Scholar]
- Ewing AD, Ballinger TJ, Earl D, Broad Institute Genome Sequencing and Analysis Program and Platform, Harris CC, Ding L, Wilson RK, Haussler D 2013. Retrotransposition of gene transcripts leads to structural variation in mammalian genomes. Genome Biol 14: R22. [DOI] [PMC free article] [PubMed] [Google Scholar]
- Gauthier NP, Jensen LJ, Wernersson R, Brunak S, Jensen TS 2010. Cyclebase.org: Version 2.0, an updated comprehensive, multi-species repository of cell cycle experiments and derived analysis results. Nucleic Acids Res 38: D699–D702 [DOI] [PMC free article] [PubMed] [Google Scholar]
- Goff SP 2007. Host factors exploited by retroviruses. Nat Rev Microbiol 5: 253–263 [DOI] [PubMed] [Google Scholar]
- Gonçalves I, Duret L, Mouchiroud D 2000. Nature and structure of human genes that generate retropseudogenes. Genome Res 10: 672–678 [DOI] [PMC free article] [PubMed] [Google Scholar]
- Habegger L, Sboner A, Gianoulis TA, Rozowsky J, Agarwal A, Snyder M, Gerstein M 2011. RSEQtools: A modular framework to analyze RNA-Seq data using compact, anonymized data summaries. Bioinformatics 27: 281–283 [DOI] [PMC free article] [PubMed] [Google Scholar]
- Hajirasouliha I, Hormozdiari F, Alkan C, Kidd JM, Birol I, Eichler EE, Sahinalp SC 2010. Detection and characterization of novel sequence insertions using paired-end next-generation sequencing. Bioinformatics 26: 1277–1283 [DOI] [PMC free article] [PubMed] [Google Scholar]
- Hancks DC, Kazazian HH 2012. Active human retrotransposons: Variation and disease. Curr Opin Genet Dev 22: 191–203 [DOI] [PMC free article] [PubMed] [Google Scholar]
- Handsaker RE, Korn JM, Nemesh J, McCarroll SA 2011. Discovery and genotyping of genome structural polymorphism by sequencing on a population scale. Nat Genet 43: 269–276 [DOI] [PMC free article] [PubMed] [Google Scholar]
- Harrow J, Frankish A, Gonzalez JM, Tapanari E, Diekhans M, Kokocinski F, Aken BL, Barrell D, Zadissa A, Searle S, et al. 2012. GENCODE: The reference human genome annotation for The ENCODE Project. Genome Res 22: 1760–1774 [DOI] [PMC free article] [PubMed] [Google Scholar]
- Hormozdiari F, Hajirasouliha I, Dao P, Hach F, Yorukoglu D, Alkan C, Eichler EE, Sahinalp SC 2010. Next-generation VariationHunter: Combinatorial algorithms for transposon insertion discovery. Bioinformatics 26: i350–i357 [DOI] [PMC free article] [PubMed] [Google Scholar]
- Hormozdiari F, Alkan C, Ventura M, Hajirasouliha I, Malig M, Hach F, Yorukoglu D, Dao P, Bakhshi M, Sahinalp SC, et al. 2011. Alu repeat discovery and characterization within human genomes. Genome Res 21: 840–849 [DOI] [PMC free article] [PubMed] [Google Scholar]
- Huang DW, Sherman BT, Lempicki RA 2009. Systematic and integrative analysis of large gene lists using DAVID bioinformatics resources. Nat Protoc 4: 44–57 [DOI] [PubMed] [Google Scholar]
- Huang CRL, Schneider AM, Lu Y, Niranjan T, Shen P, Robinson MA, Steranka JP, Valle D, Civin CI, Wang T, et al. 2010. Mobile interspersed repeats are major structural variants in the human genome. Cell 141: 1171–1182 [DOI] [PMC free article] [PubMed] [Google Scholar]
- Iskow RC, McCabe MT, Mills RE, Torene S, Pittard WS, Neuwald AF, Van Meir EG, Vertino PM, Devine SE 2010. Natural mutagenesis of human genomes by endogenous retrotransposons. Cell 141: 1253–1261 [DOI] [PMC free article] [PubMed] [Google Scholar]
- Kaessmann H, Vinckenbosch N, Long M 2009. RNA-based gene duplication: Mechanistic and evolutionary insights. Nat Rev Genet 10: 19–31 [DOI] [PMC free article] [PubMed] [Google Scholar]
- Karakoc E, Alkan C, O'Roak BJ, Dennis MY, Vives L, Mark K, Rieder MJ, Nickerson DA, Eichler EE 2011. Detection of structural variants and indels within exome data. Nat Methods 9: 176–178 [DOI] [PMC free article] [PubMed] [Google Scholar]
- Korbel JO, Abyzov A, Mu XJ, Carriero N, Cayting P, Zhang Z, Snyder M, Gerstein MB 2009. PEMer: A computational framework with simulation-based error models for inferring genomic structural variants from massive paired-end sequencing data. Genome Biol 10: R23. [DOI] [PMC free article] [PubMed] [Google Scholar]
- Kubo S, Seleme MDC, Soifer HS, Perez JLG, Moran JV, Kazazian HH, Kasahara N 2006. L1 retrotransposition in nondividing and primary human somatic cells. Proc Natl Acad Sci 103: 8036–8041 [DOI] [PMC free article] [PubMed] [Google Scholar]
- Lee S, Hormozdiari F, Alkan C, Brudno M 2009. MoDIL: Detecting small indels from clone-end sequencing with mixtures of distributions. Nat Methods 6: 473–474 [DOI] [PubMed] [Google Scholar]
- Levy S, Sutton G, Ng PC, Feuk L, Halpern AL, Walenz BP, Axelrod N, Huang J, Kirkness EF, Denisov G, et al. 2007. The diploid genome sequence of an individual human. PLoS Biol 5: e254. [DOI] [PMC free article] [PubMed] [Google Scholar]
- Li H, Durbin R 2010. Fast and accurate long read alignment with Burrows-Wheeler transform. Bioinformatics 26: 589–595 [DOI] [PMC free article] [PubMed] [Google Scholar]
- Lipkus A 1999. A proof of the triangle inequality for the Tanimoto distance. J Math Chem 26: 263–265 [Google Scholar]
- Locke DP, Hillier LW, Warren WC, Worley KC, Nazareth LV, Muzny DM, Yang S-P, Wang Z, Chinwalla AT, Minx P, et al. 2011. Comparative and demographic analysis of orang-utan genomes. Nature 469: 529–533 [DOI] [PMC free article] [PubMed] [Google Scholar]
- Marques AC, Dupanloup I, Vinckenbosch N, Reymond A, Kaessmann H 2005. Emergence of young human genes after a burst of retroposition in primates. PLoS Biol 3: e357. [DOI] [PMC free article] [PubMed] [Google Scholar]
- McCarrey JR, Thomas K 1987. Human testis-specific PGK gene lacks introns and possesses characteristics of a processed gene. Nature 326: 501–505 [DOI] [PubMed] [Google Scholar]
- Mills RE, Walter K, Stewart C, Handsaker RE, Chen K, Alkan C, Abyzov A, Yoon SC, Ye K, Cheetham RK, et al. 2011. Mapping copy number variation by population-scale genome sequencing. Nature 470: 59–65 [DOI] [PMC free article] [PubMed] [Google Scholar]
- Nisole S, Saïb A 2004. Early steps of retrovirus replicative cycle. Retrovirology 1: 9. [DOI] [PMC free article] [PubMed] [Google Scholar]
- Pei B, Sisu C, Frankish A, Howald C, Habegger L, Mu XJ, Harte R, Balasubramanian S, Tanzer A, Diekhans M, et al. 2012. The GENCODE pseudogene resource. Genome Biol 13: R51. [DOI] [PMC free article] [PubMed] [Google Scholar]
- Poliseno L, Salmena L, Zhang J, Carver B, Haveman WJ, Pandolfi PP 2010. A coding-independent function of gene and pseudogene mRNAs regulates tumour biology. Nature 465: 1033–1038 [DOI] [PMC free article] [PubMed] [Google Scholar]
- Rhesus Macaque Genome Sequencing and Analysis Consortium 2007. Evolutionary and biomedical insights from the rhesus macaque genome. Science 316: 222–234 [DOI] [PubMed] [Google Scholar]
- Sakai H, Koyanagi KO, Imanishi T, Itoh T, Gojobori T 2007. Frequent emergence and functional resurrection of processed pseudogenes in the human and mouse genomes. Gene 389: 196–203 [DOI] [PubMed] [Google Scholar]
- Salmena L, Poliseno L, Tay Y, Kats L, Pandolfi PP 2011. A ceRNA hypothesis: The Rosetta Stone of a hidden RNA language? Cell 146: 353–358 [DOI] [PMC free article] [PubMed] [Google Scholar]
- Sasidharan R, Gerstein M 2008. Genomics: Protein fossils live on as RNA. Nature 453: 729–731 [DOI] [PubMed] [Google Scholar]
- Schrider DR, Stevens K, Cardeño CM, Langley CH, Hahn MW 2011. Genome-wide analysis of retrogene polymorphisms in Drosophila melanogaster. Genome Res 21: 2087–2095 [DOI] [PMC free article] [PubMed] [Google Scholar]
- Schrider DR, Navarro FCP, Galante PAF, Parmigiani RB, Camargo AA, Hahn MW, de Souza SJ 2013. Gene copy-number polymorphism caused by retrotransposition in humans. PLoS Genet 9: e1003242. [DOI] [PMC free article] [PubMed] [Google Scholar]
- Shi X, Seluanov A, Gorbunova V 2007. Cell divisions are required for L1 retrotransposition. Mol Cell Biol 27: 1264–1270 [DOI] [PMC free article] [PubMed] [Google Scholar]
- Sindi S, Helman E, Bashir A, Raphael BJ 2009. A geometric approach for classification and comparison of structural variants. Bioinformatics 25: i222–i230 [DOI] [PMC free article] [PubMed] [Google Scholar]
- Stark A, Brennecke J, Bushati N, Russell RB, Cohen SM 2005. Animal microRNAs confer robustness to gene expression and have a significant impact on 3′UTR evolution. Cell 123: 1133–1146 [DOI] [PubMed] [Google Scholar]
- Stewart C, Kural D, Strömberg MP, Walker JA, Konkel MK, Stütz AM, Urban AE, Grubert F, Lam HYK, Lee W-P, et al. 2011. A comprehensive map of mobile element insertion polymorphisms in humans. PLoS Genet 7: e1002236. [DOI] [PMC free article] [PubMed] [Google Scholar]
- Tam OH, Aravin AA, Stein P, Girard A, Murchison EP, Cheloufi S, Hodges E, Anger M, Sachidanandam R, Schultz RM, et al. 2008. Pseudogene-derived small interfering RNAs regulate gene expression in mouse oocytes. Nature 453: 534–538 [DOI] [PMC free article] [PubMed] [Google Scholar]
- Tsirigos A, Rigoutsos I 2009. Alu and b1 repeats have been selectively retained in the upstream and intronic regions of genes of specific functional classes. PLoS Comput Biol 5: e1000610. [DOI] [PMC free article] [PubMed] [Google Scholar]
- Vinckenbosch N, Dupanloup I, Kaessmann H 2006. Evolutionary fate of retroposed gene copies in the human genome. Proc Natl Acad Sci 103: 3220–3225 [DOI] [PMC free article] [PubMed] [Google Scholar]
- Wang L-Y, Abyzov A, Korbel JO, Snyder M, Gerstein M 2009. MSB: A mean-shift-based approach for the analysis of structural variation in the genome. Genome Res 19: 106–117 [DOI] [PMC free article] [PubMed] [Google Scholar]
- Watanabe T, Totoki Y, Toyoda A, Kaneda M, Kuramochi-Miyagawa S, Obata Y, Chiba H, Kohara Y, Kono T, Nakano T, et al. 2008. Endogenous siRNAs from naturally formed dsRNAs regulate transcripts in mouse oocytes. Nature 453: 539–543 [DOI] [PubMed] [Google Scholar]
- Wen Y-Z, Zheng L-L, Liao J-Y, Wang M-H, Wei Y, Guo X-M, Qu L-H, Ayala FJ, Lun Z-R 2011. Pseudogene-derived small interference RNAs regulate gene expression in African Trypanosoma brucei. Proc Natl Acad Sci 108: 8345–8350 [DOI] [PMC free article] [PubMed] [Google Scholar]
- Whitfield ML, Sherlock G, Saldanha AJ, Murray JI, Ball CA, Alexander KE, Matese JC, Perou CM, Hurt MM, Brown PO, et al. 2002. Identification of genes periodically expressed in the human cell cycle and their expression in tumors. Mol Biol Cell 13: 1977–2000 [DOI] [PMC free article] [PubMed] [Google Scholar]
- Witherspoon DJ, Xing J, Zhang Y, Watkins WS, Batzer MA, Jorde LB 2010. Mobile element scanning (ME-Scan) by targeted high-throughput sequencing. BMC Genomics 11: 410. [DOI] [PMC free article] [PubMed] [Google Scholar]
- Xie Y, Mates L, Ivics Z, Izsvák Z, Martin SL, An W 2013. Cell division promotes efficient retrotransposition in a stable L1 reporter cell line. Mob DNA 4: 10. [DOI] [PMC free article] [PubMed] [Google Scholar]
- Ye K, Schulz M, Long Q, Apweiler R, Ning Z 2009. Pindel: A pattern growth approach to detect break points of large deletions and medium sized insertions from paired-end short reads. Bioinformatics 25: 2865–2871 [DOI] [PMC free article] [PubMed] [Google Scholar]
- Zhang Z, Harrison P, Gerstein M 2002. Identification and analysis of over 2000 ribosomal protein pseudogenes in the human genome. Genome Res 12: 1466–1482 [DOI] [PMC free article] [PubMed] [Google Scholar]
- Zhang Z, Harrison PM, Liu Y, Gerstein M 2003. Millions of years of evolution preserved: A comprehensive catalog of the processed pseudogenes in the human genome. Genome Res 13: 2541–2558 [DOI] [PMC free article] [PubMed] [Google Scholar]
- Zhang Z, Carriero N, Gerstein M 2004. Comparative analysis of processed pseudogenes in the mouse and human genomes. Trends Genet 20: 62–67 [DOI] [PubMed] [Google Scholar]
- Zhang ZD, Du J, Lam H, Abyzov A, Urban AE, Snyder M, Gerstein M 2011. Identification of genomic indels and structural variations using split reads. BMC Genomics 12: 375. [DOI] [PMC free article] [PubMed] [Google Scholar]