

Abstract
Compared with histone H3, acetylation of H4 tails has not been well studied, especially in mammalian cells. Yet, H4K16 acetylation is of particular interest because of its ability to decompact nucleosomes in vitro and its involvement in dosage compensation in flies. Here we show that, surprisingly, loss of H4K16 acetylation does not alter higher-order chromatin compaction in vivo in mouse embryonic stem cells (ESCs). As well as peaks of acetylated H4K16 and KAT8 histone acetyltransferase at the transcription start sites of expressed genes, we report that acetylation of H4K16 is a new marker of active enhancers in ESCs and that some enhancers are marked by H3K4me1, KAT8, and H4K16ac, but not by acetylated H3K27 or EP300, suggesting that they are novel EP300 independent regulatory elements. Our data suggest a broad role for different histone acetylation marks and for different histone acetyltransferases in long-range gene regulation.
Histone acetylation has long been associated with gene expression. Unlike histone methylation, where modification of different H3 residues is associated with distinct functions and mediated by different methyltransferases, histone lysine acetyltransferases (HATs) often seem to have a fairly broad substrate specificity and can modify a number of different lysine residues in histones and nonhistone proteins (Peterson and Laniel 2004). Mutagenesis suggests that there is functional redundancy between most of the different acetylatable lysines in the H3 and H4 tails in budding yeast (Mann and Grunstein 1992; Dion et al. 2005). Consistent with this, there is a high degree of correlation between the acetylation state of a particular residue and most of the other lysine residues in core histones (Millar et al. 2004). The outlier in that analysis is H4K16—acetylation of which correlated poorly with that of other lysines in histones. Acetylation of histone H4 on lysine 16 (H4K16ac) is also especially important for chromatin structure and function in a variety of eukaryotes (Dion et al. 2005) and is catalyzed by specific HATs (Millar et al. 2004).
Histone acetylation influences chromatin structure in several ways. It can provide a platform for the binding of proteins that contain domains which recognize acetylated lysine residues. Secondly, it can block the function of chromatin remodellers (Corona et al. 2002). Thirdly, and most directly, it neutralizes the positive charge on lysines. H4K16 is particularly interesting from this point of view: It is the only acetylatable residue in the basic patch of the H4 N-terminal tail (Dorigo et al. 2003), and by contacting the acidic patch of H2A/H2B in adjacent nucleosomes it can direct the formation of a compact higher-order chromatin structure in vitro (Dorigo et al. 2004; Shogren-Knaak et al. 2006; Robinson et al. 2008). Conversely, by blocking the binding of the ε-amino group of K16 to a site on H2B in an adjacent nucleosome, acetylation of H4K16 weakens the nucleosome–nucleosome stacking and the self-association of nucleosome core particles (Allahverdi et al. 2011; Liu et al. 2011). Consistent with these in vitro data, deacetylation of H4K16 is important in heterochromatin formation in budding yeast (Millar et al. 2004).
In Drosophila, H4K16 acetylation is targeted to the X chromosome of male flies and is important for dosage compensation (Bone et al. 1994). Indeed, the puffed appearance of the Drosophila hyperactive male X chromosome is consistent with H4K16ac leading to chromatin decondensation in vivo. The enzyme responsible for this H4K16 acetylation is the MYST-family HAT MOF that functions in dosage compensation as part of the MSL complex.
MOF is found at both the 5′ and 3′ ends of genes on the dosage-compensated X chromosome of male flies. However, elsewhere in the genome and in female flies MOF is located mainly at the 5′ end of active genes, and its binding there is independent of the MSL complex. Consistent with this, peaks of H4K16ac are found toward the 5′ end of transcriptionally active autosomal genes, whereas a broad domain of H4K16ac is found across dosage-compensated genes in male flies (Kind et al. 2008).
It is unclear to what extent MOF is the HAT responsible for the 5′ peak of H4K16ac at autosomal genes (Gelbart et al. 2009). In flies, MOF is also found in a complex distinct from MSL—the nonspecific lethal (NSL) complex, which contains the MSL1-like proteins NSL1, NSL2, NSL3, MCRS2, MBD-R2, and WDR5 (Raja et al. 2010). WDR5 is also part of compass-like H3K4me3 complexes. NSL targets MOF to the 5′ end of genes in flies (Prestel et al. 2010; Feller et al. 2011), where it is suggested to regulate the expression of housekeeping genes (Lam et al. 2012).
NSL is also present in mammalian cells and is responsible for most of the H4K16 acetylation (Smith et al. 2005; Taipale et al. 2005). KAT8, the mammalian homolog of MOF, has been detected by chromatin immunoprecipitation (ChIP) at the promoters and transcribed regions of active genes in human CD4+ T cells and in mouse embryonic stem cells (ESCs) (Wang et al. 2009; Li et al. 2012). Interestingly, although many HATs, e.g., Kat5, EP300 (p300), and Kat2a, have little effect on pluripotency, but mainly affect ESC differentiation (Lin et al. 2007; Fazzio et al. 2008; Zhong and Jin 2009), Kat8 deletion leads to loss of ESC self-renewal (Li et al. 2012).
Many histone acetylation residues have been mapped genome wide by ChIP in a wide variety of mammalian cell types as part of the ENCODE and Roadmap Epigenomics Project. Surprisingly, given its particular significance for chromatin structure, H4K16ac is not among those histone modifications that have been analyzed extensively in this way. Here we use native ChIP to determine the genome-wide distribution of H4K16ac in undifferentiated and differentiated mouse ESCs, and we use fluorescence in situ hybridization (FISH) to detect any changes in the in vivo chromatin compaction state at pluripotency loci that lose extensive H4K16ac domains during differentiation. Our data suggest a novel role for KAT8 and H4K16ac in long-range gene regulation and reveal a new class of enhancers in ESCs
Results
H4K16 acetylation is enriched around the transcriptional start site of active genes in ESCs
To determine the genome-wide distribution of H4K16 acetylation we performed native ChIP with an antibody detecting H4K16ac in undifferentiated mouse 46c ESCs. The specificity of the anti-H4K16ac antibody was confirmed with a modified histone peptide array (Pradeepa et al. 2012; Supplemental Fig. S1A). Immunoprecipitated DNA was assessed by high-throughput sequencing. To examine the global profile of H4K16ac around transcribed regions, we created tag density counts (reads per million/RPM) for 5-kb regions surrounding either the transcriptional start site (TSS) or the transcription end site (TES) and for percentile regions across gene bodies (with ±2-kb regions in 200-bp windows). This was compared across quartiles of gene expression, from high gene expression (Q1) to low expression (Q4), as ascertained by expression profiling (Fig. 1A).
Figure 1.

Profile of H4K16 acetylation in undifferentiated ESCs. (A) Input normalized (average reads per million/RPM) H4K16ac native ChIP-seq tag counts around (±5 kb) the transcription start site (TSS) and transcription end site (TES) of genes separated into quartiles according to expression in ESC from high to low (Q1–Q4). (B, top) H4K16ac/H3K27ac/H3K4me3 profiles (RPM/bp), in 200-bp sliding windows with a 20-bp step, across the Actb (active) and Ifng (silent) loci. Exons are shown as boxes below the graph, and the direction of transcription is indicated. (Bottom) Log2 H4K16ac/input at Actb and Ifng established by hybridization of H4K16ac ChIP DNA to a custom microarray. (C) Average RPM/bp tag counts across gene bodies for 500 active (left) and inactive (right) genes (in intervals of 10% of gene length) and extending 2 kb upstream of the TSS, and 2 kb downstream (in 200-bp intervals). Data are for H4K16ac (blue), H3K4me3 (pink), and H3K36me3 (green). (D) Genomic distribution of H4K16ac, H3K27ac, and H3K4me3 peaks in ESCs, and 0.5 × 10⁶ peaks randomly distributed throughout the genome. (Left) Percentage of histone modification peaks found across each category of genomic sequence, relative to mm9 RefSeq genes. (Right) Schematic detailing the categorization (peaks classified as distal intergenic do not fall into any of the previous categories).
A peak of H4K16ac was seen around the TSS of active genes, which is greatest at the most active genes, consistent with the pattern of H4K16ac reported previously in CD4+T cells (Wang et al. 2008). This result was confirmed in an independent (OS25) ESC line (Supplemental Fig. S1B). There is no H4K16ac around the TES. The distribution pattern of H4K16ac is typified by the profiles across the active beta actin (Actb) (Fig. 1B) and Calm1 (Supplemental Fig. S1C) genes, where peaks of H4K16ac occur at the promoters/5′ ends, and by the absence of H4K16ac at Ifng, which is silent in ES cells (Fig. 1B). The same distribution patterns are also seen when immunoprecipitated DNA was analyzed on genomic microarrays (Fig. 1B; Eskeland et al. 2010a).
To examine the localization of H4K16ac across genes and regulatory regions more closely, we generated RPM per base pair (RPM/bp) profiles for averaged gene bodies and for 2-kb windows upstream of the TSS and downstream from the TES. The majority of H4K16ac is located on active promoters, up to 2 kb upstream of the TSS, and extends ∼20%–30% into the body of the gene, but is not enriched at the 3′ end of the coding region or after the TES (Fig. 1C). H4K16ac distribution on the promoters of active genes is similar to that of H3K4me3, but is broader, with peaks of almost equal height centered over the +1 and −1 nucleosomes, whereas H3K4me3 peaks asymmetrically over the +1 position. H4K16ac also spreads further into the gene body compared with H3K4me3, but its distribution differs from that of H3K36me3, a histone modification associated with the elongation of transcription and enriched on the gene bodies of active genes (Fig. 1C). The association of H4K16ac with active genes is consistent with the requirement for KAT8 for expression of the pluripotency network in ESCs (Li et al. 2012).
We analyzed the distribution of H4K16ac peaks over nine categories of genomic region (detailed in Fig. 1D, right). The majority of H4K16ac peaks fall within genic regions, but large proportions are also found 10 kb upstream of TSS or downstream from TES. By comparison with H3K4me3, a much lower proportion of H4K16ac peaks fall immediately over the TSS (−1000 in Fig. 1D). The profile of H4K16ac shares more similarity with H3K27ac (see below).
H4K16ac changes during the differentiation of ES cells
In Drosophila, the MOF/NSL complex is thought to be associated with housekeeping genes; however, KAT8 is required for murine development (Gupta et al. 2008; Thomas et al. 2008; Li et al. 2012), suggesting that H4K16ac may be associated with developmentally regulated gene expression. In order to investigate this we differentiated 46c ESCs into neural progenitor cells (NPCs) and purified the Sox1-GFP-expressing NPCs by fluorescence-activated cell sorting (FACS). Differentiation was also confirmed by expression microarrays: GO term analysis of up-regulated genes showed an enrichment of terms for neuronal genes. We performed native ChIP sequencing in ESC and NPCs, and the levels of H4K16ac across the TSS of all genes was separated by expression into four quartiles. Surprisingly, this revealed that, unlike in ESCs, there is no significant enrichment of H4K16ac around TSS compared with input, and no relationship to gene expression levels in NPCs (Fig. 2A). Western blot showed that this does not simply reflect a global loss of H4K16ac upon NPC differentiation, which has been reported during later stages of embryoid body or retinoic acid (RA)-induced ESC differentiation (Fig. 2B; Li et al. 2012).
Figure 2.

Gain and loss of H4K16 acetylation during ESC differentiation. (A) Normalized (average reads per million/RPM) H4K16ac (solid lines) or input (dotted lines) ChIP-seq tag counts around (±5 kb) the transcription start site (TSS) and transcription end site (TES) of genes separated into quartiles according to expression in ESC (left) or NPC (right) (from high to low [Q1–Q4]). (B) Western blot of H4K16ac in undifferentiated OS25 ESC, OS25 cells after 3 d of differentiation using retinoic acid (lanes 1 and 2), undifferentiated 46c ESC, and NPCs (lanes 3 and 4). Levels of H3 are shown for comparison. (C) UD H4K16ac, UD input, NPC H4K16ac, and NPC input profiles (RPM/bp), in 200-bp sliding windows with a 20-bp step, across the Tcl1 locus, which is silenced upon NPC differentiation. Exons are shown as boxes below the graph and the direction of transcription is indicated. (D) As in C, across the Actb locus, this maintains similarly high levels of expression in UD ESC and NPCs. At the bottom, log2 H4K16ac/input is shown at Actb established by hybridization to a custom microarray of ChIP DNA from 46c ESC and 46c NPC. Chromosome position and RefSeq gene annotations are used from July 2007 (mm9) mouse genome build (UCSC). (E) As in C, across the Foxb1 locus, this is silent in ESC, and highly expressed in NPCs. (F) RPM H4K16ac (solid lines) or input (dotted lines) ChIP-seq tag counts around (±5 kb) the TSS of genes differentially up-regulated in either ESC (ESC up genes, green lines) or NPC (NPC up genes, red lines). Data are shown for ESC (left) and NPC (right).
Genes that lose expression upon differentiation to NPCs (e.g., Tcl1) lose peaks of H4K16ac around their promoters (Fig. 2C). Some genes that retain similar levels of expression between ESCs and NPCs (e.g., Actb) still retain a small peak of H4K16ac over their promoter (Fig. 2D), though this is much reduced, and is not true of all genes in this class. This was also confirmed by ChIP-chip (Fig. 2D). However, genes that gain expression upon differentiation to NPCs (e.g., Foxb1 in Fig. 2E) do not generally gain a peak of H4K16ac in NPCs.
To determine how H4K16ac changes genome wide, we used the expression profiles from undifferentiated (UD) ESCs and differentiated NPC cells to determine genes that have higher expression in UD than in NPC, and conversely genes whose expression increases during the differentiation to NPCs. In UD cells, there is a clear difference between these two classes of genes; levels of H4K16ac are much greater on genes that are more highly expressed UD ESCs than in NPCs. However, in NPCs, there is little difference in average levels of H4K16ac between the two gene classes (Fig. 2F).
We performed the same analysis on ESCs differentiated for 3 d (D3) with RA. This revealed a similar reduction in H4K16ac peak height over active genes during differentiation, though here, active genes in the differentiated cell population could still be distinguished from inactive genes by H4K16ac tag density (Supplemental Fig. S2A). Similarly, genes that gained in expression in D3 cells showed modestly higher H4K16ac than genes that were more highly expressed in UD cells (Supplemental Fig. S2B). Additionally, Hox genes that are activated during RA-induced differentiation show a clear increase of H4K16ac during differentiation (Supplemental Fig. S2C).
H4K16 acetylation does not impact upon large-scale chromatin compaction
In vitro, acetylation of H4K16 has been shown to result in a loss of nucleosome–nucleosome interactions and a disruption of chromatin compaction in vitro (Dorigo et al. 2004; Shogren-Knaak et al. 2006; Robinson et al. 2008; Liu et al. 2011). The gross chromatin compaction defects reported in Kat8-deficient murine ESCs (Li et al. 2012) would be consistent with H4K16ac leading to chromatin decompaction in vivo. However, a direct role of H4K16ac in chromatin decompaction at specific loci has not been tested in vivo in mammalian cells.
To determine directly whether large domains of H4K16ac, and their loss during differentiation, correlate with visible changes in chromatin compaction, we analyzed genomic regions at which H4K16ac is spread over large (>100 kb) genomic domains, rather than in discrete promoter-associated peaks, in undifferentiated ESCs, and where it is lost from these regions upon differentiation. The regions chosen for analysis were those encompassing Nanog and the adjacent pluripotency gene Dppa3, and Sox2 (Fig. 3A). To assay chromatin compaction, we used FISH with pairs of probes 90–150 kb apart from each other (Fig. 3B). The mean-squared interprobe distance (d2) has a linear relationship with genomic separation (kb) over this size range and can be used to both measure changes in chromatin compaction during development and ESC differentiation (Chambeyron and Bickmore 2004; Morey et al. 2007). Moreover, such analysis can determine the role of specific epigenetic pathways and histone modifications in chromatin compaction (Eskeland et al. 2010a). Indeed, in this way we have previously demonstrated a role for polycomb repressive complexes in compacting chromatin, and a general role for elevated histone acetylation, induced by inhibiting class I and class II histone deactylases, in decompacting higher-order chromatin structure at polycomb-repressed regions (Eskeland et al. 2010a,b). Normalization to nuclear size (nuclear radius squared: r2) takes into account any global changes in the nuclear area between cell types.
Figure 3.
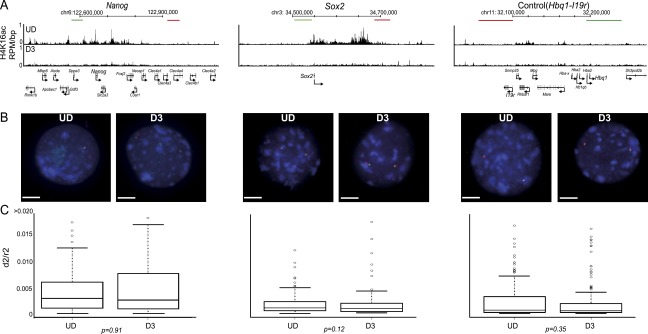
Loss of H4K16 acetylation does not correlate to chromatin compaction in vivo. (A) H4K16ac (RPM/bp in a 200-bp sliding window with a 20-bp step) across the Nanog, Sox2, and control (Hbq-Il9r) loci in undifferentiated ESC (UD, top row) and in differentiated cells (D3, bottom row). The position of fosmid probes (green and red boxes) used in FISH is indicated. Genomic maps are from the mm9 assembly of the mouse genome. (B) Example FISH images of nuclei from undifferentiated (UD; left) and differentiated (D3; left) ESCs, hybridized with probe pairs cross the Nanog, Sox2, and Hbq-Il9r loci. Nuclei were counterstained with DAPI (blue). Scale bar, 10 μm . (C) Boxplots indicating the distribution of squared interprobe distances (d2) normalized to nuclear radius2 (r2) for UD and D3 cells. Boxes show the median and interquartile range of the data; circles indicate outliers. n = 50 nuclei. Statistical significance of differences were examined by a Mann-Whitney U-test in R version 2.14.0.
Surprisingly, we detected no significant increase in chromatin compaction around the Nanog (P = 0.91) and Sox2 (P = 0.35) loci, as H4K16ac domains are lost from these regions during ESC differentiation (Fig. 3C). We therefore conclude that H4K16ac is not simply linked to the levels of higher-order chromatin compaction that are assayable by FISH.
H4K16 acetylation marks active enhancers in embryonic stem cells
While profiling the genome-wide location of H4K16ac peaks, we noticed that a proportion fell into intergenic locations and that the overall genomic distribution of H4K16ac is rather similar to that of H3K27ac (Fig. 1D). Given that previous studies have established certain histone modifications, including H3K27ac, as predictive factors for regulatory regions such as enhancers (Roh et al. 2005; Heintzman et al. 2007; Creyghton et al. 2010; Rada-Iglesias et al. 2011), we reasoned that the intergenic peaks of H4K16ac may predict enhancers. Indeed, a peak of H4K16ac downstream from Klf4 in ES cells (Supplemental Fig. S1E) seems to locate at the cis-regulatory sequence that corresponds to a DNase I hypersensitive site (DHS) in the UCSC Genome Browser, which has been reported to be marked by H3K4me1 (a mark considered indicative of both active and inactive enhancers), H3K27ac, and EP300 in ES cells (Shen et al. 2012).
To investigate this more widely, we identified active and inactive enhancers in ESCs by previously established criteria, using publicly available genome-wide ChIP-seq data for H3K4me1 and H3K27ac (Creyghton et al. 2010; Rada-Iglesias et al. 2011). The H4K16ac profile over active enhancers is very similar to that of H3K27ac (Fig. 4A), and enhancers generally defined as active (H3K4me1+/H3K27ac+) have considerably more H4K16ac than inactive ones (H3K4me1+/H3K27ac−) (Fig. 4B). H3K4me3, which is known to mark promoters rather than enhancers (Rada-Iglesias et al. 2011), and MNase digested input DNA, were used as negative controls.
Figure 4.

H4K16ac is found on active enhancers. (A,B) Heatmaps of H4K16ac, H3K27ac, H3K4me1, H3K4me3, and input ChIP-seq data (RPM) at H3K4me1+/H3K27ac+ (A), and H3K4me1+/H3K27ac− (B) marked enhancers. Data are ranked by sum of hits in the H4K16ac data set; 10-kb window around enhancer midpoint, in 500-bp windows. Intensity is determined by RPM. (C) Histone modification profiles and DNase I hypersensitive sites (DHS) across (top) a genetically defined enhancer active in ES cells (Igll1-Vpreb1 loci) and (bottom) a neuron-specific enhancer (at Mnx1 locus) not active in ESCs. Purple box indicates the likely enhancer location. Histone modifications are shown as RPM/bp in 200-bp sliding windows with 20-bp step, DHS sites are shown as tag density in a 150-bp window with a 20-bp step. (D) Quantification of SICER defined H3K27ac+/H3K4me1+/H3K4me3-, and H4K16ac+/H3K4me1+/H3K4me3- peak overlap. Venn diagram illustrates number of clustered active enhancers marked by H4K16ac or H3K27ac alone, or both together. (E) Profiles of H4K16ac, H3K27ac, H3K4me1, and H3K4me3, at an example of an H4K16ac+/H3K27ac-/H3K4me1+ putative active enhancer. Histone modifications and DHS sites shown as in C. (F) Heatmaps of H4K16ac, H3K27ac, H3K4me1, H3K4me3, and input ChIP-seq data (RPM) at H3K4me1+/H3K27ac+ (top), and H3K4me1+/H3K27ac− (bottom) marked enhancers in NPCs. Data are ranked by sum of hits in the H3K27ac data set; 10-kb window around enhancer midpoint, in 500-bp windows. Intensity is determined by RPM. (G) Profiles of NPC H4K16ac, H3K27ac, H3K4me1, and H3K4me3, as an example of an enhancer active in neuronal cell types (Antonellis et al. 2008). Histone modifications and DHS sites shown as in C.
At the genetically defined ESC active enhancer for Igll1/lambda5 (Liber et al. 2010), located between the Igll1 and Vpreb1 genes, there is no H3K4me3, but there is a peak of H4K16ac along with the previously defined enhancer marks, H3K4me1 and H3K27ac, in the Igll1–Vpreb1 intergenic region, coincident with a DHS. (Fig. 4C). Conversely, at the Mnx1 locus, the inactive motor neuron specific enhancer (Nakano et al. 2005) is marked by H3K4me1, but not H4K16ac or H3K27ac.
Globally, H4K16ac tag density and peak width are higher on promoters compared with enhancers, but at most pluripotency genes the H4K16ac level on enhancers is as high as it is on the promoters of these genes (Supplemental Fig. S3).
We noticed that a number of enhancers with lower levels of H3K27ac showed little to no H4K16ac in ESCs, while other enhancers defined as “inactive” due to their lack of H3K27ac showed H4K16ac. This suggests that some enhancers may be marked as active by one histone acetylation mark or the other. To quantify this, we defined distal H3K4me1+/H3K4me3− regions that overlapped either H3K27ac or H4K16ac, giving a total of 16,947 putatively active enhancers. A total of 37% of these regions overlap, but 2180 regions are unique to H4K16ac and 8420 are unique to H3K27ac (Fig. 4D). Of the 2180 H3K27ac independent regions, 74% are also acetylated at H4K16 in the replicate data set from an independent ES cell line. The number of H4K16ac+/H3K27ac− regions was significantly enriched at enhancers compared with the genome-wide level (P < 0.01, Fisher's exact test). An example of an H4K16ac+/H3K4me1+/H3K27ac− region at the Sgsm1 locus is shown in Figure 4E.
Finally, we wanted to examine whether the presence of H4K16ac on active enhancers was also a feature of differentiated cells. We therefore identified active and inactive enhancers using publicly available data for H3K4me1 and H3K27ac in NPCs (Meissner et al. 2008; Creyghton et al. 2010). We do not find that H4K16ac is present on active or inactive enhancers in this cell type (Fig. 4F). In addition, we looked at the NPC histone modification profile of a genetically defined active neural Sox10 enhancer (Antonellis et al. 2008). The region shows clear peaks of H3K27ac and H3K4me1, but has no enrichment of H4K16ac (Fig. 4G).
H4K16ac and KAT8 define a class of enhancers independent of H3K27ac and EP300
Although most H4K16 acetylation is thought to be mediated by KAT8 (Smith et al. 2005; Taipale et al. 2005; Li et al. 2012), it is possible that other enhancer-localized HATs, such as EP300, could catalyze H4K16ac at regulatory regions. Therefore, we used publicly available ChIP-seq data (Wang et al. 2008; Li et al. 2012) to compare KAT8 and EP300 binding profiles across the ES cell genome.
As expected from the H4K16ac profile, and similar to EP300, KAT8 shows a much higher peak over the TSS of active genes than for inactive genes (Fig. 5A). Moreover, like EP300, KAT8 is also generally enriched around enhancers defined as active (H3K27ac+), but not inactive (H3K27ac−) (P < 2.2 × 10⁻¹⁶ for KAT8 and EP300) (Fig. 5B). Genome wide, peaks of H4K16ac have a greater overlap with KAT8 (71%) than with EP300 (58%), with 53% of H4K16ac peaks overlapping both HATs (Fig. 5C). A small number of KAT8 independent H4K16ac peaks are overlapped by EP300 (5%), compared with 18% of EP300 independent H4K16ac peaks that overlap KAT8. However, the lower sequencing depth of the EP300 data set may result in some false negatives. In some cases, for example, the intragenic enhancer in Kndc1 upstream of Utf1, KAT8 binding mirrors the profile of H4K16ac, H3K27ac, and H3K4me1 better than does EP300 (Fig. 5D).
Figure 5.

KAT8 is found on active enhancers. (A) RPM cross-linked ChIP-seq tag counts from ESCs around (±5 kb) the TSS and TES of active (green) and inactive (red) genes for KAT8 (left) and EP300 (right). (B) Average RPM per enhancer tag counts around the enhancer midpoint of active (H3K4me1+/H3K27ac+) or inactive enhancers for KAT8 (left) or EP300 (right) ChIP-seq (solid lines) or for input DNAs (dotted lines). (C) Quantification of SICER defined H4K16ac, KAT8, and EP300 peak overlap. Venn diagrams from left to right illustrate number of peaks overlapping between H4K16ac/KAT8, H4K16ac/EP300, and KAT8/EP300, respectively. (D) H4K16ac/KAT8/EP300/H3K27ac/ H3K4me1/ and H3K4me3 ChIP profiles from ESCs around the Kndc1-Utf1 locus. Data are shown as RPM per base pair (bp) in 200-bp sliding windows with a 20-bp step. Purple-shaded boxes indicate regions where the KAT8 distribution more closely mirrors that of H3K27ac than does EP300. (E) H4K16ac/KAT8/H3K27ac/EP300/H3K4me1/input and DHS profiles from ESCs across a potentially H4K16ac-specific active enhancer in the Emid1 locus. The peak of H4K16ac and KAT8 (purple-shaded area) corresponds to a strong DHS and a peak of H3K4me1, but not of EP300/H3K27ac.
There is also a small enrichment of KAT8 over enhancers that would have been defined as inactive based upon the absence of H3K27ac-defined peaks. Figure 5E shows an example of a KAT8 peak in an intron of Emid1, which overlaps peaks of H4K16ac and H3K4me1 and a DHS, whereas an EP300 peak was not detected, and the level of H3K27ac does not reach the threshold for peak calling.
To demonstrate the enhancer function of KAT8 bound/H4K16 acetylated regulatory regions, we cloned regions with peaks of H4K16ac and H3K4me1, but not H3K27ac, into a luciferase reporter vector with a minimal promoter. As a positive control, the genetically defined (Jiang et al. 2008) ESC enhancer of Nanog (gray-shaded box in Fig. 6A) was used. The H3K4me1+/H4K16ac+/H3K27ac− regulatory region downstream from Gsx2 (AE3) and the enhancer at the 3′ end of Otop3 (AE4) are shown as examples of other tested regions (Fig. 6B,C). Regions with H3K4me1, but not H3K27ac or H4K16ac, were used as negative controls. The Nanog enhancer and all four tested distal regulatory regions that are H4K16ac+/ H3K27ac− had two- to 28-fold higher luciferase activity in ESCs compared with the plasmid control. Regions with H3K4me1 peaks but not H3K27ac or H4K16ac show no activity (Fig. 6D). Therefore, we conclude that KAT8-mediated H4K16 acetylation may mark a new set of long-range regulatory elements in mammalian ESCs.
Figure 6.

H4K16ac peaks have enhancer activity. (A) H4K16ac/KAT8/H3K27ac/EP300/H3K4me1/input and DHS profiles from ES cells in the 5′ regulatory region upstream of Nanog. ChIP data are shown as RPM per base pair (bp) in 200-bp sliding windows with a 20-bp step. DHS sites are shown as tag density in a 150-bp window with a 20-bp step. Gray-shaded box indicates a genetically defined Nanog enhancer that is used for luciferase assay. (B,C) H4K16ac, H3K27ac, H3K4me1, and H3K4me3 profiles across enhancer downstream from (B) Gsx2 gene (AE3) and (C) in an intragenic region of Otop3 (AE4). ChIP data are shown as RPM per base pair (bp) in 200-bp sliding windows with a 20-bp step. DHS sites are shown as tag density in a 150-bp window with a 20-bp step. Purple-shaded areas correspond to regulatory regions with H4K16ac peaks but not H3K27ac, and these regions were cloned for enhancer reporter assay (D). (D) Enhancer reporter assay for genetically defined enhancer of Nanog (Nanog), and randomly chosen active enhancers based on H3K4me1 and H4K16ac peaks but not H3K27ac peaks (AE1–AE4). Regions with putative inactive enhancers containing H3K4me1 peaks, but neither H3K27ac nor H4K16ac (in AE1, in AE2) were also assayed. Empty vector pGL4.26 (Control) served as a negative control. Firefly luciferase activity was normalized to transfection efficiency with Renilla luciferase activity using pRL-TK, log2 fold change in luciferase activity was plotted with error bars showing standard error of mean from two biological and eight technical replicates (n = 8).
Discussion
We find a high H4K16ac level around the transcription start sites (TSS) of expressed genes in mouse ESCs (Fig. 1). Upon differentiation, H4K16ac is reduced at TSS, although the global abundance of this histone modification seems unchanged (Fig. 2). Few specific genes gain H4K16ac during differentiation: Hox genes appearing to be an exception (Supplemental Fig. S2). The genomic sites that gain H4K16ac upon differentiation of ESCs remains unclear. There may be a general redistribution across the genome so that there are no longer many “peaks” of H4K16ac evident, or there may be a redistribution toward repetitive elements. Our preliminary analysis suggests that there may be some redistribution toward intronic sequences, but this will require further investigation (Supplemental Fig. S2D).
The enrichment of H4K16ac and KAT8 that we have found at the TSS of active genes in ES cells is similar to that reported for MOF in the context of the NSL complex in female Drosophila and on the autosomes (i.e., nondosage-compensated chromosomes) of male flies (Gelbart et al. 2009; Lam et al. 2012). We find no evidence for increased H4K16ac at the 3′ ends of mammalian genes, which is unlike the situation on the dosage-compensated Drosophila X chromosome (Kind et al. 2008). The gene-body enrichment of H4K16ac (Fig. 1D) and KAT8 (Li et al. 2012) suggest a possible role in transcriptional elongation in mammals, as has been proposed for the Drosophila MOF-containing MSL complex (Larschan et al. 2011).
KAT8 has been biochemically purified with several complexes associated with H3K4 methyltranferase activity—either directly with MLL1 (Dou et al. 2005) or in the context of the NSL complex (Cai et al. 2010) together with WDR5—which is required for global H3K4me3 (Wysocka et al. 2005) and is also found in MLL/SET COMPASS complexes. Histone tail cross-talk between the KAT8–MSL complex and H3K4me3 has also been reported (Wu et al. 2011). However, we find that the distributions of H4K16ac and H3K4me3 around the TSS of active genes are distinct. Whereas H3K4me3 is much higher on the +1 nucleosome than the −1, H4K16ac is more symmetrically distributed on these two nucleosomes surrounding the nucleosome free region (Fig. 1C). H3K4me3 is also generally absent from regulatory domains, indicating that at these sites, KAT8 is unlikely to be in complexes associated with H3K4me3 activity, or that the catalytic activity of the H3K4 methyltransferase is altered in such contexts, or that an H3K4me3 demethylase activity is in operation.
Although there is substantial evidence for a direct role of H4K16ac in reducing levels of chromatin compaction mediated by nucleosome–nucleosome interactions in vitro (Dorigo et al. 2004; Shogren-Knaak et al. 2006; Robinson et al. 2008; Allahverdi et al. 2011; Liu et al. 2011), we did not detect any visible changes in higher-order chromatin compaction in vivo at loci (Nanog and Sox2), where large domains of H4K16ac are lost upon ESC differentiation (Fig. 3). However, we cannot rule out a role for H4K16ac in decompaction of chromatin at a smaller local nucleosomal level that is not amenable to analysis by FISH. Since H4K16 has been shown to be important in mediating interactions between adjacent nucleosomes (Allahverdi et al. 2011; Liu et al. 2011), we suggest that the levels of chromatin compaction that can be assayed by FISH may instead be due to interactions between chromatin fibers. Our data suggest that the grossly aberrant chromatin compaction apparent in Kat8-deficient embryos and ESCs (Thomas et al. 2008; Li et al. 2012) may be an indirect effect of pan-cellular loss of this important factor, rather than a direct consequence of the loss of H4K16ac on chromatin compaction.
Surprisingly, like H3K27ac, we found that H4K16ac is enriched on active, but not inactive enhancers in ESCs (Figs. 4, 5). H3K27ac has generally been considered to be catalyzed by EP300 (Jin et al. 2011). However, we found enhancer-like elements where the KAT8 distribution more closely mirrors that of the H3K27ac than does EP300 (Fig. 5D,E). At these sites H3K27ac may therefore be catalyzed by another HAT (such as CREBBP/CBP), or by KAT8 in a context in which its substrate specificity has been relaxed (Cai et al. 2010).
Creyghton et al. (2010) suggested the existence of H3K27ac marked enhancers devoid of H3K4me1 (18% of H3K27ac peaks >2 kb from a TSS). Similarly, we found that in ESCs 59% of similarly distal H4K16ac peaks are devoid of H3K4me1.
Importantly, we also found some co-occurrence of H3K4me1-modified regulatory elements with H4K16ac, but not H3K27ac, suggesting that these regions could be novel enhancers in ESCs marked by KAT8-mediated H4K16ac, but not EP300-mediated H3K27ac (Fig. 6B,C). We validated five of these newly identified sites and found that they are indeed functionally active regulatory elements in reporter assays in ESCs (Fig. 6D).
We suggest that H4K16ac represents a new marker of active enhancers in ESCs, which can be independent of H3K27ac. As H4K16ac is a very abundant histone modification in some cell types, it is unlikely to make an efficient/specific marker for enhancers in its own right, but only in combination with other histone modifications or the presence of specific DNA-binding proteins. We note that H3K9K14ac was reported at the Igll1/lambda5 enhancer (Szutorisz et al. 2005) in ESCs, and also that a recently studied histone mark—H3K122ac, catalyzed by EP300/CREBBP—is found at active enhancers in the MCF7 human breast cancer cell line (Tropberger et al. 2013). The KAT2A (GCN5)/KAT2B (PCAF) containing the ATAC complex has also been shown to be bound at enhancers—both those marked by EP300 and those that are EP300 independent (Krebs et al. 2011). Although in this later case a histone substrate for the HAT activity of ATAC was not defined at the enhancers, these studies, together with our data, all point to a much broader role for histone acetylation and for different HATs in long-range gene regulation.
Methods
Cell culture
46c (Sox1-GFP) ESCs (Ying et al. 2003) were cultivated without feeders in 10% FCS and differentiated into neural progenitor cells (NPCs), essentially as described previously (Pollard et al. 2006). On day 0 of differentiation, 46c cells were seeded onto gelatinized dishes in N2B27 medium (0.5× B27supplement, 0.5× N2 supplement, 0.2 mM L-glutamine, 0.1 mM β-mercaptoethanol, Neurobasal medium:DMEM/F12 medium 1:1). Differentiating cells were trypsinized on day 5 and Sox1–GFP-positive+ cells were isolated using Fluorescence Activated Cell Sorting (FACS) on a BD FACSAriaII SORP (Becton Dickinson). BD FACSDiva software (Version 6.1.3) was used to control the instrument and analyze the data.
OS25 ESCs were cultured and differentiated by LIF withdrawal for 1 d and treatment with retinoic acid (RA) for 2 d (Morey et al. 2007).
Chromatin immunoprecipitation
The specificity of the anti-H4K16ac antibody (cat# 07-329 Millipore) was tested with a modified histone peptide array (Supplemental Fig. S1A) as described previously (Pradeepa et al. 2012). Native ChIP and assessment by hybridization to custom microarrays were as described previously (Eskeland et al. 2010a; Pradeepa et al. 2012). For the studies in OS25 cells, the following modifications were used to preserve histone acetylation levels. Cells were treated for 2 min with Sirtinol (5 μM) prior to trypsinization. Nuclei were prepared and suspended in NB-R containing sodium Butyrate (5 mM) and Sirtinol (5 μM) (Sigma Aldrich).
Chromatin was digested with 70–100 Boehringer units of MNase to obtain a chromatin ladder enriched in mono-, di-, and trinucleosomes. Beads were washed 2× with Wash Buffer 1 (25 mM Tris at pH 8, 2 mM EDTA, 150 mM NaCl, 0.05% Triton X-100 [v/v]) and 1× in Wash Buffer 2 (25 mM Tris at pH 8, 2 mM EDTA, 150 mM LiCl, 0.1% sodium deoxycholate [w/v]) and once in TE. Wash buffers were supplemented with 5 mM Sodium Butyrate, 5 μM Sirtinol, 250 mM PMSF, and complete Proteinase Inhibitors (Roche). For undifferentiated 46c ESCs and day 5 NPC cells, native ChIP was performed as above, with the exception that the sirtinol treatment prior to trypsinization was omitted, and MNase digest was performed with 15 Boehringer units of MNase/1 × 106 cells.
ChIP sequencing and analysis
ChIP-sequencing and image processing pipeline for OS25 H4K16ac was carried out at the Gene Pool sequencing facility (University of Edinburgh). For 46c H4K16ac, sequencing data was produced by The Danish National High-Throughput DNA-sequencing Center. In addition, we obtained the following publicly available data sets in SRA lite format from the Gene Expression Omnibus (www.ncbi.nlm.nih.gov/geo/): ESC H3K4me1, H3K27ac, H3K4me3, EP300, NPC H3K27ac (GSE24164) (Creyghton et al. 2010), NPC H3K4me1 (GSE11172) (Meissner et al. 2008), NPC H3K4me3 (GSE12241) (Mikkelsen et al. 2007), and ESC KAT8 (GSE37268) (Li et al. 2012). SRA-lite format files were converted to FASTQ using the SRA-toolkit fastq-dump tool, and all FASTQ files were aligned to the NCBI mm9 genome assembly using Bowtie (Langmead et al. 2009), allowing a maximum of two mismatches per read. Only sequences that mapped to one location were kept. Reads aligned for H4K16ac ChIP were, in millions; UD OS25 Input, 105; D3 Input 57; UD OS25 H4K16ac 79; D3 H4K16ac 36. UD 46c Input 142, UD 46c H4K16ac 124, NPC Input 140, NPC H4K16ac 111. Peaks were detected using SICER (Zang et al. 2009), utilizing MNase-digested ChIP input DNA as background control for H4K16ac, and input DNA for KAT8 (window size, 200 bp; fragment size, 150 bp; false discovery rate, 0.01, gap size H4K16ac, H3K4me1, 600 bp, H3K27ac, H3K4me3, 200 bp). Wiggle tracks were generated in a WCB Edinburgh Galaxy server (http://galaxy.psu.edu/) using a 200-bp window with a 20-bp step normalized to reads per million reads per base pair (RPM/bp). DNAse I hypersensitive sites were taken from the USCS Genome Browser mm9 (July 2007) assembly from the UW ENCODE group (Sabo et al. 2004).
Tag density graphs over TSS and TES were generated using custom perl scripts, and normalized to RPM. TSS and TES were downloaded from the mm9 ensembl61 build (February 2011).
Gene histone mark average profiles were generated using custom perl scripts and the coverageBed utility of the BEDTools suite, and normalized to RPM/bp. H4K16ac peak localization throughout the genome was analyzed using the CEAS suite (Shin et al. 2009).
For enhancer heatmaps, active enhancers were defined as regions with overlapping peaks (at least 50 bp) of H3K4me1 and H3K27ac (Creyghton et al. 2010), and inactive enhancers were defined as H3K4me1 peaks that did not overlap any peak of H3K27ac. The number of reads in 20 500-bp windows ±5 kb around the enhancer midpoint was determined using coverageBED, normalized to reads per million, and clustered based on the sum of windows for H4K16ac using the CreateTreeView Files in the WCB Edinburgh Galaxy server, then visualized using the Java TreeView (http://jtreeview.sourceforge.net/) using the same settings for each heatmap.
Expression analysis
RNA was extracted from UD and D3 differentiated ESCs and analyzed by RT-PCR as described previously (Eskeland et al. 2010a). Microarray data sets for UD ESC were generated using Illumina Mouse WG-6 v2.0 Expression BeadChip. RNA was labeled using the Total Prep RNA Amplification Kit (Ambion), and array hybridization and data extraction were carried out by the Edinburgh Wellcome Trust Clinical Research Facility. Probe intensities were averaged across three biological replicates. The top 500 genes with a detection P-value of <0.001 were used as a sample of active genes, while the 500 genes with the lowest intensities and a detection P-value of >0.9 were defined as a sample of inactive genes.
Differential expression between UD and D3 OS25s was analyzed using Agilent whole mouse genome 4 × 44 k oligomicroarrays. TRIzol-extracted RNA was Cy3 labeled using the Amino Allyl Message Amp II kit (Ambion), hybridized to arrays, and scanned using a NimbleGen MS200 scanner. Spot intensities were extracted using an Array-Pro Analyzer, quantile normalization, and calculation of log2 fold change, and adjusted P-values were performed in Limma (Smyth et al. 2005). Genes differentially expressed with an adjusted P-value of <0.005 were used for H4K16ac tag density analysis. For differential expression between 46c UD ESCs and day 5 NPCs, RNA was extracted using a High Pure RNA Isolation kit (Roche), Cy3 labeled as above, hybridized to an Agilent whole mouse genome 8 × 60K oligomicroarray, and scanned as above. Spot intensities were extracted using Agilent Feature Extraction software version 11.5.1.1 and the data were analyzed as above.
Western blotting
The 0.5 × 10⁶ ESC, NPC, and D3 cells were washed in ice-cold PBS, lysed in NP-40 lysis buffer at 4°C for 30 min, then boiled in SDS loading dye. Proteins were loaded onto a 4%–20% gradient polyacrylamide gel and transferred to a Hybond-P membrane (GE Healthcare). Membranes were probed with antibodies to detect α H4K16ac (1: 10000, Millpore) and αH3 (1:10000, Abcam). Blots were detected using the ChemiGlow West Chemiluminescence Substrate Kit (Protein Simple) on an Image Quant LAS4010 (Version 1, Build 1.0.0.52; GE Healthcare).
FISH and image analysis
FISH for the analysis of chromatin compaction, image analysis, and statistical evaluation of mean-squared interprobe distances were as described previously (Eskeland et al. 2010a). Details of fosmid probes used are given in Supplemental Table S1.
Luciferase reporter assay
H4K16ac +ve putative enhancer regions were PCR amplified from E14 ESC genomic DNA (primer details in Supplemental Table S2) and cloned into the pGL4.26 luciferase reporter plasmid (Promega). Sequences of all clones were verified. The plasmids were then cotransfected with pRL-TK into E14 ESCs using lipofectamine 2000 transfection reagent. Forty-eight hours after transfection, a Luciferase assay was performed using the Dual-Luciferase Reporter Assay System assay (Promega) as described by the manufacturer.
Data access
Microarray and ChIP-sequencing data for this study have been submitted to the the NCBI Gene Expression Omnibus (GEO; http://www.ncbi.nlm.nih.gov/geo/) under accession number GSE43103.
Acknowledgments
This work was supported by funding from the Medical Research Council, United Kingdom. We thank Colin Semple and James Prendergast (MRC HGU) for their advice on bioinformatics and data analysis and for critical reading of the manuscript; Graeme Grimes and Rob Illingworth (MRC HGU) for Expression Array analysis and help with performing Agilent Expression Arrays; The Wellcome Trust Clinical Research Facility for performing Illumina Mouse WG-6 v2.0 Expression BeadChip; The University of Edinburgh Gene Pool and The Danish National High-Throughput DNA-sequencing Centre facilities for deep sequencing; and Elisabeth Freyer, Shelagh Boyle, and Paul Perry (MRC HGU) for help with FACS, FISH, and image analysis, respectively.
Author contributions: G.T. conducted and analyzed the ChIP-sequencing data and did the FISH. B.H.B. did the 46C ES cell differentiation. M.M.P. carried out enhancer reporter assays. R.E., M.M.P., and W.A.B. conceived and designed the experiments. G.T., M.M.P., and W.A.B. wrote the manuscript.
Footnotes
[Supplemental material is available for this article.]
Article published online before print. Article, supplemental material, and publication date are at http://www.genome.org/cgi/doi/10.1101/gr.155028.113.
References
- Allahverdi A, Yang R, Korolev N, Fan Y, Davey CA, Liu C-F, Nordenskiöld L 2011. The effects of histone H4 tail acetylations on cation-induced chromatin folding and self-association. Nucleic Acids Res 39: 1680–1691 [DOI] [PMC free article] [PubMed] [Google Scholar]
- Antonellis A, Huynh JL, Lee-Lin SQ, Vinton RM, Renaud G, Loftus SK, Elliot G, Wolfsberg TG, Green ED, McCallion AS, et al. 2008. Identification of neural crest and glial enhancers at the mouse Sox10 locus through transgenesis in zebrafish. PLoS Genet 4: e1000174. [DOI] [PMC free article] [PubMed] [Google Scholar]
- Bone JR, Lavender J, Richman R, Palmer MJ, Turner BM, Kuroda MI 1994. Acetylated histone H4 on the male X chromosome is associated with dosage compensation in Drosophila. Genes Dev 8: 96–104 [DOI] [PubMed] [Google Scholar]
- Cai Y, Jin J, Swanson SK, Cole MD, Choi SH, Florens L, Washburn MP, Conaway JW, Conaway RC 2010. Subunit composition and substrate specificity of a MOF-containing histone acetyltransferase distinct from the male-specific lethal (MSL) complex. J Biol Chem 285: 4268–4272 [DOI] [PMC free article] [PubMed] [Google Scholar]
- Chambeyron S, Bickmore WA 2004. Chromatin decondensation and nuclear reorganization of the HoxB locus upon induction of transcription. Genes Dev 18: 1119–1130 [DOI] [PMC free article] [PubMed] [Google Scholar]
- Corona DFV, Clapier CR, Becker PB, Tamkun JW 2002. Modulation of ISWI function by site-specific histone acetylation. EMBO Rep 3: 242–247 [DOI] [PMC free article] [PubMed] [Google Scholar]
- Creyghton MP, Cheng AW, Welstead GG, Kooistra T, Carey BW, Steine EJ, Hanna J, Lodato MA, Frampton GM, Sharp PA, et al. 2010. Histone H3K27ac separates active from poised enhancers and predicts developmental state. Proc Natl Acad Sci 107: 21931–21936 [DOI] [PMC free article] [PubMed] [Google Scholar]
- Dion MF, Altschuler SJ, Wu LF, Rando OJ 2005. Genomic characterization reveals a simple histone H4 acetylation code. Proc Natl Acad Sci 102: 5501–5506 [DOI] [PMC free article] [PubMed] [Google Scholar]
- Dorigo B, Schalch T, Bystricky K, Richmond TJ 2003. Chromatin fiber folding: Requirement for the histone H4 N-terminal tail. J Mol Biol 327: 85–96 [DOI] [PubMed] [Google Scholar]
- Dorigo B, Schalch T, Kulangara A, Duda S, Schroeder RR, Richmond TJ 2004. Nucleosome arrays reveal the two-start organization of the chromatin fiber. Science 306: 1571–1573 [DOI] [PubMed] [Google Scholar]
- Dou Y, Milne TA, Tackett AJ, Smith ER, Fukuda A, Wysocka J, Allis CD, Chait BT, Hess JL, Roeder RG 2005. Physical association and coordinate function of the H3 K4 methyltransferase MLL1 and the H4 K16 acetyltransferase MOF. Cell 121: 873–885 [DOI] [PubMed] [Google Scholar]
- Eskeland R, Leeb M, Grimes GR, Kress C, Boyle S, Sproul D, Gilbert N, Fan Y, Skoultchi AI, Wutz A, et al. 2010a. Ring1B compacts chromatin structure and represses gene expression independent of histone ubiquitination. Mol Cell 38: 452–464 [DOI] [PMC free article] [PubMed] [Google Scholar]
- Eskeland R, Freyer E, Leeb M, Wutz A, Bickmore WA 2010b. Histone acetylation and the maintenance of chromatin compaction by Polycomb repressive complexes. Cold Spring Harb Symp Quant Biol 75: 71–78 [DOI] [PubMed] [Google Scholar]
- Fazzio TG, Huff JT, Panning B 2008. An RNAi screen of chromatin proteins identifies Tip60-p400 as a regulator of embryonic stem cell identity. Cell 134: 162–174 [DOI] [PMC free article] [PubMed] [Google Scholar]
- Feller C, Prestel M, Hartmann H, Straub T, Söding J, Becker PB 2011. The MOF-containing NSL complex associates globally with housekeeping genes, but activates only a defined subset. Nucleic Acids Res 40: 1509–1522 [DOI] [PMC free article] [PubMed] [Google Scholar]
- Gelbart ME, Larschan E, Peng S, Park PJ, Kuroda MI 2009. Drosophila MSL complex globally acetylates H4K16 on the male X chromosome for dosage compensation. Nat Struct Mol Biol 16: 825–832 [DOI] [PMC free article] [PubMed] [Google Scholar]
- Gupta A, Guerin-Peyrou TG, Sharma GG, Park C, Agarwal M, Ganju RK, Pandita S, Choi K, Sukumar S, Pandita RK, et al. 2008. The mammalian ortholog of Drosophila MOF that acetylates histone H4 lysine 16 is essential for embryogenesis and oncogenesis. Mol Cell Biol 28: 397–409 [DOI] [PMC free article] [PubMed] [Google Scholar]
- Heintzman ND, Stuart RK, Hon G, Fu Y, Ching CW, Hawkins RD, Barrera LO, Calcar SV, Qu C, Ching KA, et al. 2007. Distinct and predictive chromatin signatures of transcriptional promoters and enhancers in the human genome. Nat Genet 39: 311–318 [DOI] [PubMed] [Google Scholar]
- Jiang J, Chan Y-S, Loh Y-H, Cai J, Tong G-Q, Lim C-A, Robson P, Zhong S, Ng H-H 2008. A core Klf circuitry regulates self-renewal of embryonic stem cells. Nat Cell Biol 10: 353–360 [DOI] [PubMed] [Google Scholar]
- Jin Q, Yu L-R, Wang L, Zhang Z, Kasper LH, Lee J-E, Wang C, Brindle PK, Dent SYR, Ge K 2011. Distinct roles of GCN5/PCAF-mediated H3K9ac and CBP/p300-mediated H3K18/27ac in nuclear receptor transactivation. EMBO J 30: 249–262 [DOI] [PMC free article] [PubMed] [Google Scholar]
- Kind J, Vaquerizas JM, Gebhardt P, Gentzel M, Luscombe NM, Bertone P, Akhtar A 2008. Genome-wide analysis reveals MOF as a key regulator of dosage compensation and gene expression in Drosophila. Cell 133: 813–828 [DOI] [PubMed] [Google Scholar]
- Krebs AR, Karmodiya K, Lindahl-Allen M, Struhl K, Tora L 2011. SAGA and ATAC histone acetyl transferase complexes regulate distinct sets of genes and ATAC defines a class of p300-independent enhancers. Mol Cell 44: 410–423 [DOI] [PMC free article] [PubMed] [Google Scholar]
- Lam KC, Mühlpfordt F, Vaquerizas JM, Raja SJ, Holz H, Luscombe NM, Manke T, Akhtar A 2012. The NSL complex regulates housekeeping genes in Drosophila. PLoS Genet 8: e1002736. [DOI] [PMC free article] [PubMed] [Google Scholar]
- Langmead B, Trapnell C, Pop M, Salzberg SL 2009. Ultrafast and memory-efficient alignment of short DNA sequences to the human genome. Genome Biol 10: R25. [DOI] [PMC free article] [PubMed] [Google Scholar]
- Larschan E, Bishop EP, Kharchenko PV, Core LJ, Lis JT, Park PJ, Kuroda MI 2011. X chromosome dosage compensation via enhanced transcriptional elongation in Drosophila. Nature 471: 115–118 [DOI] [PMC free article] [PubMed] [Google Scholar]
- Li X, Li L, Pandey R, Byun JS, Gardner K, Qin Z, Dou Y 2012. The histone acetyltransferase MOF is a key regulator of the embryonic stem cell core transcriptional network. Cell Stem Cell 11: 163–178 [DOI] [PMC free article] [PubMed] [Google Scholar]
- Liber D, Domaschenz R, Holmqvist P-H, Mazzarella L, Georgiou A, Leleu M, Fisher AG, Labosky PA, Dillon N 2010. Epigenetic priming of a pre-B cell-specific enhancer through binding of Sox2 and Foxd3 at the ESC stage. Cell Stem Cell 7: 114–126 [DOI] [PubMed] [Google Scholar]
- Lin W, Srajer G, Evrard YA, Phan HM, Furuta Y, Dent SYR 2007. Developmental potential of Gcn5−/− embryonic stem cells in vivo and in vitro. Dev Dyn 236: 1547–1557 [DOI] [PubMed] [Google Scholar]
- Liu Y, Lu C, Yang Y, Fan Y, Yang R, Liu C-F, Korolev N, Nordenskold L 2011. Influence of histone tails and H4 tail acetylations on nucleosome-nucleosome interactions. J Mol Biol 414: 749–764 [DOI] [PubMed] [Google Scholar]
- Mann RK, Grunstein M 1992. Histone H3 N-terminal mutations allow hyperactivation of the yeast GAL1 gene in vivo. EMBO J 11: 3297–3306 [DOI] [PMC free article] [PubMed] [Google Scholar]
- Meissner A, Mikkelsen TS, Gu H, Wernig M, Hanna J, Sivachenko A, Zhang X, Bernstein BE, Nusbaum C, Jaffe DB, et al. 2008. Genome-scale DNA methylation maps of pluripotent and differentiated cells. Nature 454: 766–770 [DOI] [PMC free article] [PubMed] [Google Scholar]
- Mikkelsen TS, Ku M, Jaffe DB, Issac B, Lieberman E, Giannoukos G, Alvarez P, Brockman W, Kim TK, Koche RP, et al. 2007. Genome-wide maps of chromatin state in pluripotent and lineage-committed cells. Nature 448: 553–560 [DOI] [PMC free article] [PubMed] [Google Scholar]
- Millar CB, Kurdistani SK, Grunstein M 2004. Acetylation of yeast histone H4 lysine 16: A switch for protein interactions in heterochromatin and euchromatin. Cold Spring Harb Symp Quant Biol 69: 193–200 [DOI] [PubMed] [Google Scholar]
- Morey C, Da Silva NR, Perry P, Bickmore WA 2007. Nuclear reorganisation and chromatin decondensation are conserved, but distinct, mechanisms linked to Hox gene activation. Development 134: 909–919 [DOI] [PubMed] [Google Scholar]
- Nakano T, Windrem M, Zappavigna V, Goldman SA 2005. Identification of a conserved 125 base-pair Hb9 enhancer that specifies gene expression to spinal motor neurons. Dev Biol 283: 474–485 [DOI] [PubMed] [Google Scholar]
- Peterson CL, Laniel M-A 2004. Histones and histone modifications. Curr Biol 14: R546–R551 [DOI] [PubMed] [Google Scholar]
- Pollard SM, Benchoua A, Lowell S 2006. Neural stem cells, neurons, and glia. Methods Enzymol 418: 151–169 [DOI] [PubMed] [Google Scholar]
- Pradeepa MM, Sutherland HG, Ule J, Grimes GR, Bickmore WA 2012. Psip1/Ledgf p52 binds methylated histone H3K36 and splicing factors and contributes to the regulation of alternative splicing. PLoS Genet 8: e1002717. [DOI] [PMC free article] [PubMed] [Google Scholar]
- Prestel M, Feller C, Straub T, Mitlöhner H, Becker PB 2010. The activation potential of MOF is constrained for dosage compensation. Mol Cell 38: 815–826 [DOI] [PubMed] [Google Scholar]
- Rada-Iglesias A, Bajpai R, Swigut T, Brugmann SA, Flynn RA, Wysocka J 2011. A unique chromatin signature uncovers early developmental enhancers in humans. Nature 470: 279–283 [DOI] [PMC free article] [PubMed] [Google Scholar]
- Raja SJ, Charapitsa I, Conrad T, Vaquerizas JM, Gebhardt P, Holz H, Kadlec J, Fraterman S, Luscombe NM, Akhtar A 2010. The nonspecific lethal complex is a transcriptional regulator in Drosophila. Mol Cell 38: 827–841 [DOI] [PubMed] [Google Scholar]
- Robinson PJJ, An W, Routh A, Martino F, Chapman L, Roeder RG, Rhodes D 2008. 30 nm chromatin fibre decompaction requires both H4-K16 acetylation and linker histone eviction. J Mol Biol 381: 816–825 [DOI] [PMC free article] [PubMed] [Google Scholar]
- Roh T-Y, Cuddapah S, Zhao K 2005. Active chromatin domains are defined by acetylation islands revealed by genome-wide mapping. Genes Dev 19: 542–552 [DOI] [PMC free article] [PubMed] [Google Scholar]
- Sabo PJ, Humbert R, Hawrylycz M, Wallace JC, Dorschner MO, McArthur M, Stamatoyannopoulos JA 2004. Genome-wide identification of DNaseI hypersensitive sites using active chromatin sequence libraries. Proc Natl Acad Sci 101: 4537–4542 [DOI] [PMC free article] [PubMed] [Google Scholar]
- Shen Y, Yue F, McCleary DF, Ye Z, Edsall L, Kuan S, Wagner U, Dixon J, Lee L, Lobanekov VV, et al. 2012. A map of the cis-regulatory sequences in the mouse genome. Nature 488: 116–120 [DOI] [PMC free article] [PubMed] [Google Scholar]
- Shin H, Liu T, Manrai AK, Liu XS 2009. CEAS: cis-regulatory element annotation system. Bioinformatics 25: 2605–2606 [DOI] [PubMed] [Google Scholar]
- Shogren-Knaak M, Ishii H, Sun J-M, Pazin MJ, Davie JR, Peterson CL 2006. Histone H4-K16 acetylation controls chromatin structure and protein interactions. Science 311: 844–847 [DOI] [PubMed] [Google Scholar]
- Smith ER, Cayrou C, Huang R, Lane WS, Côté J, Lucchesi JC 2005. A human protein complex homologous to the Drosophila MSL complex is responsible for the majority of histone H4 acetylation at lysine 16. Mol Cell Biol 25: 9175–9188 [DOI] [PMC free article] [PubMed] [Google Scholar]
- Smyth GK, Michaud J, Scott HS 2005. Use of within-array replicate spots for assessing differential expression in microarray experiments. Bioinformatics 21: 2067–2075 [DOI] [PubMed] [Google Scholar]
- Szutorisz H, Canzonetta C, Georgiou A, Chow C-M, Tora L, Dillon N 2005. Formation of an active tissue-specific chromatin domain initiated by epigenetic marking at the embryonic stem cell stage. Mol Cell Biol 25: 1804–1820 [DOI] [PMC free article] [PubMed] [Google Scholar]
- Taipale M, Rea S, Richter K, Vilar A, Lichter P, Imhof A, Akhtar A 2005. hMOF histone acetyltransferase is required for histone H4 lysine 16 acetylation in mammalian cells. Mol Cell Biol 25: 6798–6810 [DOI] [PMC free article] [PubMed] [Google Scholar]
- Thomas T, Dixon MP, Kueh AJ, Voss AK 2008. Mof (MYST1 or KAT8) is essential for progression of embryonic development past the blastocyst stage and required for normal chromatin architecture. Mol Cell Biol 28: 5093–5105 [DOI] [PMC free article] [PubMed] [Google Scholar]
- Tropberger P, Pott S, Keller C, Kamieniarz-Gdula K, Caron M, Richter F, Li G, Mittler G, Liu ET, Bühler M, et al. 2013. Regulation of transcription through acetylation of H3K122 on the lateral surface of the histone octamer. Cell 152: 859–872 [DOI] [PubMed] [Google Scholar]
- Wang Z, Zang C, Rosenfeld JA, Schones DE, Barski A, Cuddapah S, Cui K, Roh T-Y, Peng W, Zhang MQ, et al. 2008. Combinatorial patterns of histone acetylations and methylations in the human genome. Nat Genet 40: 897–903 [DOI] [PMC free article] [PubMed] [Google Scholar]
- Wang Z, Zang C, Cui K, Schones DE, Barski A, Peng W, Zhao K 2009. Genome-wide mapping of HATs and HDACs reveals distinct functions in active and inactive genes. Cell 138: 1019–1031 [DOI] [PMC free article] [PubMed] [Google Scholar]
- Wu L, Zee BM, Wang Y, Garcia BA, Dou Y 2011. The RING finger protein MSL2 in the MOF complex is an E3 ubiquitin ligase for H2B K34 and is involved in crosstalk with H3 K4 and K79 methylation. Mol Cell 43: 132–144 [DOI] [PMC free article] [PubMed] [Google Scholar]
- Wysocka J, Swigut T, Milne TA, Dou Y, Zhang X, Burlingame AL, Roeser RG, Brivanlou AH, Allis CD 2005. WDR5 associates with histone H3 methylated at K4 and is essential for H3 K4 methylation and vertebrate development. Cell 121: 859–872 [DOI] [PubMed] [Google Scholar]
- Ying Q, Stavridis M, Grifftihs D, Li A, Smith A 2003. Conversion of embryonic stem cells into neuroextodermal precursors in adherent monoculture. Nat Biotechnol 21: 183–186 [DOI] [PubMed] [Google Scholar]
- Zang C, Schones DE, Zeng C, Cui K, Zhao K, Peng W 2009. A clustering approach for identification of enriched domains from histone modification ChIP-Seq data. Bioinformatics 25: 1952–1958 [DOI] [PMC free article] [PubMed] [Google Scholar]
- Zhong X, Jin Y 2009. Critical roles of coactivator p300 in mouse embryonic stem cell differentiation and Nanog expression. J Biol Chem 284: 9168–9175 [DOI] [PMC free article] [PubMed] [Google Scholar]