

Abstract
We quantified DNA adducts resulting from 2’-hydroxylation of enantiomers of the tobacco-specific nitrosamine N’-nitrosonornicotine (NNN) in tissues of male F-344 rats after 10, 30, 50, and 70 weeks of treatment with 14 ppm in the drinking water. These rats were in subgroups of a carcinogenicity study in which (S)-NNN was highly tumorigenic in the oral cavity and esophagus while (R)-NNN was relatively weakly active. DNA adducts were quantified by liquid chromatography-electrospray ionization-tandem mass spectrometry in six tissues – oral mucosa, esophageal mucosa, nasal respiratory mucosa, nasal olfactory mucosa, liver, and lung. O2-[4-(3-Pyridyl)-4-oxobut-1-yl]thymidine (O2-POB-dThd, 7) and 7-[4-(3-pyridyl)-4-oxobut-1-yl]-2′-deoxyguanosine (7-POB-dGuo, 8), the latter as 7-[4-(3-pyridyl)-4-oxobut-1-yl]guanine (7-POB-Gua, 11), were detected at each time point in each tissue. In the target tissues for carcinogenicity, oral mucosa and esophageal mucosa, levels of 7-POB-Gua (11) and O2-POB-dThd (7) were similar, or 11 predominated, while in all other tissues at all time points for both enantiomers, 7 was clearly present in greater amounts than 11. Total measured DNA adduct levels in esophageal mucosa and oral mucosa were higher in rats treated with (S)-NNN than (R)-NNN. The highest adduct levels were found in the nasal respiratory mucosa. DNA adducts generally persisted in all tissues without any sign of substantial decreases throughout the 70 week time course. The results of this study suggest that inefficient repair of 7-POB-dGuo (8) in the rat oral cavity and esophagus may be important in carcinogenesis by NNN and support the development of these DNA adducts as potential biomarkers of NNN metabolic activation in people who use tobacco products.
Keywords: (S)-N’-nitrosonornicotine, (R)-N’-nitrosonornicotine, DNA adducts, carcinogenicity study
Introduction
The carcinogen N’-nitrosonornicotine (NNN) is present in all tobacco products.1,2 The major form is (S)-NNN (Figure 1), comprising an average of 63%.3 Levels of NNN in most tobacco products remain relatively high: 1 – 10 μg/g in common brands of smokeless tobacco,4,5 1 - 4 μg/g in cigarette tobacco,6 and an average of 127 – 154 ng/cigarette in mainstream cigarette smoke.6 In a recent study, we demonstrated the powerful carcinogenicity of orally administered (S)-NNN (1, Figure 1) in the rat oral cavity and esophagus, while (R)-NNN (2) was weakly active but nevertheless potentiated the activity of (S)-NNN.7 These results, which are particularly pertinent to the use of smokeless tobacco products, added significantly to the already large body of evidence demonstrating the carcinogenicity of racemic NNN in the rat esophagus and nasal cavity, and hamster and mouse respiratory tract.8 In view of these facts and related mechanistic data, the International Agency for Research on Cancer has classified NNN and the related tobacco-specific nitrosamine 4-(methylnitrosamino)-1-(3-pyridyl)-1-butanone (NNK), which always occur together in tobacco products, as “carcinogenic to humans” (Group 1).2,9
Figure 1.
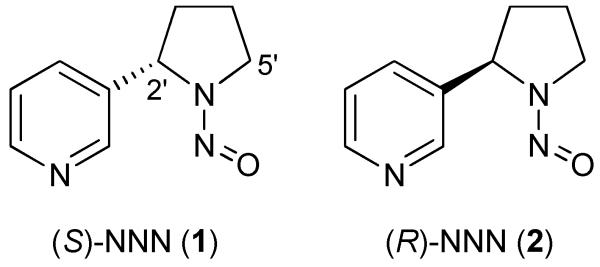
Structures of (S)-NNN (1) and (R)-NNN (2)
NNN requires metabolic activation to exert its carcinogenic effects.8 Cytochrome P450s catalyze the 2′- and 5′-hydroxylation of NNN, leading to the formation of reactive electrophiles, such as 5 and 6 (Scheme 1), both of which react with DNA to produce well characterized adducts.10-14 Various studies indicate that 2′-hydroxylation is important in NNN carcinogenicity in rats, while less is known about the role of 5′-hydroxylation.8 DNA adducts resulting from 2′-hydroxylation, but not 5′-hydroxylation, have been quantified to date in laboratory animals, and these 2′-hydroxylation adducts, illustrated in Figure 2, are the focus of this study. They include O2-[4-(3-pyridyl)-4-oxobut-1-yl]thymidine (O2-POB-dThd, 7), 7-[4-(3-pyridyl)-4-oxobut-1-yl]-2′-deoxyguanosine (7-POB-dGuo, 8), O6-[4-(3-pyridyl)-4-oxobut-1-yl]-2′-deoxyguanosine (O6-POB-dGuo, 9), and O2-[4-(3-pyridyl)-4-oxobut-1-yl]-2′-deoxycytidine (O2-POB-dCyd, 10). Neutral thermal hydrolysis of unstable adducts 8 and 10 produces the stable adducts, 7-[4-(3-pyridyl)-4-oxobut-1-yl]guanine (7-POB-Gua, 11) and O2-[4-(3-pyridyl)-4-oxobut-1-yl]cytosine (O2-POB-Cyt, 12).11 In previous studies, we quantified 7, 9, 11, and 12 in tissues of F344 rats treated with 10 ppm of (S)-NNN or (R)-NNN in the drinking water for 20 weeks.11 The results of those studies, while providing the impetus for the carcinogenicity study of NNN enantiomers, also demonstrated some variability in DNA adduct formation with time, including decreases in some adducts during treatment. This could have been due to experimental variation, to induction of DNA repair pathways, or to other mechanisms. It is crucial to know whether specific DNA adducts persist through treatment when evaluating their possible role as mechanistic factors or biomarkers of cancer susceptibility.
Scheme 1.

Figure 2.

Structures of the POB-DNA adducts discussed in this study.
Relatively few studies in the literature have investigated DNA adduct formation in laboratory animals treated chronically with carcinogens for more than one month. Beland et al monitored DNA adduct persistence in rat liver and kidney after multiple doses of N-hydroxy-2-acetylaminofluorene.15 Gupta et al. and Poirier et al. investigated DNA adducts in tissues of rats during chronic treatment with 2-acetylaminofluorene.16,17 Herron and Shank measured adduct persistence during a carcinogenicity study of 1,2-dimethylhydrazine.18 The Swenberg group carried out multiple studies on the molecular dosimetry of DNA adducts during continuous exposure of rats to diethylnitrosamine.19 Buss et al investigated aflatoxin-DNA adducts in rats treated chronically.20 Yamashita and co-workers studied DNA adduct formation and persistence in rats treated with 2-amino-3,8-dimethylimidazo[4,5-f]quinoxaline.21 Zaidi et al. studied DNA adduct levels in rats treated with N-methyl-N’-nitro-N-nitrosoguanidine.22 Talaska et al. investigated DNA adducts during multiple treatments of mice with benzo[a]pyrene.23 Doerge and co-workers examined DNA adduct levels during administration of acrylamide to rats and mice.22 Yu et al. investigated formation of N2-ethylidene-dGuo in mice treated chronically with ethanol.24 In most of these studies, specific DNA adducts accumulated to differing extents and remained constant during treatment but in some cases were removed by active repair systems depending on tissue and cell type, or decreased during treatment due to a number of factors that occur during the multi-step process of tumorigenesis possibly including the development of preneoplastic cells with different metabolic or DNA repair capacity, varied tissue architecture, or dilution of adduct levels by cell proliferation. Our group has monitored DNA adduct formation from NNK or NNN in experiments lasting up to 20 weeks. Depending on the compound administered and the tissue and adduct examined, levels either reached a steady state or decreased after reaching their maximum, the latter occurring most commonly between 10 and 20 weeks of treatment.11,12,25-30
In order to further evaluate DNA adduct levels and persistence in rats treated with NNN enantiomers, we monitored DNA adduct levels from 2′-hydroxylation of NNN over 70 weeks of the carcinogenicity study of the NNN enantiomers mentioned above, using liquid chromatography-electrospray ionization-tandem mass spectrometry (LC-ESI-MS/MS). The results would provide definitive data relating levels of these DNA adducts to time of treatment.
Materials and methods
Caution
(R)-NNN and (S)-NNN are carcinogenic. They should be handled in a well-ventilated hood with extreme care and appropriate protective equipment.
Chemicals
(R)-NNN, (S)-NNN, and POB-DNA adduct standards and internal standards were synthesized.31 Puregene DNA purification solutions were obtained from Qiagen (Valencia, CA). Calf thymus DNA and micrococcal nuclease (from Staphylococcus aureus) were purchased from Worthington Biochemical Co. (Lakewood, NJ). Phosphodiesterase II (from bovine spleen) was obtained from Sigma-Aldrich Chemical Co. (Milwaukee, WI). Alkaline phosphatase (from calf intestine) was procured from Roche Diagnostics Corp. (Indianapolis, IN). All other chemicals and solvents were acquired from Sigma-Aldrich or Fisher Scientific (Fairlawn, NJ).
Animal Experiment
This study was approved by the University of Minnesota Animal Care and Use Committee. Seventy-two male F-344 rats, age 6 weeks, were obtained from Charles River Laboratories (Kingston, NY), housed 2 per cage with Harlan irradiated corncob bedding (Harlan, Indianapolis IN), and allowed to acclimate to the Research Animal Resources facility, University of Minnesota, for one week. They were randomly divided into three groups of 24 rats: (1) control; (2) (R)-NNN; and (3) (S)-NNN; and maintained under standard conditions (20-24 °C temperature, 29-32% relative humidity and 14/10 light/dark cycle). They were fed Harlan Teklad 2018 diet for the first 8 months of the study and then switched to Harlan Teklad 7022 diet (NIH-07) for the rest of the study; the compositions of these diets are virtually identical. The rats in the treatment groups received 14 ppm of the appropriate carcinogen in their drinking water while the control rats were given tap water. Preparation of the drinking water solutions and monitoring of their NNN enantiomer concentrations were performed during the study as described previously. 7 Six rats per group were humanely sacrificed by CO2 overdose at 10, 30, 50 and 70 weeks. Tissues were harvested and stored at −80 °C until DNA isolation.
Isolation of nasal olfactory and respiratory mucosa
This was performed as previously described.11,28,32 After the rats were euthanized, the mandibula of the head was removed. The head was placed on the necropsy board with the palate facing up and was split using a bone mallet and a scalpel, cutting longitudinally on the median line, through the hard palate. The respiratory mucosa was retrieved from the naso- and maxillo-turbinates, the lateral walls of the nasal passages, and the median septum anterior to the olfactory area. The olfactory mucosa was obtained from the ethmoturbinates and the lateral wall and septum of the olfactory area. The tissues were stored at −80 °C until DNA isolation.
Other tissues
The oral cavity mucosa was retrieved from each side of the oral cavity and the surface layer of tongue. The esophagus was cut open lengthwise, and the mucosa was harvested. Liver and lung were harvested from each rat. The tissues were stored at −80 °C until DNA isolation.
Quantitation of POB-DNA Adducts by LC-ESI-MS/MS
This was performed as previously described,33 with some modifications. Total tissue DNA was isolated following the modified Puregene DNA isolation protocol (Qiagen).34 Liver and lung DNA were isolated from 3 rats at each time point. Esophagi from 6 rats in each group were divided into 2 pools of 3 rats each for DNA isolation. Nasal olfactory, nasal respiratory, and oral mucosa from 4 rats in each group were divided into 2 pools of 2 rats each for DNA isolation. The number of rats and pool sizes for each determination were based on the availability of tissue for DNA isolation and the need to save certain tissues for other studies. Depending on the starting amount of tissue, the reagents were scaled accordingly. DNA was hydrolyzed as described previously.33 Briefly, 0.1-2 mg of each DNA sample was dissolved in sodium succinate 10 mM buffer, four deuterated internal standards of POB-DNA adducts were added11 and the solution was subjected to neutral thermal hydrolysis (100 °C, 30 min), followed by enzymatic hydrolysis with micrococcal nuclease, phosphodiesterase II, and alkaline phosphatase. A 20 μL aliquot was removed for dGuo quantitation. The remaining hydrolysate was purified by solid-phase extraction [Strata-X cartridge, 33 μm, 30 mg/mL, (Phenomenex, Torrance, CA)]. The samples were loaded on the cartridge and washed with 2 mL of H2O and 1 mL of 10% CH3OH in H2O, and then eluted with 2 mL of CH3OH. The eluted fractions were evaporated to dryness, then redissolved in 20 μL H2O. An 8 μL aliquot was analyzed by LC-ESI-MS/MS-selected reaction monitoring (SRM) for POB-DNA adducts, essentially as described previously.11 The LC separation was achieved using a Dionex UltiMate 3000 capillary HPLC system (Thermo Scientific, West Palm Beach, FL) equipped with a Zorbax SB-C18 150 × 0.5 mm 5 μm column (Agilent Technologies, Santa Clara, CA) coupled to a TSQ Vantage triple quadrupole mass spectrometer (Thermo Scientific, West Palm Beach, FL). The ESI source was operated in the positive mode. POB-DNA adducts and corresponding internal standards were detected by monitoring the formation of the POB ion from the parent ion. The ion transitions are listed in Table 1. Content of dGuo was determined by HPLC.11 The amount of DNA was calculated from dGuo content by considering that 1 mg of DNA contains 3 μmol of nucleotides35 and dGuo accounts for 22% of the total nucleotides in rat DNA. Adduct levels were expressed as fmol adduct/mg DNA. A buffer control with no DNA and a calf thymus DNA sample were prepared for each set of samples and processed as negative controls following the same procedure.
Table 1.
Ion transitions for the selected reaction monitoring of POB-DNA adducts and internal standards
| Ion transitions |
|||
|---|---|---|---|
| Adduct | Parent ion ([M + 1]+, m/z) |
Daughter ion (m/z) |
|
| 02-P0B-Cyt (12) | 259.1 | 148.1 | [POB]+ |
| [pyridine-D4]02-P0B-Cyt | 263.1 | 152.1 | ([pyridine-D4]POB])+ |
| 7-POB-Gua (11) | 299.1 | 148.1 | [POB]+ |
| [pyridine-D4]7-POB-Gua | 303.1 | 152.1 | ([pyridine-D4]POB])+ and [Gua+H]+ |
| 02-P0B-dThd (7) | 390.1 | 148.1 | [POB]+ |
| [pyridine-D4]02-P0B-dThd | 394.1 | 152.1 | ([pyridine-D4]POB])+ |
| O6-POB-dGuo (9) | 415.1 | 148.1 | [POB]+ |
| [pyridine-D4]O6-POB-dGuo | 419.1 | 152.1 | ([pyridine-D4]POB])+ and [Gua+H]+ |
Liquid chromatography-nanoelectrospray-high resolution tandem mass spectrometry (LC-NSI-HRMS/MS) analysis of O6-POB-dGuo
Separation was performed on a Nano2D-LC HPLC (Eksigent, Dublin, CA) system equipped with a 5 μL injection loop. One μL of sample was injected onto a capillary column (75 μm ID, 10 cm length, 15 μm orifice) created by hand packing a commercially available fused-silica emitter (New Objective, Woburn MA) with Luna C18 bonded separation media (Phenomenex, Torrance, CA). MS analysis was performed using a LTQ Orbitrap Velos (Thermo Scientific, Waltham, MA).
The flow rate was set at 1000 nL/min for the first 5 min with elution by 2 % CH3CN in 5mM NH4OAc buffer. The flow rate was then decreased to 300 nL/min and a 25 min linear gradient of 2 to 30 % CH3CN was used. The column was then washed with 98% CH3CN for 4 min and subsequently re-equilibrated for 15 min at 2% CH3CN, bringing back the flow rate to the initial conditions. The transitions monitored were m/z 415.2 [M + H]+ → m/z 299.1251 [M + H - 116]+ for O6-POB-dGuo and m/z 419.2 [M + H]+ → m/z 303.1502 [M + H - 116]+ for [pyridine-D4]O6-POB-dGuo. Fragmentation was performed in the CID cell with an isolation width of 3, activation Q of 0.15 and activation time of 30 msec.
Statistical analyses
Statistical analysis was carried out using Stata software (College Station, TX). Comparisons of adduct levels were performed with the t-test for single comparisons from unique data sets at each time point. Those analyses necessitating several comparisons required adjustment for multiple comparisons. To accomplish this, analysis of variance (ANOVA) was employed. Bonferroni correction post-ANOVA was used to produce corrected p-values. Alpha was set to 0.05 to determine statistical significance.
Results
The rats in this study were subgroups of those in the carcinogenicity study of (S)-NNN) and (R)-NNN and were housed and treated under identical conditions as in that study.7 Based on measured water consumption, average calculated total doses of the carcinogens were 18 mg (77 mg/kg), 49 mg (147 mg/kg), 86 mg (230 mg/kg), and 123 mg (313 mg/kg) at 10, 30, 50, and 70 weeks, respectively. The (S)-NNN-treated rats began losing weight after one year and had died or were humanely euthanized by 74 weeks. Controls and (R)-NNN treated rats were terminated at 86 weeks. POB-DNA adducts were quantified in six tissues: oral mucosa, esophageal mucosa, nasal respiratory mucosa, nasal olfactory mucosa, liver, and lung.
Oral mucosa
POB-DNA adducts were detected in DNA from rats treated with either (S)-NNN or (R)-NNN (Figure 3A-C). Peaks corresponding to the retention times of O2-POB-dThd and 7-POB-Gua and coeluting with the corresponding internal standards were observed. Total adduct levels from (S)- and (R)-NNN treatments showed a slightly increasing trend over the period of treatment, and reached a maximum at 70 weeks with 920 fmol/mg DNA for (S)-NNN and 329 fmol/mg DNA for (R)-NNN (Figure 4A). Total adduct levels in the (S)-NNN group were 2 to 4 times higher than those in the (R)-NNN group throughout the experiment, and this difference was significant (P<0.05) at 10, 30, and 50 weeks (Figure 4A; Table 3A, Supporting Information). At each time point, levels of each adduct were higher in rats treated with (S)-NNN than in those treated with (R)-NNN (Figure 5A,B; Tables 1A-3A, Supporting Information). Levels of 7-POB-Gua were slightly higher than O2-POB-dThd in the (R)-NNN treated animals, while the opposite was observed in the (S)-NNN treated rats, but these differences were not significant, except at 10 and 30 weeks in the rats treated with (R)-NNN (Figure 5A,B; Table 4A, Supporting Information). Overall, O2-POB-dThd accounted for 41-48% of the total adducts detected in the (R)-NNN group and 54-58% in the (S)-NNN group. Levels of O2-POB-Cyt and O6-POB-dGuo were below the limit of detection.
Figure 3.

Typical SRM chromatograms obtained upon analysis of oral mucosa DNA isolated from (A) control rats; (B) (R)-NNN-treated rats; and (C) (S)-NNN-treated rats after 70 weeks of treatment. Individual POB-DNA adducts or internal standards were monitored as indicated on each channel.
Figure 4.

Plots of total adduct levels (fmol/mg of DNA) vs time (weeks) in (A) oral mucosa, (B) esophageal mucosa, (C) nasal respiratory mucosa, (D) nasal olfactory mucosa, (E) liver, and (F) lung DNA from (R)- and (S)-NNN-treated rats. Values of the total adduct levels are the sum of the amounts of all POB-DNA adducts measured in oral, esophageal, nasal respiratory, nasal olfactory, liver and lung DNA at each time point ± S. D. Symbol designations are ■, total adduct levels from (R)-NNN treatment and □, total adduct levels from (S)-NNN treatment. All differences were statistically significant (P<0.05) except oral mucosa, 70 weeks (P = 0.07); esophageal mucosa, 70 weeks (P = 0.06), and nasal respiratory mucosa, 50 weeks (P = 0.06); see Table 3, Supporting Information.
Figure 5.

Levels of each POB-DNA adduct in the (A) oral mucosa of (R)-NNN-treated rats, (B) oral mucosa of (S)-NNN-treated rats, (C) esophageal mucosa of (R)-NNN-treated rats, (D) esophageal mucosa of (S)-NNN-treated rats, (E) nasal respiratory mucosa of (R)-NNN-treated rats, (F) nasal respiratory mucosa of (S)-NNN-treated rats, (G) nasal olfactory mucosa of (R)-NNN-treated rats, (H) nasal olfactory mucosa of (S)-NNN-treated rats, (I) liver of (R)-NNN-treated rats, (J) liver of (S)-NNN-treated rats, (K) lung of (R)-NNN-treated rats, and (L) lung of (S)-NNN-treated rats. Adduct levels are shown in sequence at each time point, as follows: open bars 7-POB-Gua; striped bars O2-POB-dThd. All differences between levels of 7-POB-Gua and O2-POB-dThd were significant (P<0.05) in panels E-L. The only significant differences in the other panels were in panel A, 10 and 30 weeks, and panel C, 10 weeks. See Table 4, Supporting Information.
Esophageal mucosa
Similar to the results obtained in oral mucosa DNA, O2-POB-dThd and 7-POB-Gua were detected in esophageal mucosa DNA from (R)-NNN- and (S)-NNN-treated rats. Neither O2-POB-Cyt nor O6-POB-dGuo was observed. Total POB-DNA adduct formation was 2 to 5 times greater in the rats treated with (S)-NNN than in those given (R)-NNN and these differences were significant (P<0.05) at 10, 30, and 50 weeks (Figure 4B; Table 3B, Supporting Information). The total adduct levels in the esophageal mucosa from (S)- and (R)-NNN treatments were relatively stable over the period of treatment, except for an increase observed at 70 weeks in the (S)-NNN group (Figure 4B). The maximum level of POB-DNA adducts was 3655 fmol/mg DNA for the (S)-NNN group, observed at 70 weeks, and 948 fmol/mg DNA for the (R)-NNN group, observed at 50 weeks. The levels of individual adducts were 2 to 8 times higher in (S)-NNN treated rats compared to those treated with (R)-NNN (Figures 5C, D; Tables 1B – 3B, Supporting Information). 7-POB-Gua was the major adduct, accounting for 69-81% of the total adduct levels in the (R)-NNN group and 54-63% in the (S)-NNN group. Levels of POB-DNA adducts in esophageal DNA were 3 to 4 times higher than those in oral DNA for the (S)-NNN group, and 2 to 5 times higher for the (R)-NNN group, and these differences were significant (P<0.03) at each time point except in the (R)-NNN – treated rats at weeks 50 and 70 (Table 5, Supporting Information).
Nasal respiratory mucosa
O2-POB-dThd and 7-POB-Gua were observed in nasal respiratory mucosa DNA from the treated groups. Similar to the results found for the oral and esophageal mucosa DNA, total adduct levels in nasal respiratory mucosa DNA of the (S)-NNN treated group were 1.5 to 2 times higher than those of the (R)-NNN treated group, and these differences were significant (P<0.05) at 10, 30, and 70 weeks (Figure 4C; Table 3B, Supporting Information). Total adduct levels in nasal respiratory mucosa DNA from (S)- and (R)-NNN-treated rats were stable throughout the time course. The maximum level of POB-DNA adducts was 8083 fmol/mg DNA for the (S)-NNN group, observed at 70 weeks, and 4064 fmol/mg DNA for the (R)-NNN group, observed at 30 weeks (Figure 4C). Total levels of POB-DNA adducts in nasal respiratory mucosa DNA at each time-point were 2 to 6 times higher than those in esophageal mucosa DNA, and 8 to 19 times higher than those in oral mucosa DNA, and these differences were highly significant at each time point (P = 0, Table 5, Supporting Information). Levels of individual POB-DNA adducts in respiratory mucosa DNA are summarized in Figure 5E, F (also see Tables 1C – 3C, Supporting Information). Unlike oral and esophageal mucosa DNA samples, O2-POB-dThd levels were much higher than those of 7-POB-Gua at each time point in nasal respiratory tissue DNA from the treated rats, and these differences were significant (P<0.05, Figure 5E,F; Table 4, Supporting Information). O2-POB-dThd accounted for 77-81% of total quantified adducts in the (R)-NNN group and 81-86% in the (S)-NNN group. O2-POB-Cyt was not observed.
Nasal olfactory mucosa
Similar to the other tissues from the treated animals, O2-POB-dThd and 7-POB-Gua were observed in olfactory mucosa DNA from the treated groups. As shown in Figure 4D, total adduct levels in the olfactory mucosa were relatively stable and showed a slightly increasing trend during the period of treatment for both (R)-NNN and (S)-NNN treated groups. Total adduct levels reached a maximum at 70 weeks with 2163 fmol/mg DNA for (R)-NNN and 715 fmol/mg DNA for (S)-NNN. In contrast to the results obtained for the oral, esophageal and respiratory mucosa DNA samples, total POB-DNA adducts in the olfactory mucosa of the rats treated with (R)-NNN were 3 to 4 times higher than in the (S)-NNN-treated rats, and these differences were significant at each time point (P<0.05, Table 3, Supporting Information). For each POB-DNA adduct, levels were 2 to 5 times higher in the (R)-NNN-treated rats than in those given (S)-NNN, and these differences were significant at most time points up to 70 weeks (P<0.05, Figure 4D; Table 3D, Supporting Information). As summarized in Figure 5G, H (also see Tables 1D, 2D, and 4D, Supporting Information), O2-POB-dThd was the predominant adduct in nasal olfactory mucosa DNA as was observed in respiratory mucosa DNA, and accounted for 80-83% of the total adducts in the rats treated with (R)-NNN and for 77-81% in the (S)-NNN treated group.
Liver
Total adduct levels measured in liver, which were the sum of amounts of O2-POB-dThd and 7-POB-Gua, were relatively stable throughout the 70 weeks’ treatment for both the (R)-NNN and the (S)-NNN groups (Figure 4E). The maximum adduct level was 728 fmol/mg DNA for the (S)-NNN group, and 121 fmol/mg DNA for the (R)-NNN group, both observed at 10 weeks. Similar to observations in the oral, esophagus and nasal respiratory mucosa, (S)-NNN treatment produced 5 to 8 times higher total POB-DNA adduct levels than (R)-NNN, and these differences were significant at each time point (P<0.001, Table 3, Supporting Information). For each POB-DNA adduct, levels were 4 to 9 times higher in the (S)-NNN-treated rats than in those given (R)-NNN, and these differences were significant at each time point (Figure 5I, J; Tables 1E – 3E, Supporting Information). O2-POB-dThd was the predominant adduct in liver DNA, accounting for 68-78% of the total adducts in the rats treated with (R)-NNN and 69-81% in the (S)-NNN group. Its levels were significantly higher than those of 7-POB-dGua at each time point (P<0.002, Table 4, Supporting Information).
Lung
O2-POB-dThd and 7-POB-Gua were detected in lung DNA from the treated groups. Similar to the nasal olfactory mucosa, total POB-DNA adduct levels were 2 to 3 times higher in the (R)-NNN group than in the (S)-NNN group (Figure4F), and this difference was significant at each time point (P<0.001, Table 3, Supporting Information). In the (R)-NNN-treated rats, maximum total adduct levels were observed at 30 weeks (758 fmol/mg DNA) followed by a slight decrease. Similar trends were observed in the (S)-NNN treated rats, with the maximum level of 350 fmol/mg DNA also reached at 30 weeks (Figure 4F). Total POB-DNA adducts levels were relatively stable over the duration of the study. Levels of individual POB-DNA adducts in lung DNA are summarized in Figure 5K, L and Tables 1F – 3F in the Supporting Information. O2-POB-dThd was the major adduct in lung DNA as in liver, olfactory and respiratory mucosa, accounting for 73-80% of the total adducts in the rats treated with (R)-NNN and for 70-78% in the (S)-NNN group. Its levels were significantly higher than those of 7-POB-dGua at each time point (P<0.0001, Table 4, Supporting Information).
Comparative adduct levels
Comparative levels of total POB-DNA adducts in tissues of the NNN-treated rats are summarized in Figure 6 (see also Table 5 in the Supporting Information). Total adduct levels in nasal respiratory mucosa DNA were significantly higher (P= 0) than those in oral, esophageal, olfactory, lung and liver DNA for both the (R)-NNN and (S)-NNN treated groups. The second highest levels were found in esophageal mucosa DNA of the (S)-NNN-treated rats and olfactory nasal mucosa DNA of the (R)-NNN group. Definitely, there was no general decreasing trend of total adduct levels in any tissue throughout the time course. POB-DNA adducts were not detected in any tissue of the control groups.
Figure 6.

Comparison of total POB-DNA adduct levels (fmol/mg DNA) vs time (weeks) in oral mucosa, esophageal mucosa, nasal respiratory mucosa, nasal olfactory mucosa, liver and lung DNA from (A); (R)-NNN-treated rats and (B); (S)-NNN-treated rats. Symbols and colors are as follows: nasal respiratory, red closed square; liver, magenta open square; lung, green triangle; esophageal mucosa, blue circle; oral mucosa, orange diamond; nasal olfactory mucosa, grey cross. Statistical comparisons are summarized in Table 5 of the Supporting Information.
Analysis for O6-POB-dGuo
Traces of O6-POB-dGuo were observed in some nasal respiratory mucosa DNA samples from the treated animals, but the background of the signal was relatively high (Figure 7A). The presence of O6-POB-dGuo in the nasal respiratory mucosa DNA samples was confirmed by high resolution MS. As shown in Figure 7B, a clear peak corresponding to O6-POB-dGuo and co-eluting with the internal standard [pyridine-D4]O6-POB-dGuo was observed. O6-POB-dGuo was observed in nasal respiratory mucosa DNA from both (R)-NNN- and (S)-NNN-treated animals, and was also detected in esophageal DNA from (S)-NNN-treated rats. However, its levels were below the limit of quantitation.
Figure 7.

Chromatograms obtained upon analysis of O6-POB-dGuo in nasal respiratory mucosa DNA of rats treated for 70 weeks with (S)-NNN, using (A) the TSQ Quantum Vantage triple quadrupole mass spectrometer and (B) the high resolution LTQ Orbitrap Velos mass spectrometer.
Discussion
The design of this study provides a rare opportunity to relate DNA adduct levels to carcinogenicity, with both types of data obtained under identical conditions. A strong carcinogenic response was observed in both the oral cavity and esophagus of the rats treated with (S)-NNN. All rats had tumors at these sites and there were 4.5 tumors per rat in the oral cavity and 6.1 in the esophagus. In contrast, (R)-NNN was rather weakly active in these tissues. Six of 24 rats had oral cavity tumors and 3 of 24 had esophageal tumors. Some tumors were also observed in the nasal cavity: 6 of 20 rats treated with (S)-NNN and 4 of 24 treated with (R)-NNN had adenomas in the respiratory epithelium. There were no tumors at these sites in the control animals.
The highest total adduct levels, comprised mainly of O2-POB-dThd and 7-POB-Gua, were clearly found in the nasal respiratory mucosa, in both the (S)-NNN and (R)-NNN-treated rats, with considerable levels also observed in the olfactory mucosa of the rats treated with (R)-NNN (Figure 6). This is consistent with previous studies which demonstrated the presence of abundant cytochromes P450 in the rat nose.36,37 Whole body autoradiography studies of [14C]NNN showed accumulation of bound radioactivity in the nasal mucosa.38 Studies of NNN metabolism by cultured rat nasal mucosa showed extensive formation of products of 2′-hydroxylation, consistent with the DNA adducts observed in this study.39 Cytochrome P450 2A3, abundant in the rat nose, is a particularly efficient catalyst of 2′-hydroxylation of (S)-NNN, with kcat/KM nearly twice as high as for (R)-NNN10.
While the nasal mucosa was the site of high levels of DNA adducts, convincingly resulting from efficient metabolic activation in this tissue, it was not the major target tissue for carcinogenicity. This apparent contradiction also cannot be explained based on the levels of individual POB-DNA adducts quantified in this study. Levels of O2-POB-dThd and 7-POB-Gua remained relatively constant over the 70 week time period in both the olfactory and respiratory tissues, with O2-POB-dThd predominating. These results indicate that there are important factors other than DNA adduct levels involved in nasal tumorigenesis by NNN in this study. The most likely of these is the effect of tumors of the oral cavity and esophagus on survival. These tumors, some of which were large, can inhibit normal feeding, leading to weight loss and morbidity. Some insight into effects on survival can be gleaned from previous studies. Treatment of rats with multiple doses of NNN by s.c. injection induces mainly tumors of the nasal mucosa, with only a few esophageal tumors observed.40-42 This route of administration also produces high levels of DNA adducts in the nasal mucosa.32 In one study in which rats were given 3 times weekly s.c. injections of racemic NNN for 20 weeks, with a total dose of about 210 mg/rat, median survival was 90 weeks. In our recent study, treatment of rats with a total dose of 230 mg racemic NNN administered daily in the drinking water (28 ppm) induced esophageal and oral cavity tumors in all the treated rats, with a median survival of 78 weeks, shorter than in the rats treated by s.c. injection with a roughly equivalent dose.7 These results suggest that esophageal and oral tumors have a more deleterious effect than nasal tumors on survival, thus offering a plausible explanation for the relatively low tumor incidence in the nasal mucosa in this study in spite of the high DNA adduct levels.
Of course it is possible that there are other explanations for these observations. Although we observed O6-POB-dGuo in nasal respiratory mucosa and esophageal mucosa DNA, we were not able to quantify it. O6-POB-dGuo has known mutagenic properties which may be far greater than those of the adducts that we did quantify in this study.43 Differing levels and persistence of O6-POB-dGuo in target versus non-target tissues therefore might have affected the carcinogenic outcome. Furthermore, there could be basic biological differences among the nasal mucosa, esophagus, and oral mucosa due to their differing functions. Tumor enhancing stimuli such as inflammation may differ among these tissues in rats treated with the NNN enantiomers. In the respiratory nasal mucosa of rats treated with tobacco-specific nitrosamines, a variety of preneoplastic changes have been observed including chronic and acute inflammation, loss of cilia, and squamous metaplasia while atypical hyperplasia characterized by downward irregular, often finger-like projections of the basal layers of the epithelium into the underlying tissue has been observed in the oral and esophageal mucosa of rats treated with NNN.7,44 The relative degree to which these various biological alterations contribute to tumorigenicity in the nasal mucosa versus the oral and esophageal mucosa is currently not clear. We have saved tissue samples from the rats in this study for examination of patterns of differential gene expression and related investigations which may provide some additional leads regarding mechanisms of target tissue specificity.
The relative levels of DNA adducts produced from (S)-NNN and (R)-NNN in the major target tissues for carcinogenicity - oral mucosa and esophagus – are fully consistent with our previous results in the 20 week study and with the higher carcinogenicity of (S)-NNN than (R)-NNN.7,11,12 These results are also consistent with previous metabolic studies which demonstrated a greater extent of metabolic activation of (S)-NNN than (R)-NNN in the rat esophagus, and similar overall metabolism of NNN in cultured rat oral mucosa and esophagus.45,46 Collectively, these results provide support for the hypothesis that 2′-hydroxylation of (S)-NNN is a critical metabolic activation pathway leading to cancer in the rat oral cavity and esophagus.
The relative amounts of 7-POB-Gua and O2-POB-dThd were strikingly different in the tissues analyzed (Figure 5). Thus, levels of 7-POB-Gua were similar to or even exceeded those of O2-POB-dThd in the two major target tissues for carcinogenicity – oral mucosa and esophagus – while in the other tissues O2-POB-dThd clearly and significantly predominated at each time point (see Table 4 in the Supporting Information). This result replicates similar findings in our previous 20 week study of DNA adduct formation by NNN given in the drinking water, in which 7-POB-dGua levels exceeded or were similar to those of O2-POB-dThd in oral mucosa and esophagus, in contrast to the other tissues.11,12 Excluding the nasal respiratory mucosa for the reasons discussed above, the absolute levels of 7-POB-Gua in the rats treated with (S)-NNN were higher in the esophagus and oral mucosa than any of the other tissues examined, which is consistent with the carcinogenicity data (Table 2, Supporting Information). These results suggest that 7-POB-dGuo (8) [quantified as 7-POB-Gua (11)] may be an important DNA adduct in rat oral cavity and esophageal carcinogenesis by (S)-NNN.
There is no reason to believe that the different ratios of 7-POB-Gua and O2-POB-dThd observed in oral cavity and esophagus versus the other tissues results from different chemistry of formation of the adducts because 7-POB-dGuo and O2-POB-dThd are formed directly from 2′-hydroxylation of NNN, and the conversion of 7-POB-dGuo to 7-POB-Gua during DNA isolation and adduct analysis would not be influenced by the source of DNA. It is much more likely that the higher ratio of 7-POB-Gua to O2-POB-dThd observed in esophagus and oral cavity of (S)-NNN-treated rats than in any of the other tissues examined results from a deficiency in repair of 7-POB-dGuo in these tissues. Nucleotide excision repair and base excision repair could potentially remove 7-POB-dGuo from DNA in these tissues. Further studies are necessary to investigate the role of DNA repair in determining levels of these adducts.
Nothing is known about the biological properties of 8 in DNA, but it is worth noting that other 7-alkyldeoxyguanosine adducts such as those produced in the metabolism of aflatoxin-B1 and polyhalogenated olefins have mutagenic properties.47,48 The frequently observed G →T mutations are often associated with depurination yielding apurinic sites, but other mechanisms have been discussed.47,48 The potential mutagenic properties of 8 deserve further exploration.
As shown in Figure 4, adduct levels from (S)-NNN were higher than those from (R)-NNN in liver DNA, which is consistent with our previous study.12 Overall adduct formation from both enantiomers was rather low in liver, possibly because other routes of NNN metabolism including 5′-hydroxylation compete in liver.8 Since the compounds were administered in the drinking water, there is a first pass effect in the hepatic metabolism involving preferential metabolism of (S)-NNN, thus decreasing the amounts of (S)-NNN which reach extrahepatic tissues that are not directly exposed to the compound from the drinking water. This can explain why adducts from (R)-NNN exceeded those from (S)-NNN in lung and nasal olfactory mucosa, which is also consistent with our previous study.11,12 However, our results for nasal respiratory mucosa were different from those in our previous study, in which adducts from (R)-NNN predominated.11 This was apparently not due to experimental error, and we currently have no good explanation for the difference between the two studies. Another difference between this study and the previous one was our inability to observe O2-POB-dCyd (10) [as O2-POB-Cyt (12)] which was seen in our previous study in all tissues, although generally at low levels.11,12
One major goal of this study was to determine whether DNA adducts of NNN persisted during a chronic treatment regimen resulting in tumors, an important consideration when contemplating the use of DNA adducts as biomarkers of carcinogen metabolic activation in humans. If repair pathways are present, or if adducts are removed due to apoptosis, cell turnover, or other reasons, they may not be useful as biomarkers in chronically exposed humans such as tobacco consumers because their levels would be too low. In our previous study, there were suggestive decreases in adduct formation in the esophagus, lung, liver and oral mucosa (depending on the enantiomer) between 16 and 20 weeks.11,12 The present results clearly demonstrate that O2-POB-dThd and 7-POB-dGuo persisted throughout the 70 weeks of treatment with no indication of a substantial decrease exept possibly for (R)-NNN in the lung at 70 weeks. These results support the use of these POB-DNA adducts as biomarkers of NNN metabolic activation in human tissues, recognizing however that they are also produced upon metabolic activation of NNK. Other constituents of tobacco products might affect biomarker levels in a manner not examined in this study, thus limiting their application. Further studies in tobacco users are necessary to fully validate POB-DNA adducts as biomarkers of NNN and NNK metabolic activation.
In summary, the results of this study demonstrate that DNA adducts resulting from 2′-hydroxylation of both enantiomers of NNN persist throughout treatment during a carcinogenicity study and are consistent with the high carcinogenic effects of (S)-NNN in the rat oral cavity and esophagus. Our results also suggest that 7-POB-dGuo (8) may be a critical DNA adduct in carcinogenesis by NNN.
Supplementary Material
Acknowledgements
We thank Bob Carlson for editorial assistance.
Funding
This study was supported by grant CA-81301 from the National Cancer Institute.
Abbreviations
- NNN
N’-nitrosonornicotine
- NNK
4-(methylnitrosamino)-1-(3-pyridyl)-1-butanone
- O2-POB-dThd
O2-[4-(3-pyridyl)-4-oxobut-1-yl]thymidine
- 7-POB-dGuo
7-[4-(3-pyridyl)-4-oxobut-1-yl]-2′-deoxyguanosine
- 7-POB-Gua
7-[4-(3-pyridyl)-4-oxobut-1-yl]guanine
- O6-POB-dGuo
O6-[4-(3-pyridyl)-4-oxobut-1-yl]-2′-deoxyguanosine
- O2-POB-dCyd
O2-[4-(3-pyridyl)-4-oxobut-1-yl]-2′-deoxycytidine
- O2-POB-Cyt
O2-[4-(3-pyridyl)-4-oxobut-1-yl]cytosine
- LC-ESI-MS/MS
liquid chromatography-electrospray ionization-tandem mass spectrometry
- SRM
selected reaction monitoring
- POB-DNA adducts
pyridyloxobutyl-DNA adducts
- LC-NSI-HRMS/MS
liquid chromatography-nanoelectrospray-high resolution tandem mass spectrometry.
Footnotes
Notes
The authors declare no competing financial interests.
Supporting Information Tables detailing levels of POB-DNA adducts in rats treated with NNN enantiomers and statistical comparisons of adduct levels. This material is available free of charge via the Internet at http://pubs.acs.org
References
- 1.International Agency for Research on Cancer . IARC Monographs on the Evaluation of Carcinogenic Risks to Humans. Vol. 83. IARC; Lyon, FR: 2004. Tobacco Smoke and Involuntary Smoking; pp. 53–1187. [PMC free article] [PubMed] [Google Scholar]
- 2.International Agency for Research on Cancer . IARC Monographs on the Evaluation of Carcinogenic Risks to Humans. Vol. 89. IARC; Lyon, FR: 2007. Smokeless tobacco and tobacco-specific nitrosamines; pp. 41–583. [PMC free article] [PubMed] [Google Scholar]
- 3.Stepanov I, Yershova K, Carmella S, Upadhyaya P, Hecht SS. Levels of (S)-N’-nitrosonornicotine in U.S. tobacco products. Nicotine Tob. Res. 2013;15:1305–1310. doi: 10.1093/ntr/nts249. [DOI] [PMC free article] [PubMed] [Google Scholar]
- 4.Stepanov I, Jensen J, Hatsukami D, Hecht SS. New and traditional smokeless tobacco: comparison of toxicant and carcinogen levels. Nicotine Tob. Res. 2008;10:1773–1782. doi: 10.1080/14622200802443544. [DOI] [PMC free article] [PubMed] [Google Scholar]
- 5.Richter P, Hodge K, Stanfill S, Zhang L, Watson C. Surveillance of moist snuff: total nicotine, moisture, pH, un-ionized nicotine, and tobacco-specific nitrosamines. Nicotine Tob. Res. 2008;10:1645–1652. doi: 10.1080/14622200802412937. [DOI] [PubMed] [Google Scholar]
- 6.Stepanov I, Knezevich A, Zhang L, Watson CH, Hatsukami DK, Hecht SS. Carcinogenic tobacco-specific N-nitrosamines in US cigarettes: three decades of remarkable neglect by the tobacco industry. Tob. Control. 2012;21:44–48. doi: 10.1136/tc.2010.042192. [DOI] [PMC free article] [PubMed] [Google Scholar]
- 7.Balbo S, James-Yi S, Johnson CS, O’Sullivan G, Stepanov I, Wang M, Bandyopadhyay D, Kassie F, Carmella S, Upadhyaya P, Hecht SS. (S)-N’-Nitrosonornicotine, a constituent of smokeless tobacco, is a powerful oral cavity carcinogen in rats. Carcinogenesis. 2013 May 13; doi: 10.1093/carcin/bgt162. 2013. [Online early access] PMID: 23671129. Published Online. [DOI] [PMC free article] [PubMed] [Google Scholar]
- 8.Hecht SS. Biochemistry, biology, and carcinogenicity of tobacco-specific N-nitrosamines. Chem. Res. Toxicol. 1998;11:559–603. doi: 10.1021/tx980005y. [DOI] [PubMed] [Google Scholar]
- 9.International Agency for Research on Cancer (2012) IARC Monographs on the Evaluation of Carcinogenic Risks to Humans. 100E. IARC; Lyon, FR: 2012. Personal Habits and Indoor Combustions; pp. 319–331. [PMC free article] [PubMed] [Google Scholar]
- 10.Wong HL, Murphy SE, Hecht SS. Cytochrome P450 2A-catalyzed metabolic activation of structurally similar carcinogenic nitrosamines: N’-nitrosonornicotine enantiomers, N-nitrosopiperidine, and N-nitrosopyrrolidine. Chem. Res. Toxicol. 2004;18:61–69. doi: 10.1021/tx0497696. [DOI] [PubMed] [Google Scholar]
- 11.Zhang S, Wang M, Villalta PW, Lindgren BR, Lao Y, Hecht SS. Quantitation of pyridyloxobutyl DNA adducts in nasal and oral mucosa of rats treated chronically with enantiomers of N’-nitrosonornicotine. Chem. Res. Toxicol. 2009;22:949–956. doi: 10.1021/tx900040j. [DOI] [PMC free article] [PubMed] [Google Scholar]
- 12.Lao Y, Yu N, Kassie F, Villalta PW, Hecht SS. Analysis of pyridyloxobutyl DNA adducts in F344 rats chronically treated with (R)- and (S)-N’-nitrosonornicotine. Chem. Res. Toxicol. 2007;20:246–256. doi: 10.1021/tx060208j. [DOI] [PMC free article] [PubMed] [Google Scholar]
- 13.Upadhyaya P, McIntee EJ, Villalta PW, Hecht SS. Identification of adducts formed in the reaction of 5′-acetoxy-N’-nitrosonornicotine with deoxyguanosine and DNA. Chem. Res. Toxicol. 2006;19:426–435. doi: 10.1021/tx050323e. [DOI] [PMC free article] [PubMed] [Google Scholar]
- 14.Upadhyaya P, Hecht SS. Identification of adducts formed in the reactions of 5′-acetoxy-N’-nitrosonornicotine with deoxyadenosine, thymidine, and DNA. Chem. Res. Toxicol. 2008;21:2164–2171. doi: 10.1021/tx8002559. [DOI] [PMC free article] [PubMed] [Google Scholar]
- 15.Beland FA, Dooley KL, Jackson CD. Persistence of DNA adducts in rat liver and kidney after multiple doses of the carcinogen N-hydroxy-2-acetylaminofluorene. Cancer Res. 1982;42:1348–1354. [PubMed] [Google Scholar]
- 16.Gupta RC, Earley K, Becker FF. Analysis of DNA adducts in putative premalignant hepatic nodules and nontarget tissues of rats during 2-acetylaminofluorene carcinogenesis. Cancer Res. 1988;48:5270–5274. [PubMed] [Google Scholar]
- 17.Poirier MC, Hunt JM, True BA, Laishes BA, Young JF, Beland FA. DNA adduct formation, removal and persistence in rat liver during one month of feeding 2-acetylaminofluorene. Carcinogenesis. 1984;5:1591–1596. doi: 10.1093/carcin/5.12.1591. [DOI] [PubMed] [Google Scholar]
- 18.Herron DC, Shank RC. DNA methylation during chronic administration of 1,2-dimethylhydrazine in a carcinogenic regimen. Carcinogenesis. 1982;3:857–860. doi: 10.1093/carcin/3.8.857. [DOI] [PubMed] [Google Scholar]
- 19.Swenberg JA, Richardson FC, Tyeryar L, Deal F, Boucheron J. The molecular dosimetry of DNA adducts formed by continuous exposure of rats to alkylating hepatocarcinogens. Prog. Exp. Tumor Res. 1987;31:42–51. doi: 10.1159/000413902. [DOI] [PubMed] [Google Scholar]
- 20.Buss P, Caviezel M, Lutz WK. Linear dose-response relationship for DNA adducts in rat liver from chronic exposure to aflatoxin B1. Carcinogenesis. 1990;11:2133–2135. doi: 10.1093/carcin/11.12.2133. [DOI] [PubMed] [Google Scholar]
- 21.Yamashita K, Adachi M, Kato S, Nakagama H, Ochiai M, Wakabayashi K, Sato S, Nagao M, Sugimura T. DNA adducts formed by 2-amino-3,8-dimethylimidazo[4,5-f]quinoxaline in rat liver: dose-response on chronic administration. Jpn. J. Cancer Res. 1990;81:470–476. doi: 10.1111/j.1349-7006.1990.tb02593.x. [DOI] [PMC free article] [PubMed] [Google Scholar]
- 22.Zaidi NH, Potten CS, Margison GP, Cooper DP, O’Connor PJ. Tissue and cell specific methylation, repair and synthesis of DNA in the upper gastrointestinal tract of Wistar rats treated with N-methyl-N’-nitro-N-nitrosoguanidine via the drinking water. Carcinogenesis. 1993;14:1991–2001. doi: 10.1093/carcin/14.10.1991. [DOI] [PubMed] [Google Scholar]
- 23.Talaska G, Jaeger M, Reilman R, Collins T, Warshawsky D. Chronic, topical exposure to benzo[a]pyrene induces relatively high steady-state levels of DNA adducts in target tissues and alters kinetics of adduct loss. Proc. Natl. Acad. Sci. U.S.A. 1996;93:7789–7793. doi: 10.1073/pnas.93.15.7789. [DOI] [PMC free article] [PubMed] [Google Scholar]
- 24.Yu HS, Oyama T, Matsuda T, Isse T, Yamaguchi T, Tanaka M, Tsuji M, Kawamoto T. The effect of ethanol on the formation of N2-ethylidene-dG adducts in mice: implications for alcohol-related carcinogenicity of the oral cavity and esophagus. Biomarkers. 2012;17:269–274. doi: 10.3109/1354750X.2012.666675. [DOI] [PubMed] [Google Scholar]
- 25.Staretz ME, Foiles PG, Miglietta LM, Hecht SS. Evidence for an important role of DNA pyridyloxobutylation in rat lung carcinogensis by 4-(methylnitrosamino)-1-(3-pyridyl)-1-butanone: effects of dose and phenethyl isothiocyanate. Cancer Res. 1997;57:259–266. [PubMed] [Google Scholar]
- 26.Lao Y, Yu N, Kassie F, Villalta PW, Hecht SS. Formation and accumulation of pyridyloxobutyl DNA adducts in F344 rats chronically treated with 4-(methylnitrosamino)-1-(3-pyridyl)-1-butanone and enantiomers of its metabolite, 4-(methylnitrosamino)-1-(3-pyridyl)-1-butanol. Chem. Res. Toxicol. 2007;20:235–245. doi: 10.1021/tx060207r. [DOI] [PMC free article] [PubMed] [Google Scholar]
- 27.Upadhyaya P, Kalscheuer S, Hochalter B, Villalta PW, Hecht SS. Quantitation of pyridylhydroxybutyl-DNA adducts in liver and lung of F-344 rats treated with 4-(methylnitrosamino)-1-(3-pyridyl)-1-butanone and enantiomers of its metabolite 4-(methylnitrosamino)-1-(3-pyridyl)-1-butanol. Chem. Res. Toxicol. 2008;21:1468–1476. doi: 10.1021/tx8001109. [DOI] [PMC free article] [PubMed] [Google Scholar]
- 28.Zhang S, Wang M, Villalta PW, Lindgren BR, Upadhyaya P, Lao Y, Hecht SS. Analysis of pyridyloxobutyl and pyridylhydroxybutyl DNA adducts in extrahepatic tissues of F344 rats treated chronically with 4-(methylnitrosamino)-1-(3-pyridyl)-1-butanone and enantiomers of 4-(methylnitrosamino)-1-(3-pyridyl)-1-butanol. Chem. Res. Toxicol. 2009;22:926–936. doi: 10.1021/tx900015d. [DOI] [PMC free article] [PubMed] [Google Scholar]
- 29.Upadhyaya P, Lindgren PR, Hecht SS. Comparative levels of O6-methylguanine, pyridyloxobutyl-, and pyridylhydroxybutyl-DNA adducts in lung and liver of rats treated chronically with the tobacco-specific carcinogen 4-(methylnitrosamino)-1-(3-pyridyl)-1-butanone. Drug Metab. Dispos. 2009;37:1147–1151. doi: 10.1124/dmd.109.027078. [DOI] [PMC free article] [PubMed] [Google Scholar]
- 30.Stepanov I, Hecht SS. Mitochondrial DNA adducts in the lung and liver of F344 rats chronically treated with 4-(methylnitrosamino)-1-(3-pyridyl)-1-butanone and (S)-4-(methylnitrosamino)-1-(3-pyridyl)-1-butanol. Chem. Res. Toxicol. 2009;22:406–414. doi: 10.1021/tx800398x. [DOI] [PMC free article] [PubMed] [Google Scholar]
- 31.Carmella SG, McIntee EJ, Chen M, Hecht SS. Enantiomeric composition of N’-nitrosonornicotine and N’-nitrosoanatabine in tobacco. Carcinogenesis. 2000;21:839–843. doi: 10.1093/carcin/21.4.839. [DOI] [PubMed] [Google Scholar]
- 32.Trushin N, Rivenson A, Hecht SS. Evidence supporting the role of DNA pyridyloxobutylation in rat nasal carcinogenesis by tobacco specific nitrosamines. Cancer Res. 1994;54:1205–1211. [PubMed] [Google Scholar]
- 33.Lao Y, Villalta PW, Sturla SJ, Wang M, Hecht SS. Quantitation of pyridyloxobutyl DNA adducts of tobacco-specific nitrosamines in rat tissue DNA by high performance liquid chromatography-electrospray ionization-tandem mass spectrometry. Chem. Res. Toxicol. 2006;19:674–682. doi: 10.1021/tx050351x. [DOI] [PMC free article] [PubMed] [Google Scholar]
- 34.Wang M, Yu N, Chen L, Villalta PW, Hochalter JB, Hecht SS. Identification of an acetaldehyde adduct in human liver DNA and quantitation as N2-ethyldeoxyguanosine. Chem. Res. Toxicol. 2006;19:319–324. doi: 10.1021/tx0502948. [DOI] [PMC free article] [PubMed] [Google Scholar]
- 35.Gupta RC. Enhanced sensitivity of 32P-postlabelling analysis of aromatic carcinogen: DNA adducts. Cancer Res. 1985;45:5656–5662. [PubMed] [Google Scholar]
- 36.Thornton-Manning JR, Dahl AR. Metabolic capacity of nasal tissue interspecies comparisons of xenobiotic-metabolizing enzymes. Mutat. Res. 1997;380:43–59. doi: 10.1016/s0027-5107(97)00126-7. [DOI] [PubMed] [Google Scholar]
- 37.Minn AL, Pelczar H, Denizot C, Martinet M, Heydel JM, Walther B, Minn A, Goudonnet H, Artur Y. Characterization of microsomal cytochrome P450-dependent monooxygenases in the rat olfactory mucosa. Drug Metab. Dispos. 2005;33:1229–1237. doi: 10.1124/dmd.105.004085. [DOI] [PubMed] [Google Scholar]
- 38.Löfberg B, Brittebo EB, Tjälve H. Localization and binding of N’-nitrosonornicotine metabolites in the nasal region and in some other tissues of Sprague-Dawley rats. Cancer Res. 1982;42:2877–2883. [PubMed] [Google Scholar]
- 39.Brittebo EB, Castonguay A, Furuya K, Hecht SS. Metabolism of tobacco specific nitrosamines by cultured rat nasal mucosa. Cancer Res. 1983;43:4343–4348. [PubMed] [Google Scholar]
- 40.Hecht SS, Chen CB, Ohmori T, Hoffmann D. Comparative carcinogenicity in F344 rats of the tobacco specific nitrosamines, N’-nitrosonornicotine and 4-(N-methyl-N-nitrosamino)-1-(3-pyridyl)-1-butanone. Cancer Res. 1980;40:298–302. [PubMed] [Google Scholar]
- 41.Hoffmann D, Rivenson A, Amin S, Hecht SS. Dose-response study of the carcinogenicity of tobacco-specific N-nitrosamines in F344 rats. J. Cancer Res. Clin. Oncol. 1984;108:81–86. doi: 10.1007/BF00390978. [DOI] [PubMed] [Google Scholar]
- 42.Castonguay A, Rivenson A, Trushin N, Reinhardt J, Spathopoulos S, Weiss CJ, Reiss B, Hecht SS. Effects of chronic ethanol consumption on the metabolism and carcinogenicity of N’-nitrosonornicotine in F344 rats. Cancer Res. 1984;44:2285–2290. [PubMed] [Google Scholar]
- 43.Mijal RS, Loktionova NA, Vu CC, Pegg AE, Peterson LA. O6-pyridyloxobutylguanine adducts contribute to the mutagenic properties of pyridyloxobutylating agents. Chem. Res. Toxicol. 2005;18:1619–1625. doi: 10.1021/tx050139t. [DOI] [PubMed] [Google Scholar]
- 44.Rivenson A, Furuya K, Hecht SS, Hoffmann D. Experimental nasal cavity tumors induced by tobacco-specific nitrosamines (TSNA) In: Reznik G, Stinson SF, editors. Nasal Tumors in Animals and Man. CRC Press, Inc.; Boca Raton, FL: 1983. pp. 79–113. [Google Scholar]
- 45.McIntee EJ, Hecht SS. Metabolism of N’-nitrosonornicotine enantiomers by cultured rat esophagus and in vivo in rats. Chem. Res. Toxicol. 2000;13:192–199. doi: 10.1021/tx990171l. [DOI] [PubMed] [Google Scholar]
- 46.Murphy SE, Heiblum R, Trushin N. Comparative metabolism of N’-nitrosonornicotine and 4-(methylnitrosamino)-1-(3-pyridyl)-1-butanone by cultured rat oral tissue and esophagus. Cancer Res. 1990;50:4685–4691. [PubMed] [Google Scholar]
- 47.Smela ME, Currier SS, Bailey EA, Essigmann JM. The chemistry and biology of aflatoxin B(1): from mutational spectrometry to carcinogenesis. Carcinogenesis. 2001;22:535–545. doi: 10.1093/carcin/22.4.535. [DOI] [PubMed] [Google Scholar]
- 48.Guengerich FP. Principles of covalent binding of reactive metabolites and examples of activation of bis-electrophiles by conjugation. Arch. Biochem. Biophys. 2005;433:369–378. doi: 10.1016/j.abb.2004.07.035. [DOI] [PubMed] [Google Scholar]
Associated Data
This section collects any data citations, data availability statements, or supplementary materials included in this article.