Abstract
Purpose: Eperisone Hydrochloride (EPE) is a potent new generation antispasmodic drug which is used in the treatment of moderate to severe pain in combination with Paracetamol (PAR). Both drugs are available in tablet dosage form in combination with a dose of 50 mg for EPE and 325 mg PAR respectively. Methods: The method is based upon Q-absorption ratio method for the simultaneous determination of the EPE and PAR. Absorption ratio method is used for the ratio of the absorption at two selected wavelength one of which is the iso-absorptive point and other being the λmax of one of the two components. EPE and PAR shows their iso-absorptive point at 260 nm in methanol, the second wavelength used is 249 nm which is the λmax of PAR in methanol. Results: The linearity was obtained in the concentration range of 5-25 μg/mL for EPE and 2-10 μg/mL for PAR. The proposed method was effectively applied to tablet dosage form for estimation of both drugs. The accuracy and reproducibility results are close to 100% with 2% RSD. Results of the analysis were validated statistically and found to be satisfactory. The results of proposed method have been validated as per ICH guidelines. Conclusion: A simple, precise and economical spectrophotometric method has been developed for the estimation of EPE and PAR in pharmaceutical formulation.
Keywords: Eperisone Hydrochloride, Paracetamol, Iso-absorptive point, Absorption ratio method, Spectrophotometric method, ICH
Introduction
EPE is a chemically (2RS)-1-(4-Ethylphenyl)-2-methyl-3-piperidin-1-ylpropan-1-onemonohydrochlo¬ride (1:1) (Figure 1). EPE is a new generation antispasmodic drug.1It exhibits both skeletal muscle relaxant and vasodilator properties because of its actions within the central nervous system and on vascular smooth muscles and demonstrates a variety of pharmacological effects such as cervical spondylosis, headache and low back pain.2 EPE is official in Japanese Pharmacopeia and described potentiometric method for its estimation.3 Literature survey divulge that ESI-MS method for estimation of EPE in human plasma,4 HPLC/MS, GC/MS, NMR, UV and IR analytical techniques to identify a degradation product of EPE in the tablets dosage form5 are available. More recently spectrophotometric method for simultaneous estimation of EPE and Diclofenac sodium in synthetic mixture has been reported.6
Figure 1.
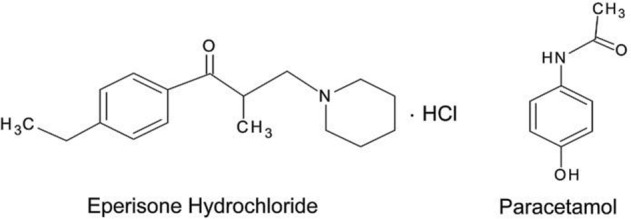
Structure of EPE and PAR
PAR is a chemically N-(4-Hydroxyphenyl) acetamide(Figure 1). PAR is a non-opioid, non-salicylate analgesic with an unclear mechanism of action. PAR is official in IP,7 BP8 and USP.9 Literature survey reveals U.V. and chromatographic methods are available for estimation of PAR in single and combined dosage forms.10-17 Literature survey also reveals LC-MS, GC-MS, IR18 and HPTLC19 methods are reported for estimation of PAR with other drugs in combination.
EPE is a potent new generation antispasmodic drug which is used in the treatment of moderate to severe pain in combination with PAR. Literature survey reveals that no method has been reported for estimation of EPE and PAR in combination. The objective of the present work is to develop new spectrophotometric method for estimation of EPE and PAR in tablet formulation with good accuracy, simplicity, precision and economy over other chromatographic methods and which can be used for routine analysis.
Materials and Methods
The instrument used in the present study was JASCO double beam UV/Visible Spectrophotometer (Model V-630) with spectral bandwidth of 1 nm and 10 mm a matched quartz cell was used. All weighing was done on electronic balance (Model Shimadzu BL 320-H).
Reagents and Chemicals
Analytically pure sample of EPE and PAR were obtained as a gift sample from Abbott Healthcare pvt.Ltd., Mumbai, India and Wockhardt Ltd., Aurangabad, India respectively. The analytical reagent grade methanol acquired from LobaChemie, Mumbai, India and used as solvent. Marketed preparation of EPE and PAR was procured from local market.
Preparation of Stock Standard Solutions
Stock standard solutions of EPE and PAR were prepared separately by dissolving 10 mg in 100 mL methanol to obtain concentration 100 μg/mL of each. From these stock solutions, working standard solutions having concentration 10 μg/mL of EPE and 10 μg/mL of PAR were prepared by proper dilutions. They were scanned in the UV region i.e. 400-200 nm. The overlain spectrum (Figure 2)was obtained to determine the maximum absorbance (λ max) and iso-absorptive point.
Figure 2 .
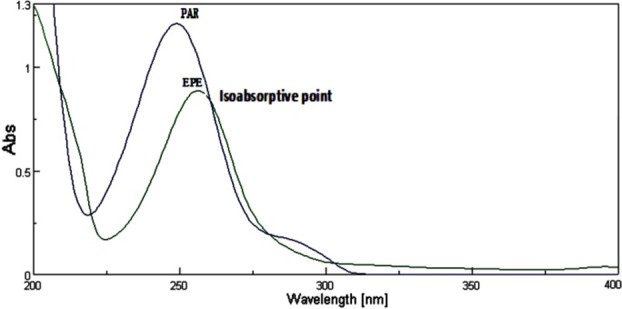
Overlain absorption spectra of EPE (10 μg/mL) and PAR (10 μg/mL) in methanol.
Estimation of EPE and PAR from Pharmaceutical Formulation by Q-Absorbance Ratio Method20
Q-Absorbance method uses the ratio of absorbance at two selected wavelengths, one at iso-absorptive point and other being the λ max of one of the two drugs. The content of twenty tablets were accurately weighed and crushed into fine powdered. A quantity of powderequivalent to 5 mg of EPE and 32.5mg of PAR was transferred to 100 mL volumetric flask containing 60 mL methanol, shaken manually for 20 min and the volume was made up to the mark and filtered through whatmann filter paper (no.41). The solution was further diluted with methanol to give the concentration within Beer’s Law range. Absorbance of this solution was measured at 249 nm and 260 nm and concentrations of these two drugs in the tablet formulation were calculated using equation (1) and equation (2).
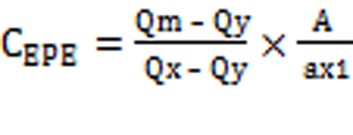
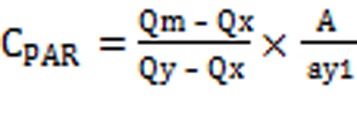
The concentration of two drugs in mixture was calculated by using following equations:
Where,


‘A’, is the absorbance of mixture at 260 nm and ax1, ax2 and ay1, ay2 are E (1%, 1 cm) of EPE and PAR at 260 nm and 249 nm and Qm= A2/A1, Qy = ay2/ay1 and Qx = ax2/ax1.
Method Validation
Validation of proposed method was done as per ICH guidelines21by means of the following parameters.
Linearity
As per ICH guidelines the linearity of an analytical procedure is its ability (within a given range) to obtain test results which are directly proportional to the concentration (amount) of analyte in the sample.21 An appropriate volume of EPE and PAR in the range of 0.5-2.5 mL and 0.2-1.0 mL respectively were transferred into series of separate 10 mL volumetric flasks and volume was made up to mark with methanol to get concentrations in the range of 5–25 μg/mL and 2-10 μg/mL respectively.
Accuracy and Precision
The accuracy of an analytical procedure expresses the closeness of agreement between the value which is accepted either as a conventional true value or an accepted reference value and the value found. The precision of an analytical procedure expresses the closeness of agreement (degree of scatter) between a series of measurements obtained from multiple sampling of the same homogeneous sample under the prescribed conditions.21 The accuracy of the proposed methods was checked by recovery studies, by addition of standard drug solution to reanalyzed sample solution at three different concentration levels within the range of linearity for both the drugs. The precision of the analytical method was checked by repeated scanning and measurement of absorbance of solutions (n=5) for EPE and PAR (5 μg/mL for both drugs) without changing the parameter of the proposed spectrophotometry method.
Specificity
Specificity is the ability to assess unequivocally the analyte in the presence of components which may be expected to be present.21Typically these might include impurities, degradants,
matrix, etc.
Limit of Detection
According to ICH guidelines the detection limit of an individual analytical procedure is the lowest amount of analyte in a sample which can be detected but not necessarily quantitated as an exact value.21 Limit of detection can be calculated using following equation as per ICH guidelines.
LOD = 3.3 × N/S
Where, N is the standard deviation of the peak areas of the drug and S is the slope of the corresponding calibration curve.
Limit of Quantification
The quantitation limit of an individual analytical procedure is the lowest amount of analyte in a sample which can be quantitatively determined with suitable precision and accuracy. The quantitation limit is a parameter of quantitative assays for low levels of compounds in sample matrices, and is used particularly for the determination of impurities and/or degradation products21. Limit of quantification can be calculated using following equation as per ICH guidelines.
LOQ = 10 × N/S
Where, N is the standard deviation of the peak areas of the drug and S is the slope of the corresponding calibration curve.
Results
The absorbance of the EPE and PAR was measured at 255 nm and 249 nm (Figure 3) respectively and calibration curves were plotted as concentrations versus absorbance. The Relative Standard Deviation (RSD) for intra-day analysis of EPE was found in the range of 0.58- 1.14 % (249 nm) and 0.69-1.44 % (260 nm), RSD for Inter-day analysis of EPE was found to be 0.47-1.37% (249 nm) and 0.46-1.03% (260 nm). The RSD for intra-day analysis of PAR was found in the range of 0.39-1.08% (249 nm) and 0.37-1.24% (260 nm), RSD for Inter-day analysis of PAR was found to be 0.64-1.23% (249 nm) and 0.68-1.10% (260 nm). The accuracy and reproducibility is evident from the data as results are close to 100 % and the value of standard deviation and % R.S.D. were found to be < 2 %; shows the high precision of the method. The proposed method is simple, economical, rapid, precise and accurate. Hence it can be used for routine analysis of EPE and PAR in pharmaceutical formulation. The proposed method was found to be specific as there is no interference from other excipients. The LOD for EPE and PAR was found to be 0.12 μg/mL and 0.10 μg/mL respectively at 249 nm, LOD for EPE and PAR was found to be 0.13 μg/mL and 0.11 μg/mL respectively at 260 nm. The LOQ for EPE and PAR was found to be 0.41 μg/mL and 0.32 μg/mL respectively at 249 nm, LOQ for EPE and PAR was found to be 0.38 μg/mL and 0.34 μg/mL respectively at 260 nm. Marketed brand of tablet (Myosone plus) was analyzed, the amounts of EPE and PAR determined by proposed method were found to be 100.28% and 99.89% respectively.
Figure 3.
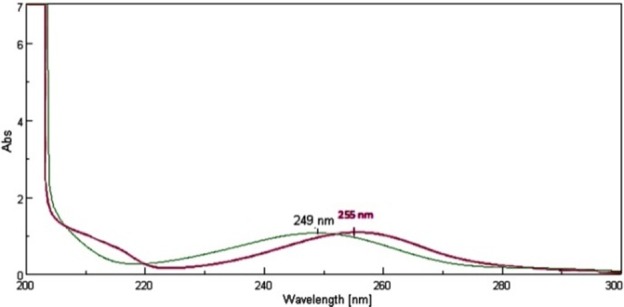
Absorption spectra of standard PAR at 10 μg/mL (Top) and EPEat25 μg/mL (bottom).
Discussion
In absorbance ratio method (Q-analysis), the primary requirement for developing a method for analysis is that the entire spectra should follow the Beer’s law at all the wavelength, which was fulfilled in case of both these drugs. The two wavelengths were used for the analysis of the drugs were 260 nm (iso-absorptive point) and 249 nm (λ-max of PAR) at which the calibration curves were prepared for both the drugs. In methanol, EPE and PAR obeyed linearity in the concentration range of 5-25 μg/mL and 2-10 μg/mL respectively at their respective λmax with correlation coefficient (r2> 0.99) in both the case. In proposed method precision was studied as repeatability (%RSD<2) and inter and intra-day variations (%RSD<2) for both drugs; shows the high precision of the method (Table 1). The accuracy of method was determined by calculating mean percentage recovery. It was determined at 50, 100 and 150 % level and data are presented in Table 2. The ruggedness of the methods was studied by two different analysts using the same operational and environmental conditions. The developed method for estimation of EPE and PAR intablet dosage form was found to be simple, accurate, reproducible, sensitive and economic. For projected method we used easily available and cheap solvent like methanol (AR grade), Q analysis method of simultaneous estimation not required any expensive and satisfactory apparatus in contrast to reported chromatographic and hyphenated techniques. So it shows proposed method is simple, economic and rapid for estimation of EPE and PAR in combined dosage forms. Hence the developed method for estimation of EPE and PAR can be constructive in the routine analysis.
Table 1. Optical, Regression characteristics and validation parameters of Q-Absorbance ratio method for analysis of EPE and PAR.
| Parameters | EPE | PAR | |||
| 249 | 260 | 249 | 260 | ||
| Beer’s Law Limit (µg/mL) | 5-25 | 5-25 | 2-10 | 2-10 | |
| Molar Absorptivity (1mole-1cm-1) | 0.08044 | 0.085254 | 0.11036 | 0.078079 | |
| Regression equation (y= mx + c) | Slope (m) | 0.097 | 0.093 | 0.067 | 0.039 |
| Intercept (c) | 0.005 | 0.052 | 0.042 | 0.061 | |
| Correlation Coefficient (r2) | 0.994 | 0.991 | 0.994 | 0.992 | |
| Standard Deviation (S.D) | 0.0027 | 0.0036 | 0.0047 | 0.0077 | |
| Relative Standard Deviation (RSD or % CV) | 0.7461 | 0.9145 | 0.6124 | 0.8345 | |
| LOD (µg/mL) | 0.12 | 0.13 | 0.10 | 0.11 | |
| LOQ (µg/mL) | 0.41 | 0.38 | 0.32 | 0.34 | |
| Precision (%RSD) (n=5) | Intraday | 0.58-1.14 | 0.69-1.44 | 0.39-1.08 | 0.37-1.24 |
| Interday | 0.47-1.37 | 0.46-1.03 | 0.64-1.23 | 0.68-1.10 | |
Table 2. Recovery studies of EPE and PAR.
| Drug | Conc. of drug added | %Recovery±S.D.* | |
| µg/mL | %Level | ||
| EPE | 5 | 50 | 100.55±0.65 |
| 10 | 100 | 99.76±0.56 | |
| 15 | 150 | 101.43±0.26 | |
| PAR | 5 | 50 | 99.37±0.34 |
| 10 | 100 | 100.72±0.65 | |
| 15 | 150 | 99.46±0.49 | |
| *Mean of three determinations | |||
Conclusion
The developed and validated UV estimation method reported here is rapid, simple, accurate, sensitive and specific. The method was also successfully used for quantitative estimation and analysis of EPE and PAR in combined dosage form. Thus the reported method is of substantial importance and has great industrial applicability for quality control and analysis of EPE and PAR in combined dosage forms. By observing validation parameter and statistical data, the proposed method was found to be satisfactory over other reported chromatographic methods.
Acknowledgements
The authors are thankful to Principal, M.E.S. College of Pharmacy and secretary, Honorable PrashantPatilGadakh, Mula Education Society, Sonai, for encouragement and availing of the necessary facilities during the course of investigation. Authors are also gratified to Abbott Healthcare pvt. Ltd., Mumbai, India and Wockhardt Ltd., Aurangabad, India for providing gift sample of Eperisone Hydrochloride and Paracetamol respectively.
Conflict of Interest
The authors report no conflicts of interest.
References
- 1.Maryadele JN. The Merck Index: An encyclopedia of chemicals, drugs and biological. 14th ed. New Jersey:Merck INC., Whitehouse Station;2006.
- 2.Cabitza P, Randelli P. Efficacy and safety of eperisone in patients with low back pain: A double blind randomized study. EurRevMedPharmacolSci. 2008;12:229–35. [PubMed] [Google Scholar]
- 3.Society of Japanese Pharmacopoeia. The Japanese Pharmacopoeia. 15th ed. Shibuya Tokyo Japan: The stationery office; 2006.
- 4.Ding L, Wei X, Zhang S, Sheng J, Zhang Y. Rapid and sensitive liquid chromatography–electrospray ionization-mass spectrometry method for the determination of eperisone in human plasma: method and clinical applications. J ChromatogrSci. 2004;42:254–8. doi: 10.1093/chromsci/42.5.254. [DOI] [PubMed] [Google Scholar]
- 5.Ding L, Wang X, Yang Z, Chen Y. The use of HPLC/MS, GC/MS, NMR, UV and IR to identify a degradation product of eperisone hydrochloride in the tablets. J Pharm Biomed Anal . 2008;46(2):282–7. doi: 10.1016/j.jpba.2007.09.029. [DOI] [PubMed] [Google Scholar]
- 6.Patel P, Patel S, Patel U. Spectophotometric method for simultenous estimation of Eperisone Hydrochloride and Diclofenac sodium in synthetic mixtures. Int Res J pharm . 2012;3(9):203–6. [Google Scholar]
- 7.Government of India. The Indian Pharmacopoeia. 4th ed. New Delhi, India: Controller of Publication; 1996.
- 8.British pharmacopoeia. London: Her Majesty’s stationary office; 2007.
- 9.United States Pharmacopeia and National Formulary (USP 30/NF 25). Rockville, MD, USA: United States Pharmacopeial Convention; 2007.
- 10.Ashraful S, Abuzar S, Kumar P. Validation of UV-Spectrophotometric and RP-HPLC methods for the simultaneous analysis of Paracetamol and Aceclofenac in marketed tablets. Int J Pharm Life Sci. 2011;2(12):1267–75. [Google Scholar]
- 11.Patel M, Shah R, Kadikar H, Patani P, Shukla M. Method development and statistical validation of UV spectrophotometric method for estimation of Tolperisone hydrochloride and Paracetamol in synthetic mixture and combined dosage form. Int J Pharm Res Bio Sci. 2012;1(1):1–19. [Google Scholar]
- 12.Parojcic J, Karljikovic-Rajic K, Duric Z, Jovanovic M, Ibric S. Development of the second-order derivative UV spectrophotometric method for direct determination of paracetamol in urine intended for biopharmaceutical characterization of drug products. Biopharm Drug Disp. 2003;24(7):309–14. doi: 10.1002/bdd.367. [DOI] [PubMed] [Google Scholar]
- 13.Shrestha B, Pradhananga R. Spectrophotometric method for the determination of paracetamol. J Nepal ChemSoc. 2009;24:39–44. [Google Scholar]
- 14.Khoshayand MR, Abdollahi H, Ghaffari A, Shariatpanahi M, Farzanegan H. Simultaneous spectrophotometric determination of Paracetamol, Phenyleperine and Chlropheniramine in pharmaceuticals using chemometric approaches. DARU. 2010;18(4):292–7. [PMC free article] [PubMed] [Google Scholar]
- 15.Ashraful S, Shultana S, Sayeed M, Dewan I. UV-Spectrophotometric and RP-HPLC Methods for the simultaneous estimation of acetaminophen and caffeine: Validation, comparison and application for marketed tablet analysis. Int J Pharm. 2012;2(1):39–45. [Google Scholar]
- 16.Kirtawade R, salve P, Seervi C, Kulkarni A, Dhabale P. Simultaneous UV Spectrophotometric Method for Estimation of Paracetamol and Nimesulide in Tablet Dosage Form. Int J ChemTechnol Res . 2010;2(2):818–21. [Google Scholar]
- 17.Suryan A, Bhusari V, Rasal K, Dhaneshwar S. Simultaneous Quantitation and Validation of Paracetamol, Phenylpropanolamine Hydrochloride and Cetirizine Hydrochloride by RP-HPLC in Bulk Drug and Formulation. Int J Pharm Sci Drug Res . 2011;3(4):303–8. [Google Scholar]
- 18.Trafford AD, Jee RD, Moffat AC, Graham P. A rapid quantitative assay of intact Paracetamol tablets by reflectance near-infrared spectroscopy. Analyst . 1999;124(2):163–7. doi: 10.1039/a806629i. [DOI] [PubMed] [Google Scholar]
- 19.Baheti K, Shaikh S, Shah N, Dehghan M. Validated Simultaneous Estimation of Paracetamol and Etoricoxib in Bulk and Tablet by HPTLC Method. Int J Res Pharm Biomed Sci. 2011;2(2):672–5. [Google Scholar]
- 20.Stenlake J, Backett A. Practical Pharmaceutical chemistry. 4th ed. New Delhi: C.B.S. Publishers; 2007.
- 21.International Conference on Harmonization (ICH), Draft guidelines on validation of Analytical Procedure, Definition and Terminology. Geneva: Federal Register; 1995. p. 11260-62.


