Abstract
Purpose: Cyclic voltammetry and differential pulse voltammetry were used to explore the diffusion behavior of two antipsychotic drugs at a glassy carbon electrode. A well-defined oxidation peak was obtained in Britton-Robinson (BR) buffer (pH 2.0). The response was evaluated as a function of some variables such as the scan rate, and pH. Methods: A simple, precise, inexpensive and sensitive voltammetric method has been developed for the determination of the cited drugs Olanzapine (OLZ) and Quetiapine fumarate (QUT). Results: A linear calibration was obtained from 3 × 10⁻⁸ M to 4 × 10⁻⁶ M and 2 × 10⁻⁸ M to 5 × 10⁻⁶ M, with R. S. D. were 1.6 % and 1.2 % for OLZ and QUT, respectively. The limit of detection (LOD) was 1 × 10⁻⁸ M, while the limit of quantification (LOQ) was 3 × 10⁻⁸ M. Conclusion: The method was applied to the determination of investigated drugs in urine and serum samples and dosage forms.
Keywords: Olanzapine, Quetiapine fumarate, Voltammetry, Pharmaceuticals, Urine
Introduction
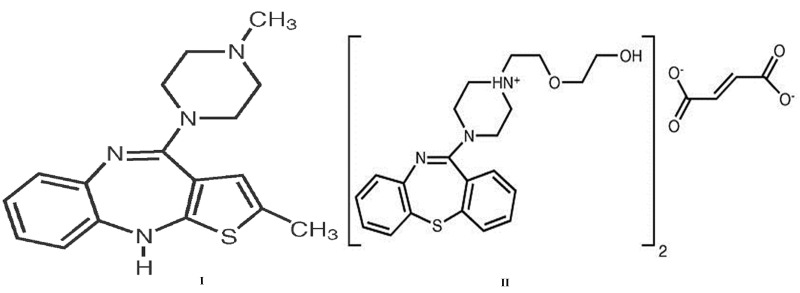
Olanzapine (OLZ) I, and Quetiapine fumarate (QUT) II are psychotropic agents that belongs to the thienobenzodiazepine class, a relatively new benzodiazepine, which has been found useful in the treatment of, among other psychosis, schizophrenia.1-3 The cited drugs are the antipsychotic that has the highest serotonin/dopamine binding ratio,4 being the serotonin type 2 (5-HT2)-receptor blocking effect about twice as strong as the dopamine D2-receptor blocking effect.5 The chemical formula of olanzapine is 2methyl-4-(4-methyl-1-piperazinyl)-10 H –thieno [2,3- b][1,5] benzodiazepine and Quetiapine fumarate (bis [2(2-[4-(dibenzo[b,f][1,4]thiazepin-11-yl)] ethoxy)ethanol]. The molecular formula is C17H20N4S and C42H50N6O4S2·C4H4O, which corresponds to a molecular weight of 312.44 and 883.11 (fumarate salt) for OLZ and QUT, respectively. The chemical structures are shown in Figure 1:
Figure 1.
Chemical structures of Olanzapine (OLZ) I and Quetiapine fumarate (QUT) II.
A literature search showed that until now, high-performance liquid chromatography (HPLC) has been the major technique used for the quality control of pharmaceutical formulations containing these drugs. Therefore, the aim of the present work was to design easy electrochemical method for determination of the cited drugs in pure, in the pharmaceutical formulations and in biological fluids.
Several methods have been reported for analysis of investigated drugs in pharmaceutical formulations including biological fluids and flow injection titration,6voltammetry,7 gas chromatography,8-10 high performance liquid chromatograpgy,11-16capillary zone electrophoresis,17 HPTLC,18 X-ray powder diffraction,19and Spectrophotometry.20-22
However, these methods require multi-step extraction procedures and selective detectors. Therefore, it was felt useful to develop electrochemical method for its determination. The problem in the reported assay is the precise, specific and easy measurement of this potent drugs in dosage forms especially they only possess a very low absorption in the UV region. This weak absorption means that a conventional UV spectrophotometric assay is susceptible to interference from excipients. This work reported an example of using electrochemical method in drug analysis. The possibility of performing more in this field is still opened for further trials. I have tried to contribute to the field of drug analysis as much as possible and according to available facilities. The research is in progress with a direction to apply the analytical techniques in clinical studies and to solve problems facing the local pharmaceutical industry. Hence, the proposed electrochemical method to analysis our cited drugs are simple, accurate and inexpensive. They can adapt for quality control testing and drug stability monitoring (antidepressant, vitamins, antibiotic, etc).
Good electrical conductivity of the electrodes is an important factor. Carbon-based electrodes usually have a wider potential range than the other solid electrodes because of their broad potential window, low background current, rich surface chemistry, chemical inertness, low cost and suitability for various sensing and detection applications.
Glassy carbon electrode (GCE) is a class of nongraphitizing carbon that is widely used as an electrode material in electrochemistry. It is also known as vitreous carbon. Glassy carbon electrode is used very commonly because of its excellent mechanical and electrical properties, impermeability to gases and extremely low porosity. Electro analytical application23,24 of carbon based electrodes to determine pharmaceutical compounds in their dosage forms and in biological samples using modern electrochemical techniques were published.
Materials and Methods
Materials
Olanzapine and quetiapine were provided from Lilly (Brussels, Belgium) and AstraZeneca (Mölndal, Sweden) respectively. Pharmaceutical preparations, Zyprexa (olanzapine, Lilly), and Seroquel (quetiapine fumarate, AstraZeneca) were used for quantitative determinations. Stock solutions of 1 × 10⁻³ M of OLZ, and QUT were prepared by dissolving a calculated weight of the active ingredient drugs in deionized water and stored in dark bottles at 4°C. More dilute solutions were prepared daily just before use. Britton–Robinson (B–R) buffer solutions (pH 2 – 6) were used as supporting electrolytes. All solutions were prepared from Analar-grade reagents (Merck and Sigma) in doubly distilled water.
Instrumentation
The cyclic and DPV experiments at a stationary electrode were performed using 797VA Computrace software (1.0) from Metrohm, Switzerland, electrochemical analyzer. A three electrode cell system incorporating the glassy carbon disc electrode as working electrode: an Ag/AgCl (3M KCl) reference electrode and a platinum-wire auxiliary electrode were also used. Before each measurements the glassy carbon electrode was polished manually with alumina (φ = 0.01_m) in the presence of bi-distilled water on a smooth polishing cloth. The data were treated with Microcal Origin (Ver. 5) software to transform the initial signal. A Mettler balance (Toledo-AB104) was used for weighing the solid materials. A cyberscan 500 digital (EUTECH Instruments, USA) pH-meter with a glass combination electrode was served to carry out pH measurements. A micropipette (Eppendorf-multipette® Plus) was used throughout the present experimental work. Deionized water used throughout the present study was supplied from a Purite still plus deionized connected to a Hamilton-Aqua-Matic deionized water system.
Test solution
Ten tablets of Zyprexa and Seroquel, were weighed, and the average mass per tablet was determined. A weighed portion of a finely grounded powder equivalent to the calculated weight of pharmaceutical preparations was dissolved to produce a 1 × 10⁻³ M solution. The solution was then filtered through a 0.45 mm Millipore filter, in order to separate out the insoluble excipients, and reject the first portion of the filtrate. The solution was directly analyzed, according to the general analytical procedures without the necessity for sample pretreatment or any extraction step.
Biological sampling
Accurately measured aliquots of OLZ, and QUT solutions were pipetted into centrifugation tubes containing 500 μl human urine or plasma, then vortex was done for 5 min. Into each tube, 0.5 ml of methanol, 0.1 ml NaOH (0.1 M), 0.5 ml ZnSO4.7 H2O (5% w/v),25 were added, then centrifuged for 8 min at 4000 rpm. The clear supernatant layer was filtered through 0.45 μm Milli-pore filter. A 0.1 ml of the supernatant liquor was transferred into the voltammetric cell then completed to 10 ml with a pH 2.0 BR buffer. Then, OLZ, and QUT were quantified by means of the proposed voltammetric procedure.
Voltammetric analyses
Voltammetric analyses were performed in 25 ml of BR buffer. The solution was continuously stirred at 1200 rpm when accumulation was applied for a certain time and potential to the working electrode. At the end of accumulation, the stirring was stopped and a 5 sec rest period was allowed for the solution to become quiescent. The used drug was determined by using Cyclic CV and differential pulse voltammetry DPV methods. Aliquots of the drug solution were introduced into the electrolytic cell and the procedures were repeated. The voltammograms were recorded. The peak current was evaluated as the difference between each voltammogram and the background electrolyte voltammogram. All data were obtained were carried out at room temperature.
Results and Discussion
Influence of the Type and pH of the Supporting Electrolyte
The effect of different supporting buffers (B-R, acetate, borate, citrate and phosphate) on the current response of OLZ, and QUT were studied in order to assess their impact on the monitored electroanalytical signal. The best results with respect to sensitivity accompanied with sharper response were obtained with B-R.
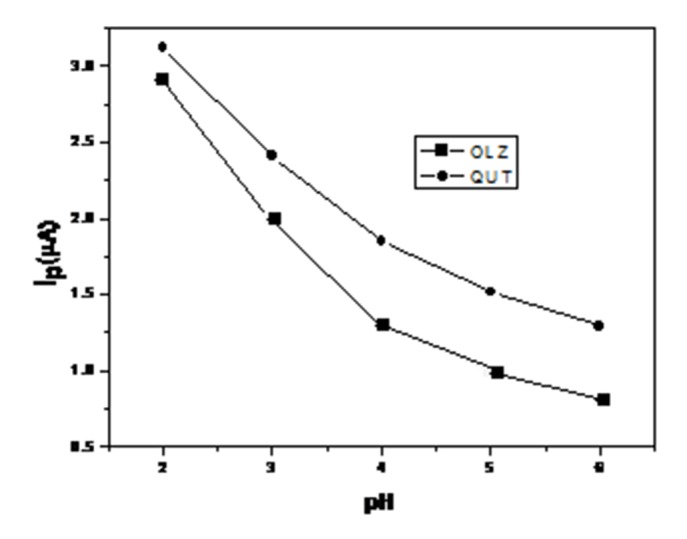
Anodic cyclic voltammogram peaks for the oxidation of 1 × 10⁻⁵M of OLZ and QUT in B–R buffer of pH 2-6 at GCE was studied. The pH of the electrolyte medium is one of the variables that commonly and strongly influence the shape of the voltammogram, and therefore it was important to investigate the effect of the pH on the electrochemical behavior of the drugs. Definite anodic peaks, corresponding to oxidation of the used drugs, were observed at +0.60 and +0.65 V for OLZ and QUT, Figure 2. In a forward scan, a single anodic peak was observed with no cathodic peak in the reverse sweep, which indicates that the oxidation process of OLZ and QUT is irreversible. The graph of Ip vs. pH (Figure 2) revealed that the peak current decreases from pH 2.0 to 5.0. The decreasing in magnitude is related to interaction between the electrode surface and the positive charge of nitrogen atom. After the pKa value, there is no charge and the intensity is almost the same from pH 5 to 12.
Figure 2.

The effect of pH on the peak current in a B-R buffer.
Effect of the Scan Rate
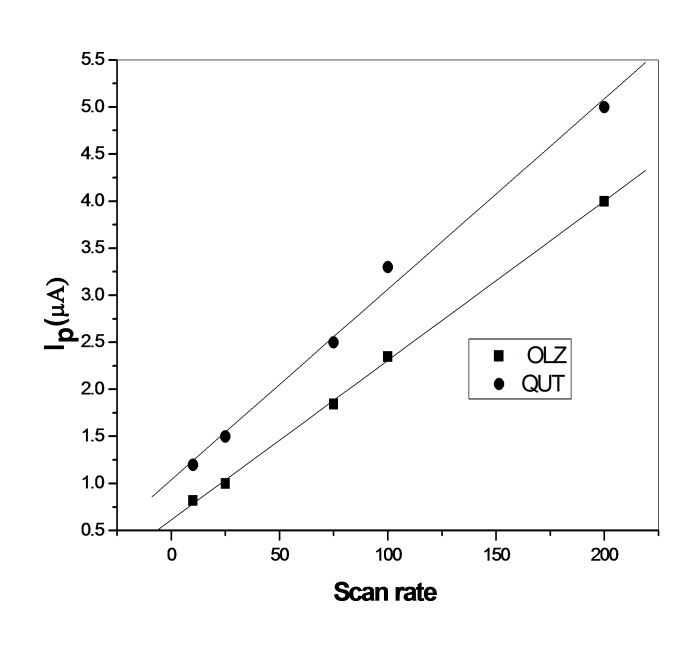
The influence of the scan rate on the peak current (Ip) was studied Figure 3 within the range 10 – 200 mV s–1 for OLZ and QUT. The peak potential moves to a more positive potential with increasing the scan rate, which confirms the irreversibility of the process. A plot of the peak current versus scan rate for OLZ and QUT gave a straight line. linear relationship between log Ip and log υ over the scan range 10-200 mV s-1 with slope values of 0.51 , 0.47 is close to the theoretically expected value of 0.50 for a diffusion controlled process.26
Figure 3.
Anodic peak current response of (1 × 10⁻⁶M) OLZ and QUT as a function of the scan rate (mV/S) at a GCE.
Effect of Instrumental Parameters
It was found that the peak current was increased with the increasing pulse amplitude and scan rate, while it decreased with the increasing pulse width. To obtain relatively high and narrow peaks the values of 50 mV, 30 ms, and 10 mV s-1 were finally chosen for pulse amplitude, pulse width and scan rate, respectively.
Interferences
The tolerance limit was defined as the maximum concentration of the interfering substances that caused an error less than ±2%. Under optimized experimental conditions, the effects of potential interferents on the voltammetric response of 3.4 g/mL OLZ and QUT as a standard at GCE were evaluated. The experimental results show that 200-fold concentration of glucose, starch, lactic acid, dextrose, talk, gum acacia, magnesium stearate and ascorbic acid did not interfere. In brief proposed method has good selectivity for determination of OLZ and QUT.
Analytical Applications: Validation of the Proposed Method
In order to develop a voltammetric methodology for determining the drugs, we selected the DPV mode, since the peaks were sharper and better-defined at lower concentration of OLZ and QUT than those obtained by cyclic voltammetry, with a lower background current, resulting in improved resolution. The peak potential versus pH plots were similar to that obtained by cyclic voltammetry for DPV. According to the obtained results, it was possible to apply these techniques to the quantitative analysis of OLZ and QUT. The precision of the method was evaluated by repeating six experiments on the same day and in the same standard solution (repeatability) and over 6 days from the different standard solutions (reproducibility).27 For these studies, 1 × 10⁻⁷ M OLZ and QUT standard solutions were used. The results were given as shown in Table 1.
Table 1. Characteristics of OLZ and QUT calibration plots.
| Parameters | OLZ | QUT |
| Linearity range (M) | 3 ×10⁻⁸ M to 4 × 10⁻⁶ | 2 × 10⁻⁸ - 5 × 10 -6 |
| Correlation Coefficient | 0.9970 | 0.9956 |
| (R.S.D., %) | 1.4 | 1.1 |
| LOD (M) | 1 × 10⁻⁸ | 1 × 10⁻⁸ |
| LOQ (M) | 3 × 10⁻⁸ | 3 × 10⁻⁸ |
| Repeatability (%) | 98.5 | 99.1 |
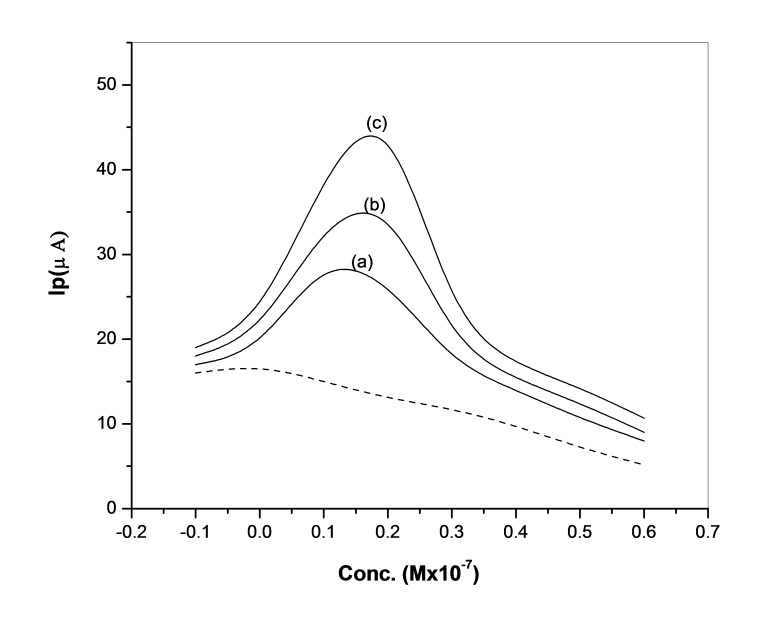
In order to provide the DPV quantitative procedure, the dependence of the peak current on the drugs concentration was investigated. Using the optimum conditions described linear calibration curves was obtained in Figure 4.
Figure 4.
Anodic differential voltammogrames of OLZ at scan rate 10 mV s-1 with concentrations (a) 0.4 (b) 0.8 (c) 1.2 × 10⁻⁷ M , The (---) line represents the blank BR.
The characteristics of these graphs were as shown in Table 1. Related statistical data of the calibration curves were obtained from three different calibration curves. The limit of detection (LOD) and quantification (LOQ) were also as shown in Table 1. The LOD and LOQ were calculated on the peak current using the following equations:
LOD = 3s/m LOQ = 10s/m
Where s is the standard deviation and m is the slope of the calibration curve.27 Sample solutions recorded after 48 h did not show any appreciable change in the assay values.
The F- and student t-test were carried out on the data and statistically examined the validity of the obtained results. At the 95% of the confidence level, the values of t- and F-tests (calculated from the experiments) were less than that of theoretical t- and F-tests values showing that there is no significative difference between the proposed DPV method and reference HPLC method.
The reproducibility was evaluated in terms of repeatability and between-day reproducibility. The coefficient of variation (cv) of ten consecutive measurements of the peak current corresponding to an OLZ and QUT concentration of 1× 10⁻⁷ mol/L was calculated as 0.5 and 0.7%, for three times in four successive days which demonstrates the good repeatability of the voltammetric method.
The robustness28 of the results of the procedure is the ability to remain unaffected by small changes in its operational parameters, such as the pH. In the present work, this was examined by studying the effect of a variation of pH (2.0 –2.7). The recovery values were not significantly affected by these variations and consequently the optimized procedure was reliable for the assay of drugs. It could be robust. The ruggedness is the degree of reproducibility of the results obtained by analysis of the same sample under a variety of normal test conditions, such as different laboratories, different analysts, and different lots of reagents, Table 2. This was examined by applying the proposed procedures to an assay under experimental conditions using two different analysts. The result obtained due to lab. (1) to lab. (2) and even day to day were found to be reproducible, since there is no significant difference between the recovery and the SD values.
Table 2. The robustness and ruggedness of the conditions of the proposed procedure for determination of OLZ and QUT.
| Variables | Drug | Recovery % ±RSD |
|
Robustness results at pH =2.5 |
OLZ | 98.0 ± 0.60 |
| QUT | 98.7 ± 0.70 | |
|
Ruggedness Analyst 1 |
OLZ | 98.4 ± 0.60 |
| QUT | 98.9 ± 0.50 | |
|
Ruggedness Analyst 2 |
OLZ | 98.1 ± 0.60 |
| QUT | 99.0 ± 0.70 |
Determination of OLZ and QUT in Tablets
The proposed analysis procedure was successfully applied for the assay of OLZ and QUT in their pharmaceutical formulations. For this reason the HPLC methods8,12 were used for comparison and for the reliability of the developed procedures. The results obtained for the formulation are listed in Table 3 and compared with the HPLC method which has been described in the literature.
Table 3. Statistical evaluation for Assay of OLZ and QUT in pharmaceutical dosage forms by the proposed and official methods.
| Sample | % Found | Proposed method (%±RSD, n = 5) | Reported method(%± RSD) | F - testa | t- testa |
| OLZ(Zyprexa) 5 mg\tab | 98.8 | 98.8 ± 0.50 | 98.7 ± 0.42 | 1.60 | 0.60 |
| QUT (Seroquel) 25 mg\tab | 98.1 | 99.0 ± 0.40 | 98.7 ± 0.55 | 1.30 | 0.80 |
| (a) Theoretical values of F and t - test at 95% confidence limit (n = 5) are 6.39 and 2.61, respectively. | |||||
Determination of Spiked Biological Samples
The modified DPV method could be successfully applied to the determination of the investigated drugs in spiked urine and serum. Calibration curves were constructed by using the standard addition method of the prepared spiked samples. The percent recoveries in spiked urine were 98.2 ±0.42, and 98.0 ±0.65, while in spiked serum were 96.7 ±0.75 and 97.0 ± 0.58 for OLZ and QUT, respectively (Table 4).
Table 4. Statistical evaluation for Assay of OLZ and QUT in biological fluids.
|
Proposed method with GCE in spiked urine |
Proposed method with GCE in spiked serum |
|
| OLZ | 98.2 ±0.42 | 96.7 ±0.75 |
| QUT | 98.0 ±0.65 | 97.0 ± 0.58 |
Conclusion
This paper on the electrochemical behavior of OLZ and QUT at glassy carbon electrode has described how the compound is irreversibly oxidized at positive potentials. voltammetric technique has been developed for the determination of OLZ and QUT in pharmaceutical dosage forms and biological samples. Application of the DPV technique to pharmaceuticals is possible after a simple dilution step. The principal advantage of the proposed methods, over the published HPLC procedures, is that the excipients do not interfere and the separation procedure is not necessary. The methods are rapid, requiring <5 min to run sample and involves no sample preparation other than dissolving and transferring an aliquot to the supporting electrolyte.
Conflict of Interest
The authors report no conflicts of interest.
References
- 1.Dossenbach MR, Folnegovic-Smalc V, Hotujac L, Uglesic B, Tollefson GD, Grundy SL. et al. Double-blind, randomized comparison of olanzapine versus fluphenazine in the long-term treatment of schizophrenia. Prog Neuropsychopharmacol Biol Psychiatry. 2004;28(2):311–8. doi: 10.1016/j.pnpbp.2003.10.010. [DOI] [PubMed] [Google Scholar]
- 2.Heresco-Levy U, Ermilov M, Lichtenberg P, Bar G, Javitt DC. High-dose glycine added to olanzapine and risperidone for the treatment of schizophrenia. Biol Psychiatry. 2004;55(2):165–71. doi: 10.1016/s0006-3223(03)00707-8. [DOI] [PubMed] [Google Scholar]
- 3.Sclar DA, Skaer TL, Robison LM, Dickson WM, Markowitz JS, DeVane CL. Use and cost patterns of risperidone versus olanzapine for the treatment of schizophrenia: An assessment of medicaid children and adolescents age 5-18 years. Eur Neuropsychopharmacol. 2003;13:S281–S2. [Google Scholar]
- 4.Worrel JA, Marken PA, Beckman SE, Ruehter VL. Atypical antipsychotic agents: a critical review. Am J Health Syst Pharm. 2000;57(3):238–55. doi: 10.1093/ajhp/57.3.238. [DOI] [PubMed] [Google Scholar]
- 5.Gefvert O, Bergstrom M, Langstrom B, Lundberg T, Lindstrom L, Yates R. Time course of central nervous dopamine-D2 and 5-HT2 receptor blockade and plasma drug concentrations after discontinuation of quetiapine (Seroquel) in patients with schizophrenia. Psychopharmacology (Berl) 1998;135(2):119–26. doi: 10.1007/s002130050492. [DOI] [PubMed] [Google Scholar]
- 6.Jasinska A, Nalewajko E. Batch and flow-injection methods for the spectrophotometric determination of olanzapine. Anal Chim Acta. 2004;508(2):165–70. [Google Scholar]
- 7.Raggi MA, Casamenti G, Mandrioli R, Izzo G, Kenndler E. Quantitation of olanzapine in tablets by HPLC, CZE, derivative spectrometry and linear voltammetry. J Pharm Biomed Anal. 2000;23(6):973–81. doi: 10.1016/s0731-7085(00)00382-4. [DOI] [PubMed] [Google Scholar]
- 8.Pujadas M, Pichini S, Civit E, Santamarina E, Perez K, De La Torre R. A simple and reliable procedure for the determination of psychoactive drugs in oral fluid by gas chromatography-mass spectrometry. J Pharm Biomed Anal. 2007;44(2):594–601. doi: 10.1016/j.jpba.2007.02.022. [DOI] [PubMed] [Google Scholar]
- 9.Sanchez TC, Martinez MA, Almarza EA. Determination of several psychiatric drugs in whole blood using capillary gas–liquid chromatography with nitrogen phosphorus detection: comparison of two solid phase extraction procedures. Forensic Sci Int. 2005;155(2-3):193–204. doi: 10.1016/j.forsciint.2004.12.007. [DOI] [PubMed] [Google Scholar]
- 10.Mandrioli R, Fanali S, Ferranti A, Raggi MA. HPLC analysis of the novel antipsychotic drug quetiapine in human plasma. J Pharm Biomed Anal. 2002;30(4):969–77. doi: 10.1016/s0731-7085(02)00395-3. [DOI] [PubMed] [Google Scholar]
- 11.Yuan SL, Li XF, Jiang XM, Zhang HX, Zheng SK. Simultaneous Determination of 13 Psychiatric Pharmaceuticals in Sewage by Automated Solid Phase Extraction and Liquid Chromatography-Mass Spectrometry. Chinese J Anal Chem. 2013;41(1):49–56. [Google Scholar]
- 12.Bellomarino SA, Brown AJ, Conlan XA, Barnett NW. Preliminary evaluation of monolithic column high-performance liquid chromatography with tris(2,2'-bipyridyl)ruthenium(II) chemiluminescence detection for the determination of quetiapine in human body fluids. Talanta. 2009;77(5):1873–6. doi: 10.1016/j.talanta.2008.10.023. [DOI] [PubMed] [Google Scholar]
- 13.Zhang G, Terry AV Jr., Bartlett MG. Sensitive liquid chromatography/tandem mass spectrometry method for the simultaneous determination of olanzapine, risperidone, 9-hydroxyrisperidone, clozapine, haloperidol and ziprasidone in rat brain tissue. J Chromatogr B Analyt Technol Biomed Life Sci. 2007;858(1-2):276–81. doi: 10.1016/j.jchromb.2007.08.007. [DOI] [PMC free article] [PubMed] [Google Scholar]
- 14.D'arrigo C, Migliardi G, Santoro V, Spina E. Determination of olanzapine in human plasma by reversed-phase high-performance liquid chromatography with ultraviolet detection. Ther Drug Monit. 2006;28(3):388–93. doi: 10.1097/01.ftd.0000211800.66569.c9. [DOI] [PubMed] [Google Scholar]
- 15.Nirogi RV, Kandikere VN, Shukla M, Mudigonda K, Maurya S, Boosi R. et al. Development and validation of a sensitive liquid chromatography/electrospray tandem mass spectrometry assay for the quantification of olanzapine in human plasma. J Pharm Biomed Anal. 2006;41(3):935–42. doi: 10.1016/j.jpba.2006.01.040. [DOI] [PubMed] [Google Scholar]
- 16.Kirchherr H, Kuhn-Velten WN. Quantitative determination of forty-eight antidepressants and antipsychotics in human serum by HPLC tandem mass spectrometry: a multi-level, single-sample approach. J Chromatogr B Analyt Technol Biomed Life Sci. 2006;843(1):100–13. doi: 10.1016/j.jchromb.2006.05.031. [DOI] [PubMed] [Google Scholar]
- 17.Izzo G, Raggi MA, Maichel B, Kenndler E. Separation of olanzapine, carbamazepine and their main metabolites by capillary electrophoresis with pseudo-stationary phases. J Chromatogr B Biomed Sci Appl. 2001;752(1):47–53. doi: 10.1016/s0378-4347(00)00514-4. [DOI] [PubMed] [Google Scholar]
- 18.Spangenberg B, Selgel A, Kempf J, Weinmann W. Forensic drug analysis by means of diode-array HPTLC using R F and UV library search. J Planar Chromat Mod TLC. 2005;18(5):336–43. [Google Scholar]
- 19.Polla GI, Vega DR, Lanza H, Tombari DG, Baggio R, Ayala AP. et al. Thermal behaviour and stability in Olanzapine. Int J Pharm. 2005;301(1-2):33–40. doi: 10.1016/j.ijpharm.2005.05.035. [DOI] [PubMed] [Google Scholar]
- 20.Sudha Lakshmi PB, Rambabu C. Use of Ion-Association Reactions for the Spectrophotometric Determination of Quetiapine. Asian J Chem. 2012;24(8):3521–3. [Google Scholar]
- 21.Vinay KB, Revanasiddappa HD. Spectrophotometric determination of quetiapine fumarate through ion-pair complexation reaction with tropaeolin ooo. Indian J Chem Technol. 2012;19(3):205–12. [Google Scholar]
- 22.Rajendraprasad N, Basavaiah K, Vinay KB. Extractive Spectrophotometric Determination of Quetiapine Fumarate in Pharmaceuticals and Spiked Human Urine. Croat Chem Acta. 2012;85(1):9–17. [Google Scholar]
- 23.El-Shal MA, Attia AK. Adsorptive Stripping Voltammetric Behavior and Determination of Zolmitriptan Using Differential Pulse and Square Wave Voltammetry. Anal Bioanal Electrochem. 2013;5(1):32–45. [Google Scholar]
- 24.Uslu B, Özkan SA, Sentürk Z. Electrooxidation of the antiviral drug valacyclovir and its square-wave and differential pulse voltammetric determination in pharmaceuticals and human biological fluids. Anal Chim Acta. 2006;555(2):341–7. [Google Scholar]
- 25.Al-Ghamdi AH, Al-Ghamdi AF, Al-Omar MA. Electrochemical studies and square-wave adsorptive stripping voltammetry of spironolactone drug. Anal Lett. 2008;41(1):90–103. [Google Scholar]
- 26.Gosser DK. Cyclic Voltammetry Simulation and Analysis of Reaction mechanism. New York: VSH; 1994. [Google Scholar]
- 27.Swartz E, Krull IS. Analytical Method Development and Validation. New York: Marcel Dekker; 1997. [Google Scholar]
- 28.USP 26, The United States Pharmacopoeia. The National Formularly, Rockville, MD, 2003; 2442.


