

Abstract
The objective of the study was to identify the profile of circulating C19MC microRNAs (miR-516-5p, miR-517∗, miR-518b, miR-520a∗, miR-520h, miR-525, and miR-526a) in patients with established preeclampsia (n = 63), fetal growth restriction (n = 27), and gestational hypertension (n = 23). We examined the correlation between plasmatic concentrations and expression levels of microRNAs and the severity of the disease with respect to clinical signs, requirements for the delivery, and Doppler ultrasound parameters. Using absolute and relative quantification approaches, increased extracellular C19MC microRNA levels (miR-516-5p, P = 0.037, P = 0.009; miR-517∗, P = 0.033, P = 0.043; miR-520a∗, P = 0.001, P = 0.009; miR-525, P = 0.026, P = 0.01; miR-526a, P = 0.03, P = 0.035) were detected in patients with preeclampsia. The association analysis pointed to no relationship between C19MC microRNA plasmatic concentrations and expression profile and identified risk factors for a poorer perinatal outcome. However, the dependence between the levels of plasmatic C19MC microRNAs and the pulsatility index in the middle cerebral artery and the values of cerebroplacental ratio was demonstrated. The study brought the interesting finding that the upregulation of miR-516-5p, miR-517∗, miR-520a∗, miR-525, and miR-526a is a characteristic phenomenon of established preeclampsia.
1. Introduction
Normal pregnancy is associated with a systemic inflammatory response. Many of the physiologic changes of normal pregnancy are part of an acute-phase reaction, which is generated by an inflammatory response. The placenta is the proximal cause of these problems [1]. Since the placenta is being continuously remodelled during normal placental development, extracellular nucleic acids of both fetal and placental origin, packed into either trophoblast-derived apoptotic bodies or shedding syncytiotrophoblast microparticles, may be detected in maternal circulation during the course of normal gestation [2–6].
Circulating syncytiotrophoblast debris has been hypothesized to contribute to maternal inflammation and some of the features of the maternal syndrome [7]. Signs of maternal inflammation which appear to be present in normal pregnancies at term are exaggerated in preeclampsia (PE) and fetal growth restriction (FGR) and can account for their clinical features [1, 8].
Preeclampsia and fetal growth restriction (FGR) are major complications affecting about 2–10% of pregnancies responsible for maternal and perinatal morbidity and mortality [9, 10]. Preeclampsia usually develops after 20 weeks of gestation and is characterized by chronic or gestational hypertension combined with proteinuria, which results from defective placentation eliciting inadequate uteroplacental blood perfusion and ischemia [8, 11, 12]. The causes of preeclampsia and FGR remain unknown. Trophoblastic debris and the microparticles shed during normal pregnancy are proinflammatory and this process is amplified in preeclampsia [13]. A hypoxic environment induces excessive trophoblast cell death and increased shedding of placenta debris into the maternal circulation; as a result, placental insufficiency related pregnancy complications are associated with abnormal levels of extracellular fetal DNA and mRNA transcripts [5, 14].
Recent evidence suggests that preeclampsia can be further subdivided into early PE (before 34 weeks of gestation), intermediate PE (between 34 and 37 weeks of gestation), and late PE (after 37 weeks of gestation) [15, 16]. The concept of early and late PE is modern, and it is widely accepted that these two entities have different etiologies and should be regarded as different forms of the disease, where early onsets of PE and IUGR are considered to be placenta-mediated diseases [17–19].
There has been a trend over the last 10 years to develop noninvasive methods utilizing quantification of cell-free nucleic acids inclusive of microRNAs in maternal circulation [6, 20–39]. The diagnostic potential of particular molecular biomarkers and their implementation in the current predictive and diagnostic algorithms for pregnancy related complications is subject of interest [6].
MicroRNAs belong to a family of small noncoding RNAs that regulate gene expression at the posttranscriptional level by degrading or blocking translation of messenger RNA (mRNA) targets [40, 41].
Recent studies have shown that preeclampsia is associated with alterations in extracellular microRNA expression. Using real-time PCR analysis, Gunel et al. [42] demonstrated the upregulation of miR-210 and downregulation of miR-152 in patients with preeclampsia. The application of next generation sequencing technology revealed a broader profile of dysregulated circulating microRNAs in preeclampsia. Compared to controls, 15 microRNAs were found to be upregulated (miR-521, miR-520h, miR-517c, miR-519d, miR-520g, miR-517b, miR-542-3p, miR-136, let-7f-1*, miR-518e, let-7a*, miR-125b, miR-125 a-5p, miR-519a, and miR-29a) and 7 microRNAs were found to be downregulated (let-7f, miR-223, miR-1260, let-7d, miR-320c, miR-185, and miR-1272) in four examined preeclamptic serum samples [43].
Later, using microarray analysis Wu et al. [44] reported the upregulation of 13 microRNAs (miR-574-5p, miR-26a, miR-151-3p, miR-130a, miR-181a, miR-130b, miR-30d, miR-145, miR-103, miR-425, miR-221, miR-342-3p, and miR-24) and down-regulation of 2 microRNAs (miR-144, miR-16) in patients with severe preeclampsia. Seven of these 13 microRNAs (miR-574-5p, miR-26a, miR-130b, miR-181a, miR-342-3p, miR-103, and miR-24) were validated by real-time PCR analysis to be elevated in plasma from severe preeclamptic pregnancies.
In a small-scale analysis, Mouillet et al. [45] did not observe any differentiation between pregnancies with normal and fetal growth restricted fetuses when compared circulating microRNA expression levels (miR-27a, miR-30d, miR-141, miR-200c, miR-205, miR-424, miR-451, miR-491, miR-517a, miR-518b, miR-518e, and miR-524).
However, most of investigators focused on the study of those microRNAs, whose genes are located outside chromosome 19 miRNA clusters (C19MC and miR-371-3 cluster) or the chromosome 14 miRNA cluster (C14MC) that encode pregnancy-associated microRNAs [46–50].
We have previously identified C19MC microRNAs (miR-516-5p, miR-517*, miR-518b, miR-520a*, miR-520h, miR-525, and miR-526a) present in maternal plasma differentiating between normal pregnancies and nonpregnant individuals [51]. We selected from the chromosome 19 microRNA cluster, which involves 46 microRNA genes altogether, [48–50, 52] preferentially those microRNAs that were previously demonstrated to be exclusively expressed in placental tissues (miR-520a*, miR-516-5p, miR-517*, miR-518b, miR-519a, miR-524-5p, miR-525, miR-526a, miR-526b, and miR-520h) and those microRNAs that were reported to be highly expressed in placental tissues (miR-512-5p, miR-515-5p, miR-518f*, miR-519d, and miR-519e*) [51, 53, 54].
Later, we demonstrated significant increases in extracellular C19MC microRNAs levels (miR-516-5p, miR-517*, miR-518b, miR-520a*, miR-520h, miR-525, and miR-526a) over time in normally progressing pregnancies [51, 54].
The results of our pilot study indicated no differentiation between normal and complicated pregnancies, but could not come to definitive conclusions due to the low number of studied subjects involved [51, 54]. The current study is a followup of our previous studies [51, 54] and describes comprehensively for the first time the expression profile of circulating C19MC microRNAs (miR-516-5p, miR-517*, miR-518b, miR-520a*, miR-520h, miR-525, and miR-526a) in the entirely new sample set of patients with clinically established preeclampsia and/or fetal growth restriction. To our knowledge, no study describing the profile of circulating C19MC microRNAs in gestational hypertension has been carried out.
2. Materials and Methods
2.1. Patients
The studied cohort consisted of Caucasian women involving 63 preeclampsia (PE) w or w/o fetal growth restriction (FGR), 27 FGR, 23 gestational hypertension (GH), and 55 controls. Twenty-four women had signs of mild preeclampsia, 39 women were diagnosed with severe preeclampsia, 24 preeclamptic patients required the delivery before 34 weeks of gestation and 39 patients delivered after 34 weeks of gestation. In 18 cases, preeclampsia superposed on previous hypertension; otherwise, it occurred in normotensive patients (45 cases). Eight growth-retarded foetuses were delivered before 34 weeks of gestation and 19 those after 34 weeks of gestation. Oligohydramnios or anhydramnios were present in 7 growth restricted foetuses.
Doppler studies showed an abnormal pulsatility index (PI) in the umbilical artery (14 preeclampsia ± FGR and 14 FGR) and/or in the middle cerebral artery (10 preeclampsia ± FGR and 11 FGR). Cerebroplacental ratio (CPR), expressed as a ratio between umbilical artery and middle cerebral artery pulsatility index, was below the fifth percentile in 21 cases (9 preeclampsia ± FGR and 12 FGR). Absent or reversed enddiastolic velocity waveforms in the umbilical artery occurred in 8 cases (2 preeclampsia + FGR and 6 FGR).
Normal pregnancies were defined as those without complications who delivered full term, singleton, healthy infants weighting >2500 g after 37 completed weeks of gestation. Preeclampsia was defined as blood pressure >140/90 mmHg in two determinations 4 hours apart that was associated with proteinuria >300 mg/24 h after 20 weeks of gestation. Severe preeclampsia was diagnosed by the presence of one or more of the findings according to the guidelines of ACOG Committee [11].
Fetal growth restriction was diagnosed when the estimated fetal weight (EFW), calculated using the Hadlock formula (Astraia Software GmbH), was below the tenth percentile for the evaluated gestational age.
Gestational hypertension was defined as high blood pressure that developed after the twentieth week of pregnancy.
All patients provided written informed consent. The study was approved by the Ethics Committee of the Third Faculty of Medicine, Charles University in Prague. The samples for the study were chosen on the basis of equal times in storage and gestation age. Gestational age was assessed using ultrasonography.
2.2. Processing of Samples
Nine millilitres of peripheral blood were collected into EDTA tubes and centrifuged twice at 1200 g for 10 min at room temperature. Plasma samples were stored at −80°C until subsequent processing.
Total RNA was extracted from 1 mL of plasma and 25 mg of normal placental tissue preserved in RNAlater (Ambion, Austin, USA) followed by an enrichment procedure for small RNAs using a mirVana microRNA Isolation kit (Ambion, Austin, USA). Trizol LS reagent was used in plasma samples for total RNA extraction from biological fluids (Invitrogen, Carlsbad, USA) and preceded the small RNAs enrichment procedure. To minimize DNA contamination, we treated the eluted RNA with 5 µL of DNase I (Fermentas International, ON, Canada) for 30 min at 37°C.
2.3. Reverse Transcriptase Reaction
Each microRNA was reverse-transcribed into complementary DNA using TaqMan MicroRNA Assay, containing microRNA-specific stem-loop RT primers (Table 1), and TaqMan MicroRNA Reverse Transcription Kit (Applied Biosystems, Branchburg, USA) in a total reaction volume of 50 µL on a 7500 real-time PCR system (Applied Biosystems, Branchburg, USA) with the following thermal cycling parameters: 30 minutes at 16°C, 30 minutes at 42°C, 5 minutes at 85°C, and then held at 4°C.
Table 1.
Correlation between Doppler ultrasonography parameters and C19MC microRNAs expression levels and plasmatic concentrations.
| Spearman's rank correlation | ||||||||||||
|---|---|---|---|---|---|---|---|---|---|---|---|---|
| Absolute quantification | Relative quantification | |||||||||||
| A. umbilicalis PI | Middle cerebral artery PI | Cerebroplacental ratio | A. umbilicalis PI | Middle cerebral artery PI | Cerebroplacental ratio | |||||||
| ρ | P | ρ | P | ρ | P | ρ | P | ρ | P | ρ | P | |
| miR-516-5p | −0.023 | 0.845 | −0.393 | 0.005 | −0.219 | 0.125 | −0.040 | 0.736 | −0.307 | 0.030 | −0.190 | 0.183 |
| miR-517* | 0.032 | 0.791 | −0.328 | 0.020 | −0.215 | 0.131 | 0.073 | 0.542 | −0.288 | 0.041 | −0.269 | 0.060 |
| miR-518b | −0.025 | 0.834 | −0.152 | 0.269 | −0.074 | 0.606 | −0.019 | 0.872 | −0.220 | 0.120 | −0.167 | 0.242 |
| miR-520a* | 0.092 | 0.441 | −0.314 | 0.027 | −0.261 | 0.050 | 0.085 | 0.477 | −0.339 | 0.017 | −0.339 | 0.018 |
| miR-520h | 0.016 | 0.893 | −0.238 | 0.093 | −0.178 | 0.214 | 0.038 | 0.748 | −0.256 | 0.071 | −0.219 | 0.126 |
| miR-525 | 0.009 | 0.941 | −0.358 | 0.011 | −0.190 | 0.183 | −0.028 | 0.812 | −0.357 | 0.012 | −0.185 | 0.194 |
| miR-526a | 0.156 | 0.196 | −0.304 | 0.032 | −0.340 | 0.017 | 0.131 | 0.277 | −0.286 | 0.043 | −0.329 | 0.021 |
The association between the plasmatic concentration (absolute quantification) and gene expression levels (relative quantification) of C19MC microRNAs and Doppler ultrasonography parameters such as arteria umbilicalis pulsatility index, middle cerebral artery pulsatility index, and cerebroplacental ratio.
PI: pulsatility index; ρ: Spearman's correlation coefficient; P: level of significance; bold font: statistically significant results.
2.4. Quantification of MicroRNAs
15 µL of cDNA corresponding to each microRNA was mixed with components of TaqMan MicroRNA Assay and the ingredients of the TaqMan Universal PCR Master Mix (Applied Biosystems, Branchburg, USA) in a total reaction volume of 35 µL. TaqMan PCR conditions were set as described in the TaqMan guidelines. The analysis was performed using a 7500 real-time PCR system. All PCRs were performed in duplicates. A sample was considered positive if the amplification signal occurred before the 40th threshold cycle. Concentrations of individual microRNAs were expressed as pg of total RNA enriched for small RNAs per millilitre of plasma.
The expression of particular microRNA in maternal plasma was determined using the comparative Ct method [55] relative to the expression of the same microRNA in the reference sample, randomly selected placenta derived from gestation with normal course.
RNA fraction highly enriched for small RNA isolated from the fetal part of the placenta (the part of the placenta derived from the chorionic sac that encloses the embryo, consisting of the chorionic plate and villi) was used to build-up the standard curves and as a reference sample for relative quantification throughout the study.
Synthetic C. elegans microRNA (cel-miR-39, Qiagen, Hilden, Germany) was used as an internal control for variations during the preparation of RNA, cDNA synthesis, and real-time PCR. Due to a lack of generally accepted standards, all experimental real-time qRT-PCR data were normalized to cel-miR-39, as it shows no sequence homology to any human microRNA. 1 µl of 0.1 nM cel-miR-39 was spiked in after incubation with Trizol LS reagent to the human plasma samples.
2.5. Statistical Analysis
MicroRNA levels were compared between groups by nonparametric tests (the Mann-Whitney U test for the comparison between two groups and the Kruskal-Wallis test for the comparison between three or more groups) using Statistica software (StatSoft Inc., USA). Correlation between variables including absolute and/or relative microRNA quantification and Doppler ultrasonography parameters (the pulsatility index in the umbilical artery, the pulsatility index in the middle cerebral artery, and the cerebroplacental ratio) was calculated using the Spearman's rank correlation coefficient (ρ). If it varies from −0.5 to 0, there is a weak negative correlation. The significance level was established at a P value of P < 0.05.
3. Results
3.1. Circulating C19MC MicroRNAs Differentiate between Complicated and Normal Pregnancies
Overall, increased plasmatic levels of miR-516-5p (P = 0.008), miR-517* (P = 0.003), miR-520a*. (P < 0.001), miR-525 (P = 0.003), and miR-526a (P = 0.004) were observed in women with pregnancy-related complications (gestational hypertension, preeclampsia and fetal growth restriction) compared to normal pregnancies.
Similarly, the difference in gene expression of circulating microRNAs between pregnancy-related complications and the control cohort (normal pregnancies) achieves statistical significance for miR-516-5p (P < 0.001), miR-517* (P = 0.005), miR-520a* (P = 0.001), miR-525 (P = 0.001), and miR-526a (P = 0.004).
3.2. Upregulation of Circulating C19MC MicroRNAs in Pregnancies with Established Preeclampsia
Consecutive detailed group analysis confirmed a difference in the levels of extracellular microRNAs in 5/5 C19MC microRNAs (miR-516-5p, P = 0.037; miR-517*, P = 0.015; miR-520a*, P = 0.003; miR-525, P = 0.026; and miR-526a, P = 0.032).
While plasmatic levels of microRNAs between the control cohort and the cohorts of patients with FGR and GH did not differ, increased levels were detected in the group of patients with established preeclampsia (miR-516-5p, P = 0.037; miR-517*, P = 0.033; miR-520a*, P = 0.001; miR-525, P = 0.026; and miR-526a, P = 0.030) (Figures 1(a)–1(e)).
Figure 1.
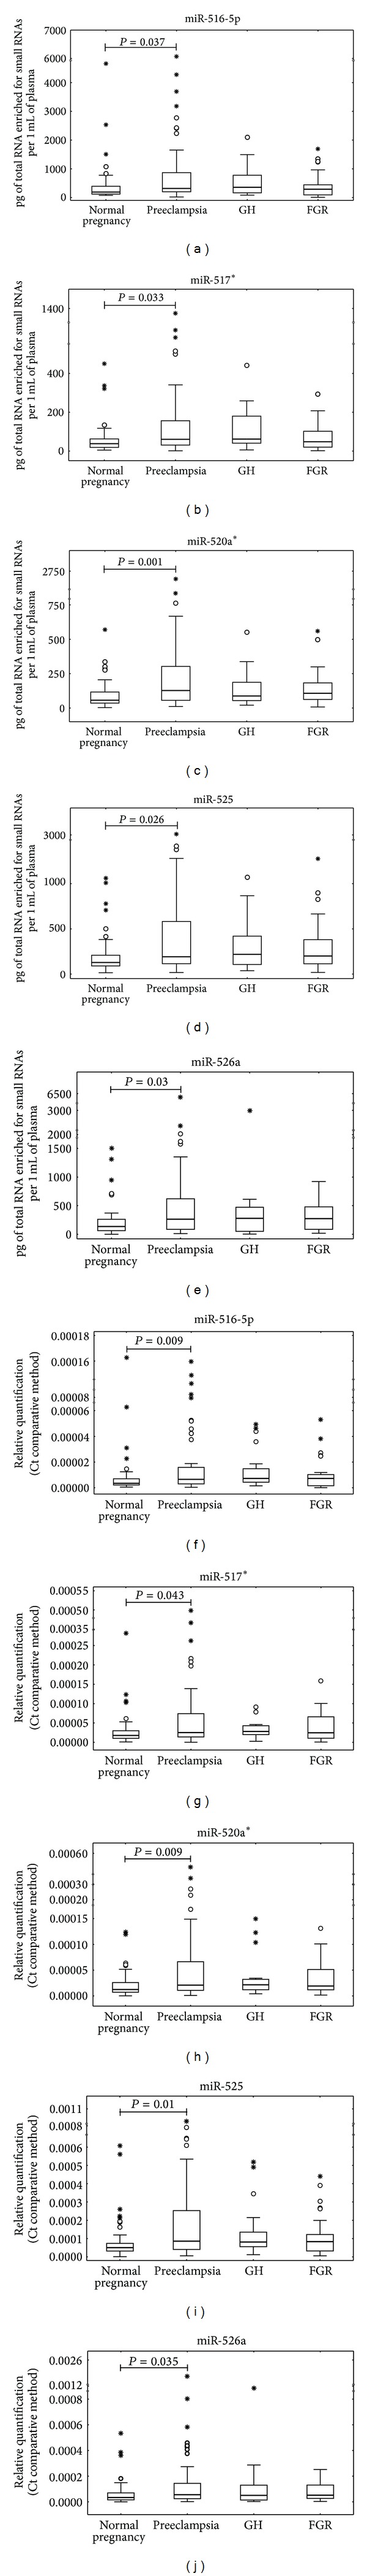
Upregulation of circulating C19MC microRNAs in pregnancies with preeclampsia. Absolute ((a), (b), (c), (d), and (e)) and relative ((f), (g), (h), (i), and (j)) quantification data were expressed as box plots of individual microRNAs in cohorts of normal and complicated pregnancies using Statistica software. The upper and lower limits of the boxes represent the 75th and 25th percentiles, respectively. The upper and lower whiskers represent the maximum and minimum values that are no more than 1.5 times the span of the interquartile range (range of the values between the 25th and the 75th percentiles). The median is indicated by the line in each box. Outliers are indicated by circles and extremes by asterisks.
Parallel, significant difference in microRNA gene expression was found between groups of preeclampsia, gestational hypertension, fetal growth restriction, and controls (miR-516-5p, P = 0.005; miR-517*, P = 0.028; miR-520a*, P = 0.011; miR-525, P = 0.01; miR-526a, P = 0.034). Again, while the expression of microRNAs between the control cohort, gestational hypertension, and fetal growth restriction did not differ, the highest expression was detected in the group of patients with preeclampsia (miR-516-5p, P = 0.009; miR-517*, P = 0.043; miR-520a*, P = 0.009; miR-525, P = 0.01; miR-526a, P = 0.035) (Figures 1(f)–1(j)).
3.3. The Association Study of Circulating C19MC MicroRNAs and the Severity of the Disease with respect to Clinical Signs and Requirements for the Delivery
Plasmatic concentrations and/or expression profile of C19MC microRNAs were analysed in relation to the severity of the disease with respect to the degree of clinical signs (mild and severe preeclampsia) and requirements for the delivery (before and after 34 weeks of gestation). No effect of the severity of the disease either on plasmatic C19MC microRNA concentrations (miR-516-5p, P = 0.396; miR-517*, P = 0.226; miR-520a*, P = 0.08; miR-525, P = 0.237; and miR-526a, P = 0.201) or C19MC microRNA expression levels (miR-516-5p, P = 0.476; miR-517*, P = 0.58; miR-520a*, P = 0.239; miR-525, P = 0.397; miR-526a, P = 0.646) was observed.
Further, the association between C19MC microRNA plasmatic levels and/or gene expression and the occurrence of previous hypertension in the cohort of patients with preeclampsia was determined. No difference between the group of preeclampsia superposed on chronic hypertension and/or gestational hypertension and the group of patients with unexpected onset of preeclampsia was revealed (absolute quantification: miR-516-5p, P = 0.885; miR-517*, P = 0.538; miR-520a*, P = 0.342; miR-525, P = 0.909; miR-526a, P = 0.273; relative quantification: miR-516-5p, P = 0.721; miR-517*, P = 0.621; miR-520a*, P = 0.885; miR-525, P = 0.568; miR-526a, P = 0.201).
3.4. The Association Study of Circulating C19MC Micrornas and the Severity of the Disease with respect to Doppler Ultrasonography Monitoring
The association between the plasmatic concentration and gene expression levels of C19MC microRNAs and Doppler ultrasonography parameters (the pulsatility index in the umbilical artery the pulsatility index in the middle cerebral artery, and the cerebroplacental ratio) was studied in the cohort of pregnancies complicated with preeclampsia and/or fetal growth restriction.
No difference within the group of complicated pregnancies with normal and abnormal values of flow rate in the umbilical artery was found out with the exception of miR-526a, which was upregulated in the group of patients with abnormal blood flow velocity waveforms (absolute quantification: P = 0.038; relative quantification: P = 0.05).
Further, the statistical analysis showed no effect of the pulsatility index in the middle cerebral artery and the cerebroplacental ratio on the plasmatic concentrations (A. cerebri media: P = 0.479, P = 0.826, P = 0.528, P = 0.625, P = 0.154; CPR: P = 0.426, P = 0.479, P = 0.443, P = 0.867, and P = 0.181) and expression levels (A. cerebri media: P = 0.826, P = 0.931, P = 0.427, P = 0.639, and P = 0.297; CPR: P = 0.517, P = 0.288, P = 0.198, P = 0.984, and P = 0.195) of all microRNAs (miR-516-5p, miR-517*, miR-520a*, miR-525, and miR-526a) that were identified to be upregulated in plasma samples derived from preeclampsia with or without fetal growth restriction.
The correlation between variables including absolute and/or relative quantification of particular microRNA in maternal plasma and the values of flow rate in the umbilical artery and the fetal blood vessel was calculated using Spearman's rank correlation coefficient. The pulsatility index in the umbilical artery did not show any correlation with microRNA plasmatic concentrations and/or microRNA gene expression. However, a weak negative correlation between the pulsatility index in the middle cerebral artery and microRNA plasmatic concentrations (miR-516-5p : ρ = −0.393, P = 0.005; miR-517*: ρ = −0.328, P = 0.020; miR-520a*: ρ = −0.314, P = 0.026; miR-525: ρ = −0.358, P = 0.011; miR-526a: ρ = −0.304, P = 0.031) or microRNA gene expression (miR-516-5p: ρ = −0.307, P = 0.030; miR-517*: ρ = −0.288, P = 0.041; miR-520a*: ρ = −0.339, P = 0.017; miR-525: ρ = −0.357, P = 0.012; miR-526a: ρ = −0.286, P = 0.043) was observed. Furthermore, a weak negative correlation between cerebroplacental ratio and microRNA plasmatic concentrations (miR-520a*: ρ = −0.261, P = 0.050; miR-526a: ρ = −0.340, P = 0.017; Figure 2(a)) or microRNA gene expression (miR-520a*: ρ = −0.339, P = 0.018; miR-526a: ρ = −0.329, P = 0.021; Figure 2(b)) was found (Table 1).
Figure 2.
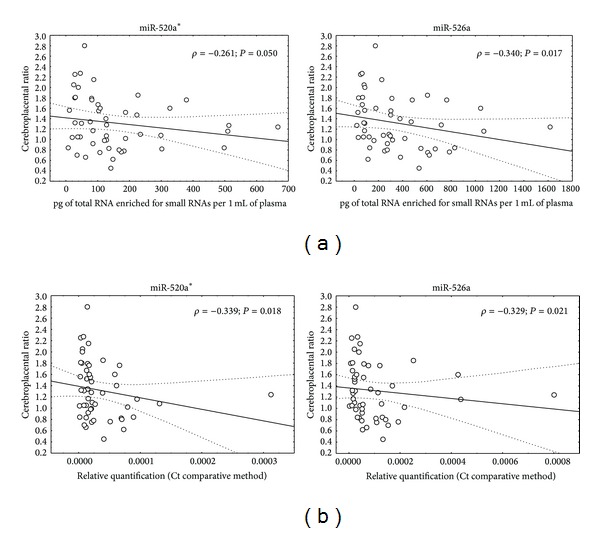
The association between the plasmatic concentration (a) and expression levels (b) of C19MC microRNAs and Doppler ultrasonography parameters. ρ: Spearman's correlation coefficient; P: level of significance.
3.5. Function and Functional Relationship Analysis of Target Genes of Differentially Expressed Extracellular C19MC MicroRNAs in Preeclampsia
The function and functional relationship analysis of predicted targets of the five elevated extracellular C19MC microRNAs in patients with established preeclampsia indicated that a large group of genes was connected to the regulation of the immune system and inflammatory response (Table 2). The data were collected from miRDB database (http://mirdb.org/miRDB/). All the targets were predicted by a bioinformatics tool MirTarget2, which was developed by analyzing thousands of genes impacted by miRNAs with an SVM learning machine.
Table 2.
(a) Function and functional relationship analysis of target genes of differentially expressed extracellular C19MC microRNAs in preeclampsia in relation to immune system response. (b) Function of target genes of differentially expressed extracellular C19MC microRNAs in preeclampsia in immune system response.
(a)
| microRNA | miR-516-5p | miR-517* | miR-526a | miR-525 | miR-520a* |
|---|---|---|---|---|---|
| Number of predicted target genes | 349 | 179 | 212 | 340 | 352 |
|
| |||||
| Unique target genes | Shared with miR-525 | ||||
|
| |||||
| CCR2 | FAS | BCAP29 | TOX | ACVR2B | |
| CD109 | IL6ST | CD24 | AHSA2 | ||
| CD1A | IL9R | CD302 | ATRN | ||
| DNAJC25 | IRAK3 | CFLAR | CD2 | ||
| FLT1 | LILRA2 | DNAJC21 | CD300LB | ||
| IL17RE | MTDH | HSP90AA1 | CD46 | ||
| IRAK1 | PAPPA | IGFBP1 | CD93 | ||
| LILRB5 | TLR2 | HSF5 | |||
| PDCD6IP | TNFRSF19 | IGF1R | |||
| SOCS2 | TNFSF15 | IL10RA | |||
| TRAF6 | MMD2 | ||||
| PPARA | |||||
| TLR7 | |||||
| VSIG4 | |||||
All the targets were predicted by a bioinformatics tool MirTarget2 using miRDB online database.
(b)
| Gene official symbol | Gene full name | The role in immune system response |
|---|---|---|
| ACVR2B | Activin A receptor, type IIB | Activins belong to the TGF-β superfamily |
|
| ||
| AHSA2 | AHA1, activator of heat shock 90 kDa protein ATPase homolog 2 (yeast) | Hsp90 is an inducible molecular chaperone protecting stressed cells |
|
| ||
| ATRN | Attractin | Involvement in initial immune cell clustering during inflammatory responses that may regulate the chemotactic activity of chemokines |
|
| ||
| BCAP29 | B-cell receptor-associated protein 29 | Involvement in CASP8-mediated apoptosis |
|
| ||
| CCR2 | Chemokine (C-C motif) receptor 2 | Binds monocyte chemoattractant protein-1 involved in monocyte infiltration during inflammation |
|
| ||
| CD109 | CD109 molecule | Encodes GPI-linked glycoprotein that negatively regulates signaling of TGF-β |
|
| ||
| CD1A | CD1a molecule | Encodes glycoproteins structurally related to MHC proteins mediating the presentation of lipid and glycolipid antigens |
|
| ||
| CD2 | CD2 molecule | A surface antigen of thymocytes, T, and NK cells |
|
| ||
| CD24 | CD24 molecule | Encodes a sialoglycoprotein expressed on mature granulocytes and B cells |
|
| ||
| CD300LB | CD300 molecule-like family member b | A nonclassical activating receptor of the Ig superfamily expressed on myeloid cells |
|
| ||
| CD302 | CD302 molecule | A C-type lectin receptor involved in cell adhesion, migration, endocytosis, and phagocytosis |
|
| ||
| CD46 | CD46 molecule, complement regulatory protein | Has cofactor activity for inactivation of complement components C3b and C4b by serum factor I |
|
| ||
| CD93 | CD93 molecule | Involvement in intercellular adhesion and in the clearance of apoptotic cells |
|
| ||
| CFLAR | CASP8 and FADD-like apoptosis regulator | Regulator of apoptosis structurally similar to caspase-8 |
|
| ||
| DNAJC21 | DnaJ (Hsp40) homolog, subfamily C, member 21 | A molecular chaperone protein protecting against cellular stress |
|
| ||
| DNAJC25 | DnaJ (Hsp40) homolog, subfamily C, member 25 | A molecular chaperone protein protecting against cellular stress |
|
| ||
| FAS | FAS cell surface death receptor (FAS) | Plays a central role in regulation of programmed cell death |
|
| ||
| FLT1 | fms-related tyrosine kinase 1 | A member of vascular endothelial growth factor receptor (VEGFR) playing an important role in angiogenesis and vasculogenesis |
|
| ||
| HSF5 | Heat shock transcription factor family member 5 | A transcriptional activator of heat shock genes |
|
| ||
| HSP90AA1 | Heat shock protein 90 kDa alpha (cytosolic), class A member 1 | An inducible molecular chaperone protecting stressed cells |
|
| ||
| IGF1R | Insulin-like growth factor 1 receptor | Antiapoptotic agent enhancing cell survival |
|
| ||
| IGFBP1 | Insulin-like growth factor binding protein 1 | Prolongs the half-time of IGFs in plasma that regulate cell growth and development |
|
| ||
| IL10RA | Interleukin 10 receptor, alpha | Involvement in inhibition of the synthesis of proinflammatory cytokines |
|
| ||
| IL17RE | Interleukin 17 receptor E | Participation in MAPK pathway |
|
| ||
| IL6ST | Interleukin 6 signal transducer (gp130, oncostatin M receptor) | A signal transducer shared by IL-6, LIF, and oncostatin M |
|
| ||
| IL9R | Interleukin 9 receptor | Mediates IL-9 effects like stimulation of cell proliferation and prevention of apoptosis |
|
| ||
| IRAK1 | Interleukin-1 receptor-associated kinase 1 | Responsible for IL-1 induced upregulation of the transcription factor NF-kappa B |
|
| ||
| IRAK3 | Interleukin-1 receptor-associated kinase 3 | Functions as a negative regulator of Toll-like receptor signaling |
|
| ||
| LILRA2 | Leukocyte immunoglobulin-like receptor, subfamily A (with TM domain), member 2 | An activatory cell-surface receptor expressed on monocytes, B cells, dendritic, and NK cells |
|
| ||
| LILRB5 | Leukocyte immunoglobulin-like receptor, subfamily B (with TM and ITIM domains), member 5 | An inhibitory cell-surface receptor expressed on immune cells |
|
| ||
| MMD2 | Monocyte to macrophage differentiation-associated 2 | Modulates Ras signaling |
|
| ||
| MTDH | Metadherin | Involvement in HIF-1 alpha mediated angiogenesis and RNA-induced silencing complex and miRNA functions |
|
| ||
| PAPPA | Pregnancy-associated plasma protein A, pappalysin-1 | Involvement in local proliferative processes such as wound healing |
|
| ||
| PDCD6IP | Programmed cell death 6 interacting protein | Protects against cell death |
|
| ||
| PPARA | Peroxisome proliferator-activated receptor alpha | Affects the expression of genes involved in cell proliferation, cell differentiation, and in immune and inflammation responses |
|
| ||
| SOCS2 | Suppressor of cytokine signaling 2 | A negative regulator of JAK/STAT cytokine signaling pathway |
|
| ||
| TLR2 | Toll-like receptor 2 | Plays a fundamental role in activation of innate immunity, stimulates NF-kappa B |
|
| ||
| TLR7 | Toll-like receptor 7 | Plays a fundamental role in activation of innate immunity |
|
| ||
| TNFRSF19 | Tumor necrosis factor receptor superfamily, member 19 | Interacts with TRAF family members, induces apoptosis by a caspase-independent mechanism |
|
| ||
| TNFSF15 | Tumor necrosis factor (ligand) superfamily, member 15 | A cytokine induced by TNF and IL-1 alpha activating NF-kappa B and MAP kinases inducing apoptosis in endothelial cells |
|
| ||
| TOX | Thymocyte selection-associated high mobility group box | Highly expressed in thymus, the site of development of T cells |
|
| ||
| TRAF6 | TNF receptor-associated factor 6, E3 ubiquitin protein ligase | Functions as a signal transducer in the NF-kappa B pathway, activates Ikappa B kinase in response to proinflammatory cytokines |
|
| ||
| VSIG4 | V-set and immunoglobulin domain containing 4 | A negative regulator of T-cell responses structurally related to the B7 family of immune regulatory proteins |
4. Discussion
The results of our previous pilot study strongly supported the need for a more detailed exploration of extracellular microRNAs in maternal circulation with the view toward their recognition as potential biomarkers for placental insufficiency related complications [51, 54].
Initially, some extracellular placental specific microRNAs (miR-516-5p, miR-520*, miR-518b, and miR-526a) trended just to a higher level in the small cohort of patients with placental insufficiency related complications (16 preeclampsia, 5 preeclampsia with IUGR and 11 IUGR), however, did not reach statistical significance when compared to gestational-age-matched controls. Although we have previously demonstrated that normal pregnancies and the manifestation of placental-insufficiency-related complications did not influence the levels of miR-16 and let-7d in maternal plasma [51, 54], it is now no doubt that ubiquitously expressed miR-16 and let-7d should not be further used to normalize expression profiles of various extracellular microRNAs as was done before in our pilot study. Our latest research revealed that the expression levels of miR-16 were significantly decreased in placental tissues derived from patients with preeclampsia (data submitted for publication). Similarly, Maccani et al. [56] also reported that reduced expression of miR-16 in placental tissue may be relevant to the low birth weight in term infants born small for gestational age. In contrast, miR-16 was previously observed to be overexpressed in placental tissues affected with severe preeclampsia, respectively [38]. The latest study of Wu et al. [44] brought the evidence of circulating mir-16 down-regulation in patients with severe preeclampsia. Furthermore, Yang et al. [43] showed decreased expression of circulating let-7d in preeclamptic patients applying more sophisticated approach such as next generation sequencing technology.
For that reason, alternative endogenous control candidates to normalize extracellular microRNA gene expression data should be used.
In the current study, the cohort of pregnancy related complications was expanded to achieve adequate power of the study. This time, the normalization of circulating microRNA expression was done against synthetic C. elegans microRNA (cel-miR-39). Using both absolute and relative quantification approaches, the ability of extracellular C19MC microRNAs (miR-516-5p, miR-517*, miR-520a*, miR-525, and miR-526a) to differentiate between normal and complicated pregnancies during the onset of preeclampsia w or w/o fetal growth restriction was confirmed.
Unfortunately, limited data comparing extracellular C19MC microRNA levels between the groups of normal and complicated pregnancies are available. Our data are inconsistent with Yang et al. [43], who observed the upregulation of extracellular miR-520h in four patients with preeclampsia.
Our findings may be supported by Mouillet et al. [45], who have recently also observed no significant difference in relative placental specific microRNA levels (miR-518b) in plasma samples from those with normally progressing and fetal growth restriction pregnancies.
On the basis of the results of our study, we further studied the association between circulating C19MC microRNAs and the severity of the disease with respect to the degree of clinical signs, requirements for the delivery (before and after 34 weeks of gestation), and Doppler ultrasound examination.
The association analysis pointed to no relationship between C19MC microRNA plasmatic concentrations and/or gene expression and identified risk factors for a poorer perinatal outcome. There was no difference in microRNA plasmatic levels and/or gene expression between pregnancies with mild and severe preeclampsia, pregnancy-related complication with the need for the delivery before 34 weeks of gestation, and those who delivered after this critical period and pregnancies with abnormal and normal blood flow velocity waveforms. Nevertheless, the levels of miR-526a were significantly increased in the group of patients with abnormal values of flow rate in the umbilical artery.
On the other hand, the dependence between the levels of plasmatic C19MC microRNAs and the pulsatility index in the middle cerebral artery and the values of cerebroplacental ratio was demonstrated. The relation between the increased levels of plasmatic C19MC microRNAs (miR-516-5p, miR-517*, miR-520a*, miR-525, and miR-526a) and decreased values of flow rate in the middle cerebral artery reached a statistical significance in complicated pregnancies.
Similarly, the relationship between increased levels of plasmatic C19MC microRNAs (miR-520a* and miR-526a) and decreased values of cerebroplacental ratio was revealed.
In conclusion, microRNAs play a fundamental role in a variety of physiological and pathological processes involving pregnancy-related complications. Current study demonstrated for the first time that circulating C19MC microRNAs might play a role in the pathogenesis of preeclampsia, but not in the pathogenesis of gestational hypertension and fetal growth restriction. The study brought interesting finding that the upregulation of circulating C19MC microRNAs (miR-516-5p, miR-517*, miR-520a*, miR-525, and miR-526a) is a characteristic phenomenon of established preeclampsia.
5. Conclusion
The study brought the interesting finding that the upregulation of circulating C19MC microRNAs (miR-516-5p, miR-517*, miR-520a*, miR-525, and miR-526a) is a characteristic phenomenon of established preeclampsia.
Conflict of Interests
The authors report no conflict of interests.
Acknowledgments
The work was exclusively supported by the Grant Agency of Czech Republic (no. 304/12/1352) and partially supported by the Charles University Research Program PRVOUK P32.
References
- 1.Redman CWG, Sargent IL. Preeclampsia and the systemic inflammatory response. Seminars in Nephrology. 2004;24(6):565–570. doi: 10.1016/s0270-9295(04)00127-5. [DOI] [PubMed] [Google Scholar]
- 2.Nelson DM. Apoptotic changes occur in syncytiotrophoblast of human placental villi where fibrin type fibrinoid is deposited at discontinuities in the villous trophoblast. Placenta. 1996;17(7):387–391. doi: 10.1016/s0143-4004(96)90019-3. [DOI] [PubMed] [Google Scholar]
- 3.Oudejans CBM, Tjoa ML, Westerman BA, Mulders MAM, Van Wijk IJ, Van Vugt JMG. Circulating trophoblast in maternal blood. Prenatal Diagnosis. 2003;23(2):111–116. doi: 10.1002/pd.539. [DOI] [PubMed] [Google Scholar]
- 4.Huppertz B, Kingdom JCP. Apoptosis in the trophoblast—role of apoptosis in placental morphogenesis. Journal of the Society for Gynecologic Investigation. 2004;11(6):353–362. doi: 10.1016/j.jsgi.2004.06.002. [DOI] [PubMed] [Google Scholar]
- 5.Orozco AF, Bischoff FZ, Horne C, Popek E, Simpson JL, Lewis DE. Hypoxia-induced membrane-bound apoptotic DNA particles: potential mechanism of fetal DNA in maternal plasma. Annals of the New York Academy of Sciences. 2006;1075:57–62. doi: 10.1196/annals.1368.007. [DOI] [PubMed] [Google Scholar]
- 6.Hromadnikova I. Extracellular nucleic acids in maternal circulation as potential biomarkers for placental insufficiency. DNA and Cell Biology. 2012;31(7):1221–1232. doi: 10.1089/dna.2011.1530. [DOI] [PMC free article] [PubMed] [Google Scholar]
- 7.Redman CW, Sargent IL. Latest advances in understanding preeclampsia. Science. 2005;308(5728):1592–1594. doi: 10.1126/science.1111726. [DOI] [PubMed] [Google Scholar]
- 8.Khong TY, De Wolf F, Robertson WB, Brosens I. Inadequate maternal vascular response to placentation in pregnancies complicated by pre-eclampsia and by small-for-gestational age infants. British Journal of Obstetrics and Gynaecology. 1986;93(10):1049–1059. doi: 10.1111/j.1471-0528.1986.tb07830.x. [DOI] [PubMed] [Google Scholar]
- 9.WHO. World Health Organization International Collaborative Study of Hypertensive Disorders in Pregnancy. Geographic variation in the incidence of hypertension in pregnancy. American Journal of Obstetrics and Gynecology. 1988;158(1):80–83. [PubMed] [Google Scholar]
- 10.Bamfo JE, Odibo AO. Diagnosis and management of fetal growth restriction. Journal of Pregnancy. 2011;2011:15 pages. doi: 10.1155/2011/640715.640715 [DOI] [PMC free article] [PubMed] [Google Scholar]
- 11.ACOG Committee on Practise Bulletins-Obstetrics. Diagnosis and management of preeclampsia and eclampsia. Obstetrics and Gynecology. 2002;99(1):159–167. doi: 10.1016/s0029-7844(01)01747-1. [DOI] [PubMed] [Google Scholar]
- 12.Khan KS, Wojdyla D, Say L, Gülmezoglu AM, Van Look PF. WHO analysis of causes of maternal death: a systematic review. The Lancet. 2006;367(9516):1066–1074. doi: 10.1016/S0140-6736(06)68397-9. [DOI] [PubMed] [Google Scholar]
- 13.Germain SJ, Sacks GP, Soorana SR, Sargent IL, Redman CW. Systemic inflammatory priming in normal pregnancy and preeclampsia: the role of circulating syncytiotrophoblast microparticles. Journal of Immunology. 2007;178(9):5949–5956. doi: 10.4049/jimmunol.178.9.5949. [DOI] [PubMed] [Google Scholar]
- 14.Reddy A, Zhong XY, Rusterholz C, et al. The effect of labour and placental separation on the shedding of syncytiotrophoblast microparticles, cell-free DNA and mRNA in normal pregnancy and pre-eclampsia. Placenta. 2008;29(11):942–949. doi: 10.1016/j.placenta.2008.08.018. [DOI] [PubMed] [Google Scholar]
- 15.Poon LCY, Akolekar R, Lachmann R, Beta J, Nicolaides KH. Hypertensive disorders in pregnancy: screening by biophysical and biochemical markers at 11–13 weeks. Ultrasound in Obstetrics and Gynecology. 2010;35(6):662–670. doi: 10.1002/uog.7628. [DOI] [PubMed] [Google Scholar]
- 16.Akolekar R, Syngelaki A, Sarquis R, Zvanca M, Nicolaides KH. Prediction of early, intermediate and late pre-eclampsia from maternal factors, biophysical and biochemical markers at 11–13 weeks. Prenatal Diagnosis. 2011;31(1):66–74. doi: 10.1002/pd.2660. [DOI] [PubMed] [Google Scholar]
- 17.von Dadelszen P, Magee LA, Roberts JM. Subclassification of preeclampsia. Hypertension in Pregnancy. 2003;22(2):143–148. doi: 10.1081/PRG-120021060. [DOI] [PubMed] [Google Scholar]
- 18.Huppertz B. Placental origins of preeclampsia: challenging the current hypothesis. Hypertension. 2008;51(4):970–975. doi: 10.1161/HYPERTENSIONAHA.107.107607. [DOI] [PubMed] [Google Scholar]
- 19.Valensise H, Vasapollo B, Gagliardi G, Novelli GP. Early and late preeclampsia: two different maternal hemodynamic states in the latent phase of the disease. Hypertension. 2008;52(5):873–880. doi: 10.1161/HYPERTENSIONAHA.108.117358. [DOI] [PubMed] [Google Scholar]
- 20.Dennis Lo YM, Corbetta N, Chamberlain PF, et al. Presence of fetal DNA in maternal plasma and serum. The Lancet. 1997;350(9076):485–487. doi: 10.1016/S0140-6736(97)02174-0. [DOI] [PubMed] [Google Scholar]
- 21.Smid M, Vassallo A, Lagona F, et al. Quantitative analysis of fetal DNA in maternal plasma in pathological conditions associated with placental abnormalities. Annals of the New York Academy of Sciences. 2001;945:132–137. doi: 10.1111/j.1749-6632.2001.tb03873.x. [DOI] [PubMed] [Google Scholar]
- 22.Caramelli E, Rizzo N, Concu M, et al. Cell-free fetal DNA concentration in plasma of patients with abnormal uterine artery Doppler waveform and intrauterine growth restriction—a pilot study. Prenatal Diagnosis. 2003;23(5):367–371. doi: 10.1002/pd.596. [DOI] [PubMed] [Google Scholar]
- 23.Costa J-M, Benachi A, Gautier E. New strategy for prenatal diagnosis of X-linked disorders. New England Journal of Medicine. 2002;346(19):p. 1502. doi: 10.1056/NEJM200205093461918. [DOI] [PubMed] [Google Scholar]
- 24.Rijnders RJ, van der Schoot CE, Bossers B, de Vroede MA, Christiaens GC. Fetal sex determination from maternal plasma in pregnancies at risk for congenital adrenal hyperplasia. Obstetetrics and Gynecology. 2001;98(3):374–378. doi: 10.1016/s0029-7844(01)01480-6. [DOI] [PubMed] [Google Scholar]
- 25.Faas BHW, Beuling EA, Christiaens GCML, Von Dem Borne AEGK, Van Der Schoot CE. Detection of fetal RHD-specific sequences in maternal plasma. The Lancet. 1998;352(9135):p. 1196. doi: 10.1016/s0140-6736(05)60534-x. [DOI] [PubMed] [Google Scholar]
- 26.Lo YMD, Hjelm NM, Fidler C, et al. Prenatal diagnosis of fetal RhD status by molecular analysis of maternal plasma. New England Journal of Medicine. 1998;339(24):1734–1738. doi: 10.1056/NEJM199812103392402. [DOI] [PubMed] [Google Scholar]
- 27.Hromadnikova I, Vechetova L, Vesela K, Benesova B, Doucha J, Vlk R. Non-invasive fetal RHD and RHCE genotyping using real-time PCR testing of maternal plasma in RhD-negative pregnancies. Journal of Histochemistry and Cytochemistry. 2005;53(3):301–305. doi: 10.1369/jhc.4A6372.2005. [DOI] [PubMed] [Google Scholar]
- 28.Chan KCA, Ding C, Gerovassili A, et al. Hypermethylated RASSF1A in maternal plasma: a universal fetal DNA marker that improves the reliability of noninvasive prenatal diagnosis. Clinical Chemistry. 2006;52(12):2211–2218. doi: 10.1373/clinchem.2006.074997. [DOI] [PubMed] [Google Scholar]
- 29.Lo YMD, Leung TN, Tein MSC, et al. Quantitative abnormalities of fetal DNA in maternal serum in preeclampsia. Clinical Chemistry. 1999;45(2):184–188. [PubMed] [Google Scholar]
- 30.Lau T-W, Leung TN, Chan LYS, et al. Fetal DNA clearance from maternal plasma is impaired in preeclampsia. Clinical Chemistry. 2002;48(12):2141–2146. [PubMed] [Google Scholar]
- 31.Byrne BM, Crowley A, Taulo F, Anthony J, O’Leary JJ, O’Herlihy C. Fetal DNA quantitation in peripheral blood is not useful as a marker of disease severity in women with preeclampsia. Hypertension in Pregnancy. 2003;22(2):157–164. doi: 10.1081/PRG-120021062. [DOI] [PubMed] [Google Scholar]
- 32.Sekizawa A, Jimbo M, Saito H, et al. Cell-free fetal DNA in the plasma of pregnant women with severe fetal growth restriction. American Journal of Obstetrics and Gynecology. 2003;188(2):480–484. doi: 10.1067/mob.2003.27. [DOI] [PubMed] [Google Scholar]
- 33.Tsui DWY, Chan KCA, Chim SSC, et al. Quantitative aberrations of hypermethylated RASSF1A gene sequences in maternal plasma in pre-eclampsia. Prenatal Diagnosis. 2007;27(13):1212–1218. doi: 10.1002/pd.1897. [DOI] [PubMed] [Google Scholar]
- 34.Hromadnikova I, Benesova M, Zejskova L, et al. The effect of DYS-14 copy number variations on extracellular fetal DNA quantification in maternal circulation. DNA and Cell Biology. 2009;28(7):351–358. doi: 10.1089/dna.2009.0855. [DOI] [PubMed] [Google Scholar]
- 35.Hromadnikova I, Zejskova L, Kotlabova K, et al. Quantification of extracellular DNA using hypermethylated RASSF1A, SRY, and GLO sequences—evaluation of diagnostic possibilities for predicting placental insufficiency. DNA and Cell Biology. 2010;29(6):295–301. doi: 10.1089/dna.2009.0971. [DOI] [PubMed] [Google Scholar]
- 36.Pineles BL, Romero R, Montenegro D, et al. Distinct subsets of microRNAs are expressed differentially in the human placentas of patients with preeclampsia. American Journal of Obstetrics and Gynecology. 2007;196(3):261.e1–261.e6. doi: 10.1016/j.ajog.2007.01.008. [DOI] [PubMed] [Google Scholar]
- 37.Zhu X-M, Han T, Sargent IL, Yin G-W, Yao Y-Q. Differential expression profile of microRNAs in human placentas from preeclamptic pregnancies vs normal pregnancies. American Journal of Obstetrics and Gynecology. 2009;200(6):661.e1–661.e7. doi: 10.1016/j.ajog.2008.12.045. [DOI] [PubMed] [Google Scholar]
- 38.Hu Y, Li P, Hao S, Liu L, Zhao J, Hou Y. Differential expression of microRNAs in the placentae of Chinese patients with severe pre-eclampsia. Clinical Chemistry and Laboratory Medicine. 2009;47(8):923–929. doi: 10.1515/CCLM.2009.228. [DOI] [PubMed] [Google Scholar]
- 39.Chim SSC, Shing TKF, Hung ECW, et al. Detection and characterization of placental microRNAs in maternal plasma. Clinical Chemistry. 2008;54(3):482–490. doi: 10.1373/clinchem.2007.097972. [DOI] [PubMed] [Google Scholar]
- 40.Lai EC. Micro RNAs are complementary to 3′ UTR sequence motifs that mediate negative post-transcriptional regulation. Nature Genetics. 2002;30(4):363–364. doi: 10.1038/ng865. [DOI] [PubMed] [Google Scholar]
- 41.Bartel DP. MicroRNAs: genomics, biogenesis, mechanism, and function. Cell. 2004;116(2):281–297. doi: 10.1016/s0092-8674(04)00045-5. [DOI] [PubMed] [Google Scholar]
- 42.Gunel T, Zeybek ZG, Akçakaya P, et al. Serum microRNA expression in pregnancies with preeclampsia. Genetics and Moecular Research. 2011;10(4):4034–4040. doi: 10.4238/2011.November.8.5. [DOI] [PubMed] [Google Scholar]
- 43.Yang Q, Lu J, Wang S, Li H, Ge Q, Lu Z. Application of next-generation sequencing technology to profile the circulating microRNAs in the serum of preeclampsia versus normal pregnant women. Clinica Chimica Acta. 2011;412(23-24):2167–2173. doi: 10.1016/j.cca.2011.07.029. [DOI] [PubMed] [Google Scholar]
- 44.Wu L, Zhou H, Lin H, et al. Circulating microRNAs are elevated in plasma from severe preeclamptic pregnancies. Reproduction. 2012;143(3):389–397. doi: 10.1530/REP-11-0304. [DOI] [PubMed] [Google Scholar]
- 45.Mouillet J-F, Chu T, Hubel CA, Nelson DM, Parks WT, Sadovsky Y. The levels of hypoxia-regulated microRNAs in plasma of pregnant women with fetal growth restriction. Placenta. 2010;31(9):781–784. doi: 10.1016/j.placenta.2010.07.001. [DOI] [PMC free article] [PubMed] [Google Scholar]
- 46.Seitz H, Royo H, Bortolin M-L, Lin S-P, Ferguson-Smith AC, Cavaillé J. A large imprinted microRNA gene cluster at the mouse Dlk1-Gtl2 domain. Genome Research. 2004;14(9):1741–1748. doi: 10.1101/gr.2743304. [DOI] [PMC free article] [PubMed] [Google Scholar]
- 47.Liang Y, Ridzon D, Wong L, Chen C. Characterization of microRNA expression profiles in normal human tissues. BMC Genomics. 2007;8, article 166 doi: 10.1186/1471-2164-8-166. [DOI] [PMC free article] [PubMed] [Google Scholar]
- 48.Bentwich I, Avniel A, Karov Y, et al. Identification of hundreds of conserved and nonconserved human microRNAs. Nature Genetics. 2005;37(7):766–770. doi: 10.1038/ng1590. [DOI] [PubMed] [Google Scholar]
- 49.Lin S, Cheung WKC, Chen S, et al. Computational identification and characterization of primate-specific microRNAs in human genome. Computational Biology and Chemistry. 2010;34(4):232–241. doi: 10.1016/j.compbiolchem.2010.08.001. [DOI] [PubMed] [Google Scholar]
- 50.Morales-Prieto DM, Ospina-Prieto S, Chaiwangyen W, Schoenleben M, Markert UR. Pregnancy-associated miRNA-clusters. Journal of Reproductive Immunology. 2013;97(1):51–61. doi: 10.1016/j.jri.2012.11.001. [DOI] [PubMed] [Google Scholar]
- 51.Kotlabova K, Doucha J, Hromadnikova I. Placental-specific microRNA in maternal circulation—identification of appropriate pregnancy-associated microRNAs with diagnostic potential. Journal of Reproductive Immunology. 2011;89(2):185–191. doi: 10.1016/j.jri.2011.02.006. [DOI] [PubMed] [Google Scholar]
- 52.Bortolin-Cavaille M-L, Dance M, Weber M, Cavaille J. C19MC microRNAs are processed from introns of large Pol-II, non-protein-coding transcripts. Nucleic Acids Research. 2009;37(10):3464–3473. doi: 10.1093/nar/gkp205. [DOI] [PMC free article] [PubMed] [Google Scholar]
- 53.MiRNAMap 2.0 [Internet] Department of Biological Science and Technology, Institute of Bioinformatics National Chiao Tung University, Hsinchu, Taiwan, 2013, http://mirnamap.mbc.nctu.edu.tw.
- 54.Hromadnikova I, Kotlabova K, Doucha J, Dlouha K, Krofta L. Absolute and relative quantification of placenta-specific microRNAs in maternal circulation with placental insufficiency—related complications. Journal of Molecular Diagnostics. 2012;14(2):160–167. doi: 10.1016/j.jmoldx.2011.11.003. [DOI] [PubMed] [Google Scholar]
- 55.Livak KJ, Schmittgen TD. Analysis of relative gene expression data using real-time quantitative PCR and the 2-ΔΔCT method. Methods. 2001;25(4):402–408. doi: 10.1006/meth.2001.1262. [DOI] [PubMed] [Google Scholar]
- 56.Maccani MA, Padbury JF, Marsit CJ. miR-16 and miR-21 expression in the placenta is associated with fetal growth. PLoS ONE. 2011;6(6) doi: 10.1371/journal.pone.0021210.e21210 [DOI] [PMC free article] [PubMed] [Google Scholar]