Abstract
A biosensor comprising tyrosinase immobilized on a single-walled carbon nanotube-modified glassy carbon electrode has been developed. The sensitive element, ie, tyrosinase, was immobilized using a drop-and-dry method followed by cross-linking. Tyrosinase maintained high bioactivity on this nanomaterial, catalyzing the oxidation of epinephrine to epinephrine-quinone, which was electrochemically reduced (−0.07 V versus Ag/AgCl) on the biosensor surface. Under optimum conditions, the biosensor showed a linear response in the range of 10–110 μM. The limit of detection was calculated to be 2.54 μM with a correlation coefficient of 0.977. The repeatability, expressed as the relative standard deviation for five consecutive determinations of 10−5 M epinephrine solution was 3.4%. A good correlation was obtained between results obtained by the biosensor and those obtained by ultraviolet spectrophotometric methods.
Keywords: amperometry, single-walled carbon nanotubes, spectrophotometry, catecholamine, pharmaceutical formula
Introduction
Epinephrine belongs to the catecholamine group and has an important role as a neurotransmitter and hormone. It is biosynthesized in the adrenal medulla and sympathetic nerve terminals, and is secreted by the adrenal glands.1,2 Epinephrine is used in medicine to treat heart attacks and bronchial asthma, and in cardiac surgery.3,4 Therefore, determination of epinephrine in biological fluids is of great importance in medical diagnosis, in particular for patients suffering from Parkinson’s disease. For this reason, there is a need for quantitative determination of epinephrine in biological fluids and pharmaceutical formulations.2
Several methods have been used to determine epinephrine, including spectrophotometry,5,6 fluorimetry,7 liquid chromatography,8 capillary electrophoresis,9 and piezoelectric detection.10 However, these methods tend to be expensive, complicated, or need extraction and derivatization. The main advantages of biosensor technology in comparison with traditional analytical methods are fast detection (minutes) and response (seconds), high sensitivity (typically lower than μM), good selectivity, and easy preparation and assay methods. Additionally, most biosensors are reusable and can be assayed at low cost.
Electrochemical biosensors based on immobilization of tyrosinase on nanomaterials provide an alternative to other analytical techniques for catecholamine determination.11,12 The electroanalytic technique based on biosensors is remarkable because of its simplicity, low cost, high sensitivity, and potential for miniaturization.12 Numerous biosensors have been developed using tyrosinase immobilized on different electrode supports. Different types of biosensors can be found in the literature, including carbon paste biosensors,13 conducting polymer-modified electrodes,12,14 biosensors based on silica sol-gel composite films,15 Langmuir-Blodgett thin films,16,17 and layer-by-layer films.18
Use of a biocompatible matrix for tyrosine immobilization is essential for maintaining the functionality of the enzyme while providing accessibility to the target analyte. The noncovalent approach is considered to be a more promising method, because there is less distortion of the conformational structure of the immobilized enzyme.19 Carbon nanotubes, in addition to having very interesting mechanical, electrical, and thermal properties, provide a large surface area for higher enzyme loading and a biocompatible environment that helps enzymes to preserve their biocatalytic properties.20 Compared with multiwalled carbon nanotubes, single-walled carbon nanotubes (SWCNTs) have a well defined system in terms of electronic properties. For enzyme immobilization, multiwalled carbon nanotubes are desirable because of their easy dispersibility and low cost, but SWCNTs are attractive because of their larger surface area for enzyme interaction. SWCNTs are usually arranged in a regular pattern and are in contact with each other. Moreover, SWCNTs can be seen as a bridge connecting electrodes with various kinds of biomolecules, while they are aligned normally to the electrode surface by self-assembly and act as nanoelectrodes.21
In this paper, an innovative biosensor is introduced for determination of epinephrine in pharmaceutical samples and offers the advantages of high sensitivity, low cost, and simple fabrication. The response dependence and amperometric characteristics, including kinetics, calibration curve, and limit of detection of the prepared biosensor were investigated in the detection of epinephrine. The results obtained for the proposed biosensor were compared with those using the standard method of ultraviolet spectrophotometry.
Materials and methods
Apparatus
Amperometric measurements were performed using an SP-150 potentiostat/galvanostat (Biologic Science Instruments, Claix, France) and EC-Lab Express software (Biologic Science Instruments). Ag/AgCl 3 M KCl was used as the reference electrode and a platinum wire was used as the auxiliary electrode. The working electrode was the biosensor. An Elmasonic S10H ultrasonic bath (Elma Hans Schmidbauer GmbH and Co, KG, Singen, Germany) was used to dissolve and homogenize the solutions. For pH measurements, an Inolab pH 7310 (WTW Wissenschaftlich-Technische Werkstätten GmbH, Weilheim in Oberbayern, Germany) was used. An ultraviolet-visible spectrophotometer (model UVD-2950, Labomed, Inc., Los Angeles, CA, USA) with a quartz cell (optical path 1 cm and total volume 4 mL) was used for measurements following an official spectrophotometric method (X Romanian Pharmacopoeia).
Reagents and solutions
All solutions were prepared using ultrapure water (Milli-Q Simplicity® Water Purification System, EMD Millipore Corporation, Billerica, MA, USA) with resistivity of 18.3 MΩ. Epinephrine [adrenaline or 1-(3,4-dihydroxyphenyl)-2-methyloaminoethanol], sodium monohydrogen phosphate, and potassium dihydrogen phosphate were purchased from Sigma-Aldrich (St Louis, MO, USA). Methanol was sourced from Merck & Co., Inc. (Whitehouse Station, NJ, USA). The SWCNTs were obtained from Nanoledge Inc (Boucherville, Quebec, Canada). These have a purity of more than 95% and were used without any chemical treatment. A glassy carbon electrode (GCE) was purchased from Radiometer Analytical SAS (Lyon, France). Tyrosinase (from the EC 232-653-4 mushroom, activity 5,370 U/mg of solid) was purchased from Sigma-Aldrich. A 50 μg/μL solution of tyrosinase in phosphate-buffered solution (PBS, 0.01 M, pH 7.0) was used to immobilize the enzyme. Sodium chloride and sodium metabisulfite (Sigma-Aldrich), urea (Merck), L-(+)-tartaric acid (Sigma-Aldrich), hydrochloric acid (S.C. Chemical Company S.A., Iasi, Romania), glycine (Sigma-Aldrich), and D(+)-glucose (Acros Organics, Fair Lawn, NJ, USA) were used for the interference studies.
Construction of biosensor
The GCE surface was polished with alumina paste, washed with ultrapure water, and rinsed in methanol. The active part of the electrode was a 4 mm diameter disk. The other parts of the GCE were covered with isolating epoxy resin. After cleaning, the GCE surface was coated with 10 μL of SWCNT suspension (1 mg/mL in methanol). The solvent was evaporated in air at room temperature. The tyrosinase enzyme was immobilized on the above GCE modified with SWCNTs (SWCNT-GCE) using a drop-and-dry technique followed by cross-linking. Next, 10 μL of 0.01 M PBS (pH 7.0) containing 50 μg/μL of enzyme was added onto the SWCNT-GCE surface. After drying, the biosensor was placed in a saturated glutaraldehyde vapor atmosphere for 10 minutes followed by drying in air for 15 minutes at room temperature.13 The biosensor was rinsed with PBS to remove any unbound enzyme from the biosensor surface.
Pharmacopoeia method
The spectrophotometric method established in the Romanian Pharmacopoeia was used to compare the results obtained with the biosensor. According to this method, epinephrine in 0.01 M hydrochloric acid solution showed maximum absorption at 279 nm. For one real sample (articaine/adrenaline) analyzed, strong interference from articaine was demonstrated at this wavelength. The presence of this interfering agent did not affect amperometric analyses using the biosensor.
Results and discussion
Cyclic voltammetry studies
The response of the biosensor when immersed in aqueous epinephrine solution was registered in the range from −0.5 V to +0.5 V at a scan rate of 0.050 V per second. Preliminary cyclic voltammetric experiments using GCE showed a reduction peak with a maximum current located at −0.07 V. This potential was selected, based on the preliminary experiments, and was later confirmed as the optimal potential in amperometric experiments. These experiments were carried out in PBS 0.01 M (pH 7.0), which was selected based on previous results.13
Figure 1 shows the cyclic voltammogram for the biosensor using 10−5 M epinephrine in PBS (0.01 M, pH 7.0). The cyclic voltammogram for the tyrosinase/SWCNT-GCE biosensor in 10−5 M epinephrine showed a peak at −0.07 V (cathodic peak associated with reduction of the enzymatically formed epinephrine-quinone to epinephrine) and at +0.12 V (anodic peak associated with electrochemical oxidation of epinephrine).
Figure 1.
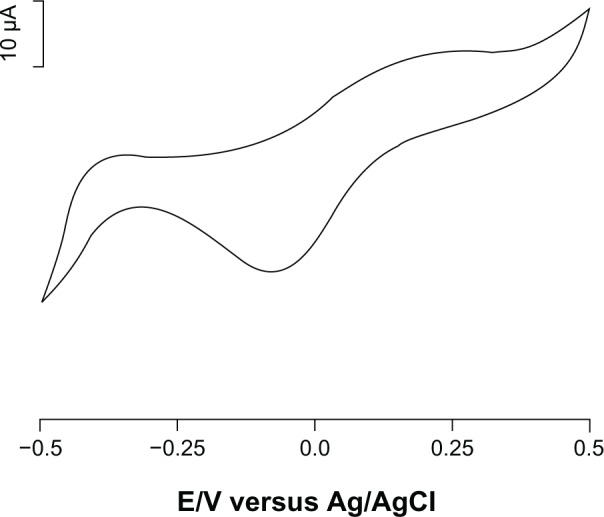
Cyclic voltammogram of biosensor immersed in 10−5 M solution of epinephrine (supporting electrolyte phosphate-buffered saline, pH 7.0). Scan rate 50 mV per second.
Tyrosinase catalyzes the oxidation of epinephrine to epinephrine-quinone, as shown in Figure 2. The o- quinone derivative that is generated can be reduced electrochemically at low potential without any electron mediator (Figure 3).
Figure 2.

Enzymatic oxidation of epinephrine by tyrosinase.
Figure 3.

Electrochemical reduction of o-epinephrine-quinone.
Therefore, epinephrine can be detected by electrochemical reduction of epinephrine-quinone. The presence of a reduction peak indicates that the immobilization process retains the biological activity of tyrosinase in SWCNTs with a modified surface. The value of the potential applied to monitor reduction of the species at the electrode surface was −0.07 V, in order to minimize the risk of possible electrochemical interference.22
Influence of scan rate on biosensor response
A kinetics study was performed by registering the cyclic voltammograms of the biosensor at different scan rates from 0.05 to 1.00 V per second (Figure 4, not all cyclic voltammograms are shown). The peak cathodic current was proportional to the sweep rates, pointing to a limited charge transfer process due to the catalytic activity of the enzyme deposited on the surface of the electrode. From the slope of Ipc versus ν graph using the Laviron equation:
Figure 4.
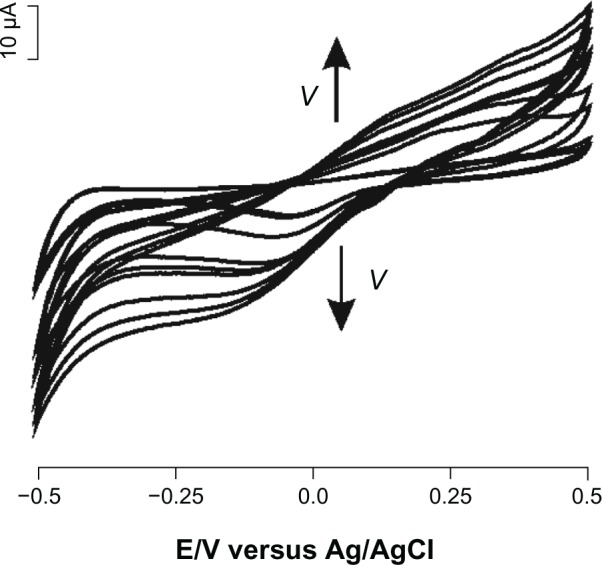
Cyclic voltammograms of biosensor immersed in 10−5 M solution of epinephrine (supporting electrolyte phosphate-buffered saline, pH 7.0) registered at different scan rates, from 0.05 to 1.00 V per second.
| (1) |
where Ipc is the cathodic peak current (in amperes), n is the number of electrons involved in the redox process, F is the Faraday constant (96,485.3365 C/mol), ν is the potential scan rate (V per second), A is the electrode area (cm2), Γ is the surface coverage of the redox species (mol/cm2), R is the ideal gas constant (8.3144621 J/ K×mol), and T is the temperature (K), the total surface coverage could be calculated.23
The total surface coverage value was calculated to be 2.34 × 10⁻¹⁰ mol/cm2, a value which is in agreement with the literature.24 Therefore, the biocatalytic activity of the enzyme is preserved well when it is immobilized in a nanostructured carbonaceous environment.
The intensity of the anodic peak related to electrochemical oxidation of epinephrine increases linearly with the square root of the sweep rate, indicating a diffusion-controlled process according to the Randles-Sevcik equation:23
| (2) |
where Ipa is the anodic peak current (amperes), n is the number of electrons involved in the redox process, ν is the potential scan rate (V per second), D is the diffusion coefficient (cm2 per second), A is the electrode surface area (cm2), and C is the concentration (mM). From the slope of Ipa versus ν1/2 plot, the diffusion coefficient D was calculated. The calculated diffusion coefficient D was 7.87 × 10⁻⁶ cm2 per second. This value is lower than that obtained in the case of modified gold electrodes.25 From the above results, it could be concluded that tyrosinase/SWCNT-GCE has a fast diffusion coefficient, indicating that electrochemical processes are occurring rapidly in the case of this biosensor.
Influence of epinephrine concentration on biosensor response
The effect of epinephrine concentration on the response of the biosensor was studied by cyclic voltammetry, immersing the electrode in solutions with different concentrations. As observed in Figure 5, the intensity of the peaks increased with epinephrine concentration. Chronoamperometry was extensively used in the field of biosensors, even though the electrochemical signals obtained by cyclic voltammetry were highly reproducible.22,24 Therefore, chronoamperometry was used to record the calibration curves.
Figure 5.
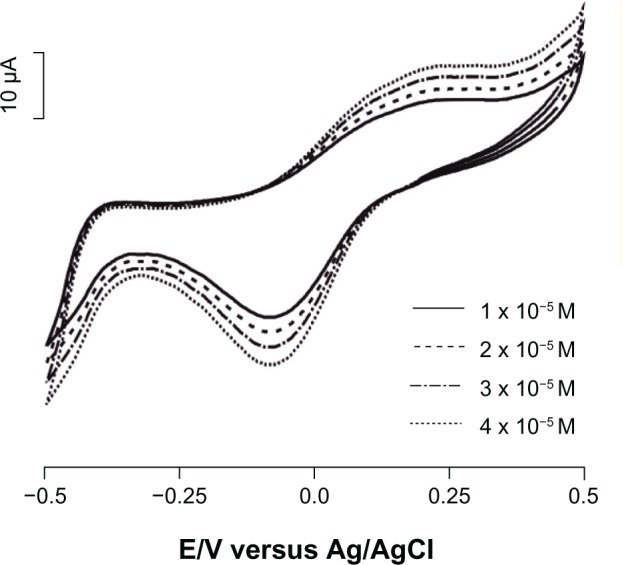
Cyclic voltammograms of biosensor immersed in epinephrine solutions of different concentrations (1 × 10⁻⁵ M, 2 × 10⁻⁵ M, 3 × 10⁻⁵ M, and 4 × 10⁻⁵ M).
Amperometric response of biosensor
Figure 6 shows the amperometric response for the tyrosinase/SWCNT-GCE biosensor at −0.07 V after addition of successive aliquots (20 μM) of epinephrine to 0.01 M PBS (pH 7.0) under constant stirring. Reduction currents proportional to the concentration of epinephrine were observed, which resulted from the electrochemical reduction of epinephrine-quinone formed enzymatically on the biosensor surface. The tyrosinase/SWCNT-GCE biosensor achieves 95% of steady-state current in less than 5 seconds. This response rate is much faster than the 50 seconds reported for the silica sol-gel matrix.26 This fast response is attributed to rapid electron transfer between the enzymatically produced epinephrine-quinone and the electrode.
Figure 6.
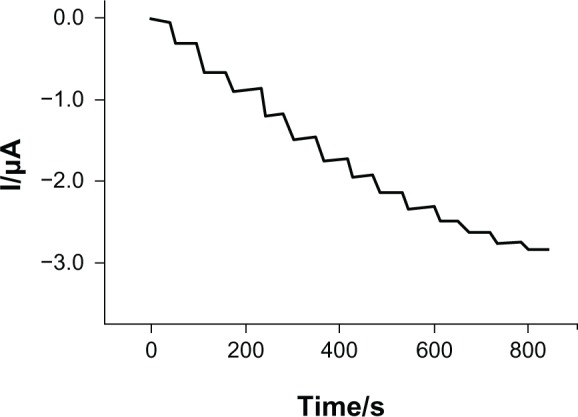
Amperometric response of tyrosinase-based biosensor to epinephrine in 0.1 M phosphate-buffered saline solution (pH 7.0) under constant stirring, with levels increasing in 20 μM increments. Applied potential −0.07 V.
Analytical performances of biosensor
Figure 7 shows the relationship between the cathodic current of the biosensor and the epinephrine concentration in PBS (pH 7.0) at −0.07 V for the tyrosinase/SWCNT-GCE biosensor under continuous stirring (calibration curve).
Figure 7.
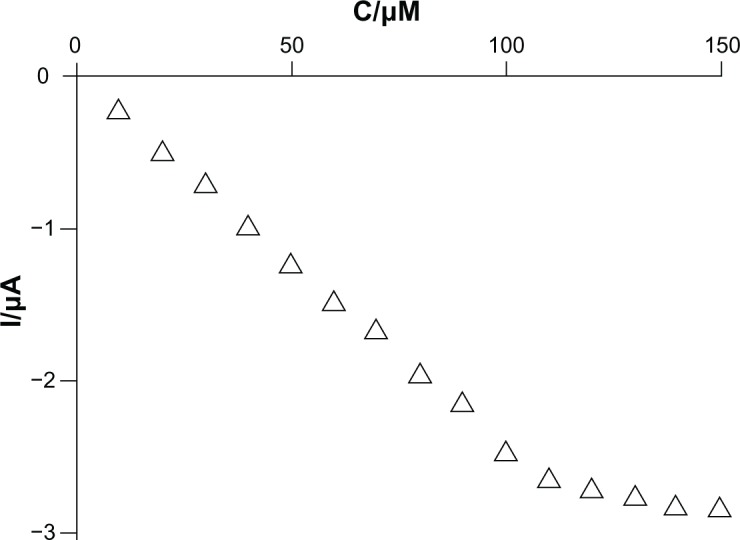
Calibration curve for the reduction current and concentration of epinephrine in phosphate-buffered saline (pH 7.0). Applied potential −0.07 V.
The response current of the tyrosinase/SWCNT-GCE biosensor is linearly related to the epinephrine concentration in the range of 10–110 μM, indicating that the catalytic enzymatic reaction of tyrosinase is a first-order reaction. After that, with further increases in epinephrine concentration, the current increases slowly, and the enzymatic reaction shows a transition from a first-order reaction to a zero-order reaction. The detection limit was calculated according to the 3 sb/m criterion, where m is the slope of the calibration graph and sb is the relative standard deviation (n=5) of the amperometric signals at the lowest concentration of the calibration plot. The detection limit (LOD) was calculated to be 2.54 μM and the correlation coefficient was 0.977. The LOD value obtained is between the one reported by Tembe et al (1 × 10⁻⁵ M)27 and that obtained by Mataveli et al (8.0 × 10⁻⁷ M).28 Thus, the biosensor is able to meet the requirements for practical application.
From the calibration data, the Hill coefficient (h) was calculated by representing log [I/(Imax − I)] versus log [S] (logarithm of the substrate concentration). A Hill coefficient of 1.07±0.03 was calculated for the reduction process of epinephrine-quinone formed from the enzymatic reaction on the electrode surface (R2=0.986). The value obtained for the h parameter was close to unity. This establishes that the kinetics of the enzymatic reaction fitted a Michaelis–Menten type of kinetics. The value, slightly higher than 1, shows a positive cooperative effect between the occupied active sites.
The apparent Michaelis–Menten constant (KM) of immobilized tyrosinase was calculated using the Lineweaver–Burk equation:23
| (3) |
where I is the cathodic current, Imax is the steady-state current, KM is the apparent Michaelis–Menten constant, and [S] is the concentration of substrate (epinephrine). The maximum current response and apparent Michaelis–Menten constant were calculated from the intercept and slope, respectively.
The values obtained for the biosensor detecting epinephrine were Imax =2.22 μA and KM =60.5 μM. The small value of the Michaelis–Menten constant indicates a strong affinity between tyrosinase and the substrate. In contrast, a higher Imax indicates higher sensitivity of the biosensor.23
The values obtained have demonstrated that Ty/SWCNT nanocomposite film makes up a proper environment for enzyme immobilization. It preserves the enzyme’s biocatalytic properties even in the case in which the immobilized enzyme is one molecule whose movement in space has been completely limited or restricted to a small region. The interaction between tyrosinase and the SWCNTs involves physical adsorption of the enzyme by hydrophobic and electrostatic interaction.20
Interference studies
The influence of various interfering agents on determination of 50 μM epinephrine was investigated. The result, expressed as the tolerance limit, was taken as the maximum concentration of the foreign substance which caused a relative error of approximately ±5% in determination of the analyte. The concentration of interfering substances was 0.01 M for Na+, S2O52−, and Cl−; and 0.001 M for urea, tartaric acid, and hydrochloric acid. The tolerated ratio of interfering substances to 50 μM epinephrine was 2,200 for Na+, S2O52−, and Cl−; and 750 for urea, and 240 for tartaric acid and hydrochloric acid, respectively. Glucose and glycine 0.001 M do not have any influence in the biosensor response when detecting 50 μM epinephrine. An absence of significant modification in the peak current recorded in the presence of the interfering species was demonstrated. Therefore, tyrosinase/SWCNT-GCE can be considered to be a good biosensor for recognition of epinephrine.
Biosensor repeatability and stability
To investigate the repeatability of the biosensor, amperometric measurements were performed in a 10−5 M epinephrine solution using the same biosensor. The relative standard deviation of the measurements was 3.4%. Between replicate measurements, the biosensor was cleaned by rinsing with 0.01 M PBS at pH 7.0. Therefore, the biosensor is expected to be able to be used repeatedly.
The stability of the biosensor was studied by monitoring the amperometric response to 10−5 M epinephrine solution at regular intervals (24 hours) for a period of one month. The biosensor was stored in a refrigerator at 4°C in 0.01 M PBS at pH 7.0. The results reveal that the biosensor retained 87% of its current response after one month of storage.
Application of the biosensor to detect epinephrine in pharmaceutical formulae
The ultraviolet spectrophotometric method indicated in the X Romanian Pharmacopoeia29 recommends measurement of epinephrine at 279 nm in the presence of 0.01 M HCl. A calibration curve was constructed using pure epinephrine. The pharmaceutical products were diluted in the same solvent, and absorbance at 279 nm was registered. From the calibration curve, the concentration of epinephrine was calculated while taking into account the dilution factor.
In the case of the biosensor, the addition method was used, whereby 50 μM of epinephrine was added to the pharmaceutical solution. The biosensor was immersed in PBS 0.01 M at pH 7.0, a −0.07 V potential was applied, and the solution was maintained under constant stirring. After stabilization, measured sample volumes were added and the cathodic currents were measured. Using the calibration curve, dilution factor, and quantity of epinephrine added, epinephrine concentrations in the pharmaceutical products were calculated. Table 1 shows the results obtained for analyses of pharmaceutical formulations using the official ultraviolet spectrophotometric procedure and the biosensor (−0.07 V versus Ag/AgCl).
Table 1.
Determination of epinephrine in formulation by ultraviolet spectrophotometry and biosensor
| Sample | Label value (mg/mL) | Pharmacopoeia method (mg/mL) | Biosensor (mg/mL) |
|---|---|---|---|
| Anapen® (Owen Mumford Ltd, Woodstock, UK) | 1 | 1.010 | 0.993 |
| Adrenaline 1 mg (Terapia SA, Cluj-Napoca, Romania) | 1 | 1.041 | 0.986 |
| Articaine/adrenaline (Sanofi-Aventis Deutschland GmbH, Berlin, Germany) | 0.010 | 36.226 | 0.012 |
Note: Relative standard deviation for Romanian Pharmacopoeia method was 2.2%; relative standard deviation for biosensor was 3.5%.
Following the Romanian Pharmacopoeia method, the values obtained were slightly higher than the value indicated on the labeling of the pharmaceutical product. This could be related to interference from other compounds present in the pharmaceutical product. However, in the case of the articaine/adrenaline product, a very significant difference was observed. The value obtained was due to interference from articaine, which shows maximum absorption at 272 nm in PBS (pH 6.8).30
The results obtained by amperometry using the biosensor were in very good agreement with the values registered on the labels of all the pharmaceutical products tested. Articaine has not been detected in the case of interfering compounds of the biosensor. This result is related to the specificity of tyrosinase for the phenolic groups in catecholamines. However, in two cases, a good relationship was found between the results obtained by each method. Consequently, the biosensor proposed in the present study can be successfully used in analysis of real samples.
Conclusion
This study demonstrates the possibility of developing a SWCNT-GCE-based biosensor for monitoring epinephrine in aqueous solution. It confirms that the SWCNT-GCE can be used as an appropriate matrix for immobilization of tyrosinase. The biosensor shows a rapid response, good sensitivity, and high stability for amperometric detection of epinephrine. The efficiency of the biosensor for epinephrine determination in pharmaceutical formulae has been demonstrated. The concentration results show good agreement with those obtained using the Romanian Pharmacopoeia method. Therefore, the proposed biosensor is a potential method for epinephrine quantification in pharmaceutical products and biological samples.
Acknowledgments
This work was supported by a grant from the Romanian National Authority for Scientific Research, CNCS-UEFISCDI, project number PN-II-ID-PCE-2011-3-0255.
Footnotes
Disclosure
The authors report no conflicts of interest in this work.
References
- 1.Stolk JM, U’Prichard DC, Fuxe K, editors. Epinephrine in the Central Nervous System. Cary, NC: Oxford University Press; 1988. [Google Scholar]
- 2.Devlin TM, editor. Textbook of Biochemistry: With Clinical Correlations. 5th ed. New York, NY: Wiley; 2002. [Google Scholar]
- 3.Sheikh A, Shehata YA, Brown SG, Simons FE. Adrenaline for the treatment of anaphylaxis: Cochrane systematic review. Allergy. 2009;64:204–212. doi: 10.1111/j.1398-9995.2008.01926.x. [DOI] [PubMed] [Google Scholar]
- 4.Berridge CW, Waterhouse BD. The locus coeruleus-noradrenergic system: modulation of behavioral state and state-dependent cognitive processes. Brain Res Rev. 2003;42:33–84. doi: 10.1016/s0165-0173(03)00143-7. [DOI] [PubMed] [Google Scholar]
- 5.Sanghavi BJ, Mobin SM, Mathur P, Lahiri GK, Srivastava AK. Biomimetic sensor for certain catecholamines employing copper(II) complex and silver nanoparticle modified glassy carbon paste electrode. Biosens Bioelectron. 2013;39:124–132. doi: 10.1016/j.bios.2012.07.008. [DOI] [PubMed] [Google Scholar]
- 6.Kim SH, Lee JW, Yeo IH. Spectroelectrochemical and electrochemical behavior of epinephrine at a gold electrode. Electrochim Acta. 2000;45:2889–2895. [Google Scholar]
- 7.Guo Y, Yang J, Wu X, Du A. A sensitive fluorimetric method for the determination of epinephrine. J Fluoresc. 2005;15:131–136. doi: 10.1007/s10895-005-2520-8. [DOI] [PubMed] [Google Scholar]
- 8.Zhang G, Zhang Y, Ji C, et al. Ultra sensitive measurement of endogenous epinephrine and norepinephrine in human plasma by semi-automated SPE-LC-MS/MS. J Chromatogr B Analyt Technol Biomed Life Sci. 2012:895–896. 186–190. doi: 10.1016/j.jchromb.2012.03.026. [DOI] [PubMed] [Google Scholar]
- 9.Zhang X, Xu S, Lim JM, Lee YI. Molecularly imprinted solid phase microextraction fiber for trace analysis of catecholamines in urine and serum samples by capillary electrophoresis. Talanta. 2012;99:270–276. doi: 10.1016/j.talanta.2012.05.050. [DOI] [PubMed] [Google Scholar]
- 10.Mo Z, Long X, Zhang M. Piezoelectric detection of ion pairs between sulphonate and catecholamines for flow injection analysis of pharmaceutical preparations. Talanta. 1999;48:643–648. doi: 10.1016/s0039-9140(98)00287-2. [DOI] [PubMed] [Google Scholar]
- 11.Tombelli S, Mascini M. Aptamers biosensors for pharmaceutical compounds. Comb Chem High Throughput Screen. 2010;13:641–649. doi: 10.2174/1386207311004070641. [DOI] [PubMed] [Google Scholar]
- 12.Ates M, Sarac AS. Conducting polymer coated carbon surfaces and biosensor applications. Progress in Organic Coatings. 2009;66:337–358. [Google Scholar]
- 13.Apetrei IM, Rodriguez-Mendez ML, Apetrei C, de Saja JA. Enzyme sensor based on carbon nanotubes/cobalt(II) phthalocyanine and tyrosinase used in pharmaceutical analysis. Sens Actuators B Chem. 2013;177:138–144. [Google Scholar]
- 14.Apetrei C, Rodriguez-Mendez ML, de Saja JA. Amperometric tyrosinase based biosensor using an electropolymerized phosphate-doped polypyrrole film as an immobilization support: application for detection of phenolic compounds. Electrochim Acta. 2011;56:8919–8925. [Google Scholar]
- 15.Liu Z, Deng J, Li D. A new tyrosinase biosensor based on tailoring the porosity of Al2O3 sol-gel to co-immobilize tyrosinase and the mediator. Anal Chim Acta. 2000;407:87–96. [Google Scholar]
- 16.Apetrei C, Alessio P, Constantino CJL, et al. Biomimetic biosensor based on lipidic layers containing tyrosinase and lutetium bisphthalocyanine for the detection of antioxidants. Biosens Bioelectron. 2011;26:2513–2519. doi: 10.1016/j.bios.2010.10.047. [DOI] [PubMed] [Google Scholar]
- 17.Cabaj J, Soloducho J, Nowakowska-Oleksy A. A Langmuir-Blodgett film based biosensor for estimation of phenol derivatives. Sens Actuators B Chem. 2010;143:508–515. [Google Scholar]
- 18.Iost RM, Madurro JM, Brito-Madurro AG, Nantes IL, Caseli L, Crespilho FN. Strategies of nano-manipulation for application in electrochemical biosensors. Int J Electrochem Sci. 2011;6:2965–2997. [Google Scholar]
- 19.Saifuddin N, Raziah AZ, Junizah AR. Carbon nanotubes: a review on structure and their interaction with proteins. J Chem. 2013;2013 ID 676815. [Google Scholar]
- 20.Feng W, Ji P. Enzymes immobilized on carbon nanotubes. Biotechnol Adv. 2011;29:889–895. doi: 10.1016/j.biotechadv.2011.07.007. [DOI] [PubMed] [Google Scholar]
- 21.Tang N, Zheng JB, Sheng QL, Zhang HF, Liu RX. A novel H2O2 sensor based on the enzymatically induced deposition of polyaniline at a horseradish peroxide/aligned single-wall carbon nanotubes modified Au electrode. Analyst. 2011;136:781–786. doi: 10.1039/c0an00379d. [DOI] [PubMed] [Google Scholar]
- 22.Mello LD, Taboada Sotomayor MDP, Kubota LT. HRP-based amperometric biosensor for the polyphenols determination in vegetables extract. Sens Actuators B Chem. 2003;96:636–645. [Google Scholar]
- 23.Bard AJ, Faulkner LR. Electrochemical Methods. New York, NY: John Wiley and Sons; 2001. [Google Scholar]
- 24.Apetrei IM, Bahrim G, Rodriguez-Mendez ML. Electrochemical study of polyphenols with amperometric tyrosinase based biosensors. Rom Biotechnol Lett. 2012;17:7684–7693. [Google Scholar]
- 25.Agboola BO, Ozoemena KI. Electrochemistry at cobalt(II) tetrasulfophthalocyanine-multi-walled carbon nanotubes modified glassy carbon electrode: a sensing platform for efficient suppression of ascorbic acid in the presence of epinephrine. Electroanalysis. 2008;15:1696–1707. [Google Scholar]
- 26.Li J, Chia LS, Goh NK, Tan SN. Silica sol-gel immobilised amperometric biosensor for the determination of phenolic compounds. Anal Chim Acta. 1998;362:203–211. [Google Scholar]
- 27.Tembe S, Kulkarni S, Karve M, D’Souza SF. Epinephrine biosensor using tyrosinase immobilized eggshell membrane. Sensors and Transducers Journal. 2009;107:111–118. [Google Scholar]
- 28.Mataveli LR, de Jesus Antunes N, Brigagão MR, de Magalhães CS, Wisniewski C, Luccas PO. Evaluation of a simple and low cost potentiometric biosensor for pharmaceutical and in vivo adrenaline determination. Biosens Bioelectron. 2010;26:798–802. doi: 10.1016/j.bios.2010.06.021. [DOI] [PubMed] [Google Scholar]
- 29.Romanian Pharmacopoeia . Editia a X-a. Bucharest, Romania: Ed Medicala; 1993. [Google Scholar]
- 30.Kulkarni AP, Khan SKA, Zaheer ZA, Dehghan MH. Spectroscopic estimation of articaine hydrochloride. J Pharm Res. 2011;4:1596–1597. [Google Scholar]


