Abstract
Much empirical evidence indicates that the popularity of various drugs tends to increase and wane over time producing episodic epidemics of particular drugs. These epidemics mostly affect persons reaching their late teens at the time of the epidemic resulting in distinct drug generations. This article examines the drug generations present in the 2000s among arrestees in the 10 locations served by the Arrestee Drug Abuse Monitoring–II program. At all 10 locations, our findings show that crack use is still common among older arrestees but not among arrestees born more recently. Marijuana is the drug most common among younger arrestees. The article also examines trends in heroin, methamphetamine, and powder cocaine use among arrestees at the few locations where their use was substantial.
Keywords: drug epidemics, subculture, marijuana, crack, drug generations
Introduction
The use of illegal drugs varies widely over time, across locations, and across groups of people living in a community. However, our social existence leads to clearly discernible patterns of drug use (Brownstein, Mulcahy, Taylor, Fernandes-Huessy, & Woods, 2012; Golub, Johnson, & Dunlap, 2005; Johnson & Golub, 2005). For the past two decades, we have been studying drug epidemics extensively, especially among arrestees using data from the Drug Use Forecasting (DUF) program and then its successor, the Arrestee Drug Abuse Monitoring (ADAM) program. This article provides an update on the major drug use trends among arrestees using the latest ADAM data collected during the 2000s from 10 geographically diverse locations.
A key finding from our prior work has been that the variation in drug use over time is rooted in drug use preferences across birth cohorts. This insight has led us to develop a concise way of exploring and presenting drug use trends that we refer to as the “drug generations framework.” This article first reviews the drug epidemics framework and then presents how the drug generations framework follows from it. The drug generations framework provides a powerful concise snapshot of the drug problems prevailing at a specific place and time and its differential impact across birth cohorts. These differences can have important implications for the development of timely, targeted drug abuse interventions (Caulkins, Tragler, & Wallner, 2009). An advantage of the drug generations framework is that it examines the impact of multiple overlapping epidemics simultaneously and their differential impact on successive birth cohorts.
A related publication provides a complete analysis of the time trend for the most common street drugs (marijuana, crack, powder cocaine, heroin, and methamphetamine) at each of the 10 locations served by the ADAM II program (Golub & Brownstein, 2012). That extended report uses the drug epidemics and drug generations frameworks as a basis to analyzing various logistic regression and graphical analyses. That study reports that at each of the 10 ADAM II locations, the use of marijuana was experiencing a plateau of widespread popularity, whereas the use of crack was in decline. A few locations had detected use of powder cocaine, heroin, or methamphetamine greater than 10% in any year. This article examines the drug generations associated with those drugs at those locations. The remainder of this section describes the drug epidemics framework and how drug epidemics lead to the rise of drug generations.
Drug Epidemics
Prior empirical research suggests that the popularity of a drug will often grow and then wane forming distinct drug epidemics (Becker, 1967; Hamid, 1992; Hunt & Chambers, 1976; Johnston, 1991; Musto, 1993). The natural course of these drug epidemics is mathematically similar to disease epidemics (Anderson & May, 1991) and to other diffusion of innovation phenomena such as the spread of new agricultural technology, teaching methods, or fashions (Rogers, 1995). Golub et al. (2005) identified that a drug epidemic tends to pass through four distinct phases: incubation, expansion, plateau, and decline. This framework was central in pinpointing the decline of the crack epidemic, its expected course for the near future, and the variation across locations (Golub & Johnson, 1994, 1996, 1997; Johnson, Golub, & Dunlap, 2006). The framework has been subsequently used to analyze the emergence of the latest Marijuana/Blunts1 Epidemic of the 1990s (Golub, 2005; Golub & Johnson, 2001; Golub, Johnson, Dunlap, & Sifaneck, 2004) as well as to study the course of the Heroin Injection Epidemic prevailing in the 1960s and early 1970s (Golub & Johnson, 2005; Johnson & Golub, 2002) and to evaluate the significance of a modest rise in use of hallucinogens such as MDMA in the 1990s (Golub, Johnson, Sifaneck, Chesluk, & Parker, 2001). The remainder of this section describes each phase.
Incubation Phase
A drug epidemic typically starts among a highly limited subpopulation. At that time, the use of a drug is uncommon. In general, the incubation phase cannot be identified in advance. It is only after an epidemic has undergone an expansion that one can estimate that an incubation period occurred and when. Ethnographic research indicates that the incubation phase for recent drug epidemics have been associated with very specific contexts involving social gatherings, music, and fashion. The Heroin Injection Epidemic grew out of the jazz music scene (Jonnes, 2002). The Crack Epidemic started with inner-city drug dealers at after-hours clubs (Hamid, 1992). In addition, the Marijuana/Blunts Epidemic was based on the hip-hop movement (Sifaneck, Kaplan, Dunlap, & Johnson, 2003).
Expansion Phase
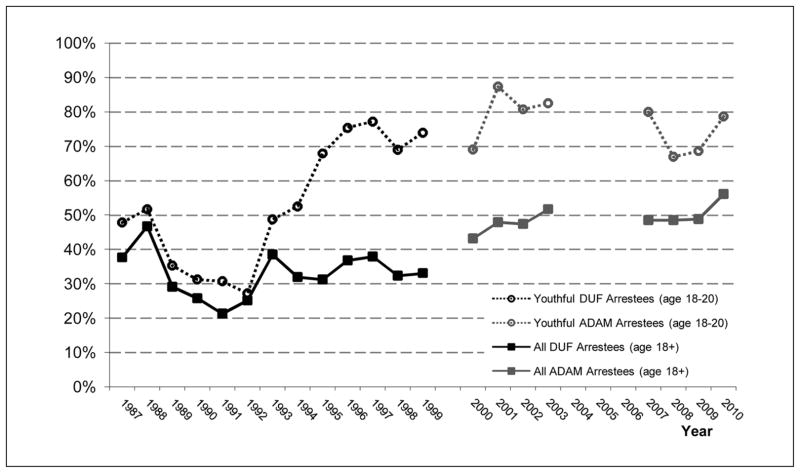
Sometimes, the pioneering drug users successfully introduce the practice to the broader population. At this point, a drug becomes popular and its use becomes the thing to do for many. The increasing prevalence of use tends to follow an S-shape with initial exponential growth that subsequently tapers off. Figure 1 illustrates the expansion phase for the Marijuana/Blunts Epidemic as it developed in Chicago. The chart presents previously published DUF arrestee data for 1987 through 1999 (Golub & Johnson, 2001). The ADAM data for 2000 to 2010 are original to this article and are described in the subsequent Method section. A gap is shown between 1999 and 2000 to indicate that the data collection procedures differed between the DUF and ADAM programs. The two time series should not be compared directly. However, we present both in this figure to illustrate the course of the Marijuana/Blunts Epidemic through the expansion phase with the DUF data and then plateau phase with the ADAM data. Figure 1 indicates that detected marijuana use among youthful adult arrestees declined to a low of 31% by 1991. This decline is consistent with declines at the time in youthful marijuana use in the general population nationwide as measured with data from the National Household Survey on Drug Abuse (NHSDA) and Monitoring the Future (MTF) programs (Golub & Johnson, 2001). In subsequent years, the rate of detected marijuana use among youthful adult arrestees increased according to a classic S-shape—quickly at first and then more slowly—reaching a plateau of 77% in 1997.
Figure 1.
Detected marijuana use among Chicago DUF and ADAM arrestees, 1987–2010
Note: DUF = Drug Use Forecasting; ADAM = Arrestee Drug Abuse Monitoring.
Plateau Phase
Eventually, everyone most at risk of initiating use of a new drug (typically users of other illicit drugs) has either initiated use or at least had the opportunity to do so. This point marks the end of the expansion and the beginning of the plateau phase. For a time, widespread use prevails. During this period, youths first coming of age typically initiate use of the currently popular drug(s), if any. These users form the core of a drug generation for whom the drug has particular symbolic significance based on their social activities and relationships. Figure 1 illustrates the plateau phase of the Marijuana/Blunts Epidemic among arrestees in Chicago during the 2000s using data from the ADAM program. The data indicate that detected marijuana use among youthful adult arrestees was high from 2000 to 2010 fluctuating between 67% and 83%.
Decline Phase
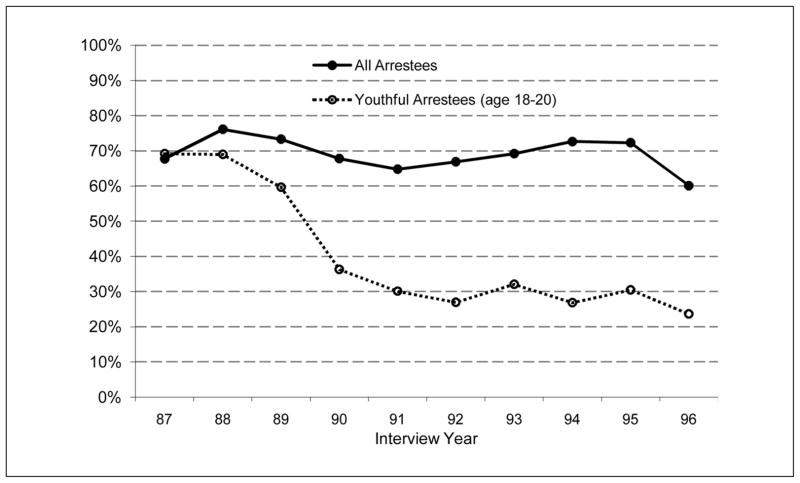
Eventually, the use of an illicit drug tends to go out of favor. The process involves the emergence of new conduct norms that hold that use of a drug is bad or old-fashioned. Ethnographic research revealed that early in the decline phase of the Crack Epidemic that “crackhead” became a dirty word in inner-city New York and that youths avoided peers they suspected had used (Curtis, 1998; Furst, Johnson, Dunlap, & Curtis, 1999). The subsequent diffusion of innovation process of antiuse sentiments then competes with the prevailing prouse norms. This leads to a gradual decline phase of a drug epidemic. During the decline phase, a decreasing proportion of youths coming of age become users. However, the overall use of the drug endures for many years as some members of a drug generation continue their habits. Figure 2 illustrates the decline phase for the Crack Epidemic occurring in Manhattan among arrestees starting in 1989 (Golub & Johnson, 1997). This chart also illustrates the importance of focusing on the drug use among youthful adult arrestees. From 1987 to 1995, the rate of detected cocaine/crack2 use among adult arrestees hovered around 70%. However, the rate of detected use among youthful adult arrestees decreased from 70% in 1988 down to 60% in 1989 and continued to drop to about 30% by 1991 where it remained through 1995. The rate declined further to 22% by 1996.
Figure 2.
Detected cocaine/crack use among Manhattan DUF arrestees, 1987–1996
Note: DUF = Drug Use Forecasting.
Drug Generations
Drug use clearly tends to vary across the life course. Adolescence typically involves many new experiences and is the peak period for initiation of alcohol, tobacco, and illicit drug use (Golub, Johnson, & Labouvie, 2000; Official of National Drug Control Policy [ONDCP], 2010b). Most persons who ever use illegal drugs tend to initiate use by their late teens or early twenties (Chen & Kandel, 1995; Johnston, 1991). For many, illegal drug use is limited to this youthful period. Many persons reduce or eliminate the use of illegal drugs as they enter young adulthood because use is incompatible with the cultural expectations associated with their new social roles as employees, adult members of the community, and parents (Bachman, Wadsworth, O’Malley, Johnston, & Schulenberg, 1997; Golub et al., 2004). However, prior research with the DUF and ADAM data indicates that a substantial percentage of illicit drugs users continue well into adulthood, especially those that continue to be arrested (Golub & Johnson, 1997, 2001). Accordingly, the variation in detected drug use among arrestees across birth years can identify those years that distinguish successive drug generations. Golub and Johnson (1999) estimated that among Manhattan arrestees the Heroin Injection Generation included primarily persons born between 1945 and 1954 who became involved with their drug-of-choice during the 1960s and early 1970s; members of the Crack Generation were born between 1955 and 1969 and became involved with crack during a relatively short period, 1985 to 1988; and members of the Marijuana/Blunts Generation were born since 1970 and have been coming of age since the 1990s.
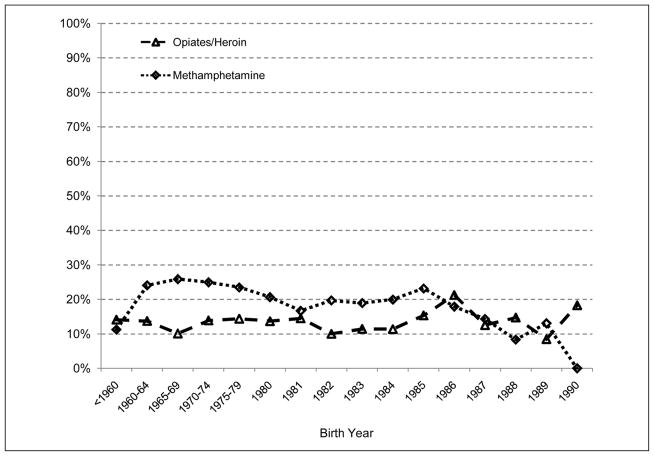
In addition to the four phases of a drug epidemic, in this article, we examine the possible phenomenon in which use of a drug use sometimes persists within a limited subpopulation in which case we refer to use as “endemic,” consistent with the terminology in medical epidemiology (Anderson & May, 1991). For example, in Portland (Oregon), opiates/heroin3 use did not vary substantially with an arrestee’s birth year (see Figure 11 appearing later in this article). This uniformity is consistent with the expected variation during an extended plateau phase of a drug epidemic. However, the rate of use was much less widespread than observed for crack and heroin during the plateau phase for the epidemics of their use. This type of variation is consistent with the possibility that use of a particular drug (such as heroin in Portland, Oregon) is embedded within some smaller subpopulations as opposed to being a trendy behavior more widespread across the broader population.
Figure 11.
Variation in detected heroin and methamphetamine use by birth cohort among ADAM Portland (Oregon) male arrestees, 2000–2010 (n = 4,293)
Note: ADAM = Arrestee Drug Abuse Monitoring.
Method
This article uses graphical procedures to visually display the birth years involved in the various drug generations prevailing among male arrestees at each of the 10 ADAM II locations.
The ADAM and ADAM II Programs
The predecessor to ADAM, the DUF program, was established in 1987 by the National Institute of Justice (NIJ) to measure trends in illicit drug use among booked arrestees across a geographically diverse group of local jurisdictions (NIJ, 2003a). Drug use trends among arrestees do not necessarily mirror those prevailing in the general population. However, arrestees are a group of great interest to law enforcement and other related agencies tasked with dealing with illegal drugs and related problems. In 2000, the DUF program underwent substantial improvement, especially with regard to obtaining a representative sample, and was renamed the ADAM program (NIJ, 2003a, 2004b). The program was temporarily discontinued after 2003. In 2007, the ADAM program was reintroduced by the ONDCP as the ADAM II program. The ADAM II program purposefully follows the same recruitment and interview procedures as its predecessor to maintain compatibility (Hunt & Rhodes, 2009; ONDCP, 2008). ADAM II collects data from adult male arrestees at 10 geographically diverse locations: Atlanta, Charlotte, Chicago, Denver, Indianapolis, Manhattan, Minneapolis, Portland (Oregon), Sacramento, and Washington, D.C. This analysis uses the public use data available from the National Archive of Criminal Justice Data (NACJD) for ADAM covering 2000–2003 and for ADAM II covering 2007–2010. Because of the gap between the ADAM and ADAM II programs, there are no data available for 3 years, 2004–2006. Specifically, the analysis focuses on the 37,933 adult male arrestees aged 18 and above who provided urine samples.
The ADAM program (hereafter referring to ADAM and ADAM II) approaches a representative sample of arrestees awaiting booking within 48 hr of their arrest at each participating location and asks them to complete a 20- to 25-min survey and provide a urine sample. They are offered a small incentive (e.g., a candy bar) for participation. Participation rates are generally strong. From 2000 to 2010, 75% to 86% of selected respondents who were available agreed to participate and 77% to 91% of them provided urine samples (NIJ, 2003a, 2003b, 2004a, 2004c; ONDCP, 2008, 2009, 2010a, 2011). In conjunction with data collection, the ADAM program uses censuses and propensity scoring to develop sample weights. When used in statistical calculations, these weights yield unbiased estimates for the target population of all adult male arrestees at each location.
The ADAM program performs urine tests to provide an objective measure of recent drug use not subject to respondents’ lack of full and accurate disclosure, which is a problem with the self-report data provided in other surveys (General Accounting Office, 1993; Harrison, Martin, Enev, & Harrington, 2007). The detection window differs between drugs (NIJ, 2003a; ONDCP, 2009). Methamphetamine, cocaine, and heroin pass through the system within 3 days. Marijuana can remain in the system for up to 30 days, depending on frequency of use. A major limitation of the urinalysis test used is that it does not distinguish mode of consumption. Arrestees who test positive for cocaine may have used crack or powder cocaine. Hence, we use the term detected cocaine/crack use. At the locations where more than 10% of arrestees in any year reported past-30-day use of powder cocaine, the analysis examined trends in self-reported past-30-day use of crack and powder cocaine to make further sense of trends in detected cocaine/crack use. These locations included Atlanta, Charlotte, Denver, Manhattan, and Portland (Oregon). The analysis of self-report data provided a rough indication of whether detected trends in cocaine/crack use might be due to changes in use of crack or powder cocaine. In general, self-report rates are much lower than detected rates. Similarly, the urinalysis tests do not distinguish between heroin and other opiates. Hence, we use the term detected opiate/heroin use.
Graphical Analysis of Variation Across Birth Cohorts
A graph of the variation in detected use of drugs as it varies across birth years is provided for each ADAM II location. For this analysis, the project combined all of the ADAM data collected from 2000 to 2010. Sample weights were used to provide unbiased estimates. Visual inspection of the graph was used to indicate a drug generation as those birth years with the highest rates of detected use. The graph also indicates those drug epidemics that are in decline as those drugs that are less popular among arrestees born more recently. The larger report based on this analysis includes graphical trend analyses by drug similar to those presented in Figures 1 and 2 in this article as well as logistic regression analyses to test whether the variation in use across birth years was statistically significant (Golub & Brownstein, 2012). The variation across birth years was statistically significant at the α = .05 level for each drug at each location except for opiates/heroin use in Portland (Oregon).
Data for the arrestees born before 1980 were combined into 5-year birth cohorts and pre-1960 for ease of presentation. Prevalence estimates for each location are provided for each birth year since 1980 in which at least 25 arrestees provided a urine sample. This minimum helped assure the reliability of estimates. The standard error (SE) is calculated according to the p(1 − p) following formula that reaches a maximum when the probability (p) is 50%: . A minimum sample size of 25 assures a maximum SE of 10%. Accordingly, in reading the graphs, limited credence was given to an estimate for a birth year that differs from the preceding birth year by as much as 20% (an approximate 95% confidence interval) unless rates were comparably high in successive birth years. The pre-1980 multiple birth year cohorts typically had 500 cases or more yielding more reliable estimates with SEs around 2%. ADAM interviewed many fewer arrestees in Washington, D.C. To track recent trends, Washington arrestees born between 1986 and 1988 and between 1989 and 1992 were combined into larger multiyear birth cohorts.
Results
This section presents estimates for the birth years that constitute each drug generation at each of the 10 ADAM II locations. The section ends with a comparison of drug generations across locations, including a summary (see Table 1) of the peak years of each drug generation at each location.
Table 1.
Peak Birth Years of Drug Generations among ADAM II 2000–2010 Male Arrestees
| ADAM II location | Peak birth years of a drug generation by drug
|
||
|---|---|---|---|
| Crack | Marijuana | Other drugs | |
| Atlanta | <1970 | 1981+ | |
| Charlotte | <1970 | 1980+ | |
| Chicago | <1970 | 1981+ | Heroin Generation <1975 |
| Denver | <1970 | 1982+ | Powder cocaine use is endemic |
| Indianapolis | <1975 | 1980+ | |
| Manhattan | <1970 | 1975+ | Heroin Generation <1960 |
| Minneapolis | <1970 | 1981+ | |
| Portland (Oregon) | <1965 | 1983+ | Powder cocaine use is endemic |
| Heroin use is endemic | |||
| Methamphetamine Generation 1960–1985 | |||
| Sacramento | <1960 | 1982+ | Methamphetamine Generation 1960–1980 |
| Washington, D.C. | <1965 | 1980+ | Heroin Generation <1965 |
Note: ADAM = Arrestee Drug Abuse Monitoring.
Atlanta
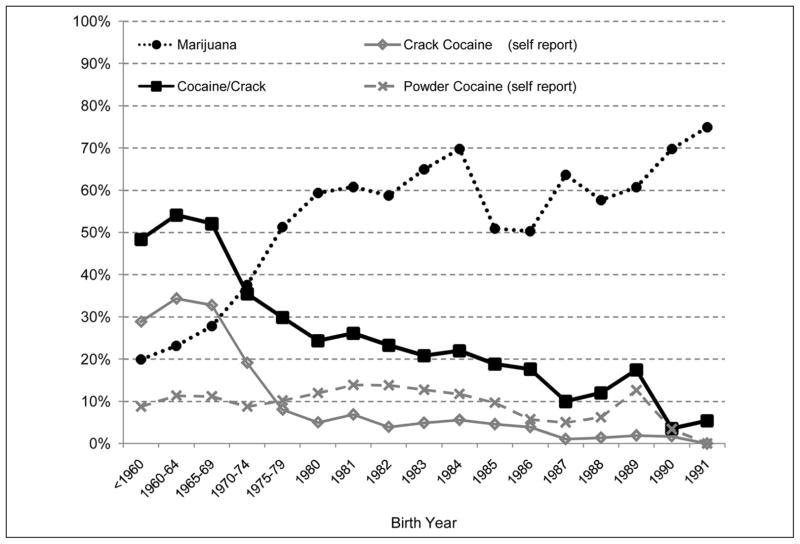
Figure 3 identifies two distinct drug generations among Atlanta arrestees. Arrestees born before 1970 clearly comprised the Crack Generation; more than half of them were detected as recent cocaine/crack users (56%–65%). Arrestees born between 1980 and 1990 were much less likely to be detected as recent cocaine/crack user (0%–31%). No arrestees born in 1990 tested positive for cocaine/crack. Self-report data indicate that arrestees born between 1980 and 1989 were much more likely to have used powder cocaine (3%–10%) as opposed to crack (0%–7%). This indicates that the Crack Epidemic had clearly drawn to a close in Atlanta as it is only older arrestees that persisted in their habits. Arrestees born since 1981 were clearly members of the Marijuana/Blunts Generation; the majority of them tested positive for recent marijuana use (62%–76%) in contrast to rates below 20% (17%–19%) among those born prior to 1965.
Figure 3.
Variation in detected drug use by birth cohort among ADAM Atlanta male arrestees, 2000–2010 (n = 3,468)
Note: ADAM = Arrestee Drug Abuse Monitoring.
Charlotte
Figure 4 indicates the clear presence of two drug generations among Charlotte arrestees. Arrestees born before 1970 comprised the Crack Generation; about half of them were detected as recent cocaine/crack users (48%–54%). There was a mostly steady decline in detected cocaine/crack use to 4% to 5% among those born between 1990 and 1991. The self-report data clearly indicate that crack was more common than powder cocaine among members of the Crack Generation born before 1970. This was not the case among those born since 1975. Among arrestees born between 1975 and 1979 self-reported use of crack and powder cocaine were about equally common. Crack use relative to use of powder cocaine declined even further. Exceedingly few arrestees born between 1987 and 1991 reported using crack (0%–2%). In contrast, some arrestees born between 1986 and 1991 reported use of powder cocaine (0%–13%), indicating that detected cocaine/crack use in recent years is most likely powder cocaine and not crack. This indicates that the Crack Epidemic has clearly drawn to a close in Charlotte as it is only older arrestees who persist in their habits. Arrestees born since 1980 were clearly members of the Marijuana/Blunts Generation; the rate of detected marijuana use fluctuated around 60% (50%–75%) among arrestees born between 1980 and 1991. The rates were much lower among those born prior to 1970 (20%–28%).
Figure 4.
Variation in detected drug use by birth cohort among ADAM Charlotte male arrestees, 2000–2010 (n = 2,785)
Note: ADAM = Arrestee Drug Abuse Monitoring.
Chicago
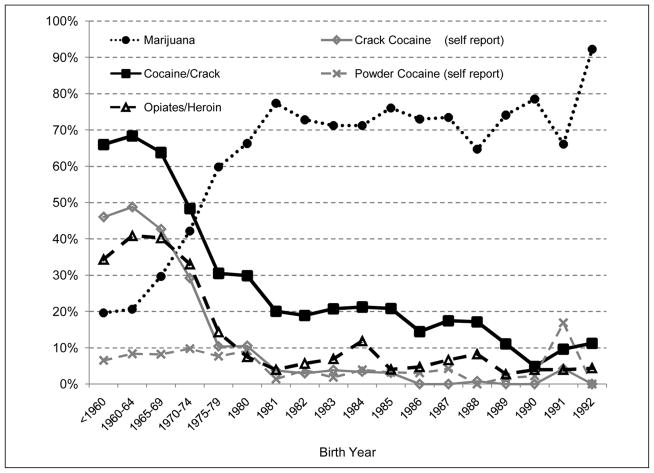
Figure 5 shows that use of cocaine/crack and opiates/heroin have tapered off among Chicago arrestees and that marijuana has emerged as the drug-of-choice among arrestees born more recently. The peak years of crack and heroin use in Chicago overlapped. The Crack Generation was coming to a close by the time of the 1970–1974 birth cohort. About two thirds (64%–68%) of arrestees born before 1970 were detected as recent cocaine/crack users. Among arrestees born between 1981 and 1988, detected cocaine/crack use had dropped to about 20% (14%–21%) and dropped to about 10% (5%–11%) among arrestees born between 1989 and 1992. The rates of self-reported crack (0%–4%) and powder cocaine (0%–4%, except for 17% for 1991) use among Chicago arrestees born since 1982 were extremely low making it difficult to clearly identify which was more common. The prevalence of detected opiates/heroin use was somewhat lower at its peak (40%–41% among those born between 1960 and 1969) than was cocaine/crack in Chicago. The Heroin Generation held on slightly longer in Chicago coming to a sudden close by the time of the 1975–1979 birth cohort. Detected opiates/heroin use (3%–12%) was even lower than detected cocaine/crack use among those born since 1980. Arrestees born since 1981 were clearly members of the Marijuana/Blunts Generation. Among these arrestees, the rate of detected marijuana use hit peaks above three quarters for some birth years (65%–92%). In contrast, the rates of detected marijuana use were much lower among those born before 1970 (20%–30%).
Figure 5.
Variation in detected drug use by birth cohort among ADAM Chicago male arrestees, 2000–2010 (n = 4,228)
Note: ADAM = Arrestee Drug Abuse Monitoring.
Denver
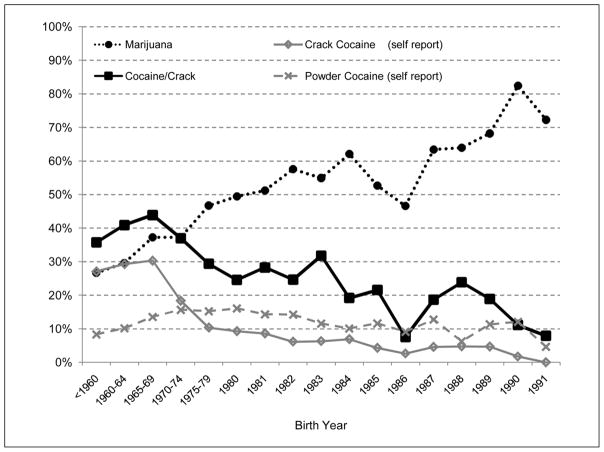
Figure 6 indicates the presence of two drug generations among Denver arrestees. Arrestees born before 1970 clearly comprised the Crack Generation; about two fifths of them were detected as recent cocaine/crack users (36%–44%). The rate of detected cocaine/crack use declined slowly across birth years to a low around 10% among those born between 1990 and 1991 (8%–11%). The slowness of the decline, however, is likely attributable to a sustained popularity of powder cocaine use and not crack. Self-report data indicate a clear drop in reported crack use from a peak of 30% among those born between 1965 and 1969 down to 18% among those born between 1970 and 1974 then a steady decline from 10% among those born between 1975 and 1979 down 0% among those born in 1991. In contrast, self-reports of powder cocaine use fluctuated between 5% and 16% across all birth years and did not exhibit a sustained downward trend. In this respect, powder cocaine was endemic among some subpopulations that tend to sustain arrests in Denver. The rates of detected cocaine/crack use around 20% among arrestees born in the 1980s when powder cocaine was more popular than crack were lower than the rates of detected cocaine/crack use around 40% among those born before 1970 when crack was more common and much lower than the rates around 60% for detected marijuana use among arrestees born since 1982. Detected marijuana use rose steadily across birth years from 27% among those born before 1960 to around 60% and above (47%–82%) among those born since 1982.
Figure 6.
Variation in detected drug use by birth cohort among ADAM Denver male arrestees, 2000–2010 (n = 4,458)
Note: ADAM = Arrestee Drug Abuse Monitoring.
Indianapolis
Figure 7 clearly indicates two drug distinct generations of drug users among Indianapolis arrestees. Arrestees born before 1975 comprised the Crack Generation; about 40% of them were detected as recent cocaine/crack users (37%–45%). There was a decline in detected cocaine/crack use to about 20% (16%–23%) among those born between 1975 and 1983 and then a further decline to about 10% or less (0%–14%) among those born between 1984 and 1992. Arrestees born since 1980 were clearly members of the Marijuana/Blunts Generation; the rate of detected marijuana use for each birth year was about 60% or more (56%–78%). The rates were much lower among those born before 1970 (22%–37%). Arrestees born between 1970 and 1974 represent the transition period. Their rate of detected use of cocaine/crack (37%) was nearly as high as those of previous birth cohorts, and their rate of detected marijuana use (50%) was also nearly as high as those born in subsequent years.
Figure 7.
Variation in detected drug use by birth cohort among ADAM Indianapolis male arrestees, 2000–2010 (n = 4,537)
Note: ADAM = Arrestee Drug Abuse Monitoring.
Manhattan
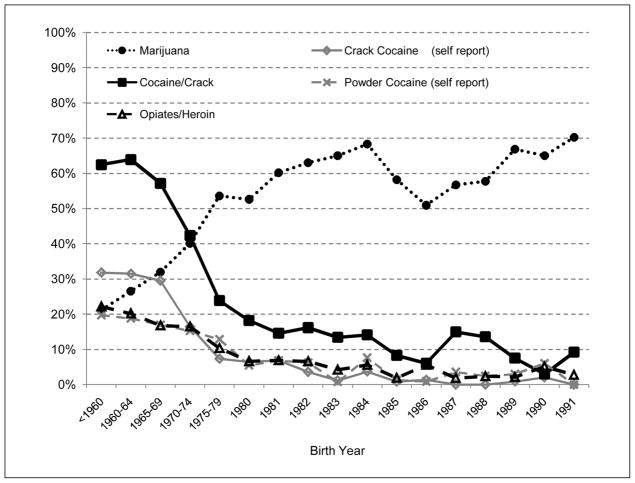
Figure 8 shows that use of cocaine/crack and opiates/heroin have tapered off among Manhattan arrestees and that marijuana has emerged as the drug-of-choice among arrestees born more recently. Golub and Johnson (1999) prepared a similar chart using DUF data collected during 1987 to 1997. That analysis found the Heroin Injection Generation as distinguished by the peak birth years for heroin and injection drug use were born between 1945 and 1954. Figure 8 indicates that detected opiates/heroin use had declined to the single digits among arrestees born since 1980 (2%–7%). Cocaine/crack use dropped off even more dramatically than heroin. About 60% (57%–64%) of arrestees born before 1970 were detected as recent cocaine/crack users. Among arrestees born between 1980 and 1988, detected cocaine/crack use was about 15% (6%–18%) and declined below 10% (3%–9%) among those born between 1989 and 1991. Self-report data indicate that crack (16%–32%) and powder cocaine (15%–20%) use were common among arrestees born before 1975. Too few arrestees born since 1980 reported use of crack (0%–7%) or powder cocaine (0%–8%) to accurately estimate which drug accounted for the detected cocaine/crack use among these arrestees. Arrestees born since 1975 were clearly members of the Marijuana/Blunts Generation; at least half (51%–70%) of all arrestees from each birth cohort were detected as recent marijuana users. The rates were much lower among those born before 1970 (21%–32%).
Figure 8.
Variation in detected drug use by birth cohort among ADAM Manhattan male arrestees, 2000–2010 (n = 4,689)
Note: ADAM = Arrestee Drug Abuse Monitoring.
Minneapolis
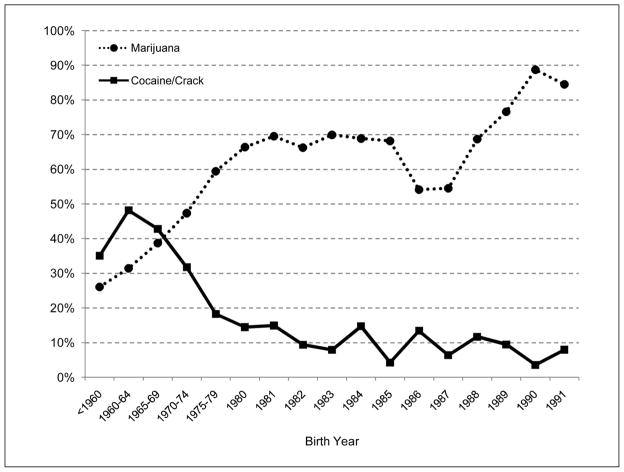
Figure 9 clearly indicates two distinct drug generations among Minneapolis arrestees. Arrestees born before 1970 comprised the Crack Generation; about 40% of them were detected as recent cocaine/crack users (35%–48%). There was a decline in detected cocaine/crack use to about 10% (4%–15%) among arrestees born since 1982. Arrestees born since 1981 were clearly members of the Marijuana/Blunts Generation. The rate of detected marijuana use among those born in 1981 reached 70% and then fluctuated fairly widely (54%–89%).
Figure 9.
Variation in detected drug use by birth cohort among ADAM Minneapolis male arrestees, 2000–2010 (n = 4,336)
Note: ADAM = Arrestee Drug Abuse Monitoring.
Portland (Oregon)
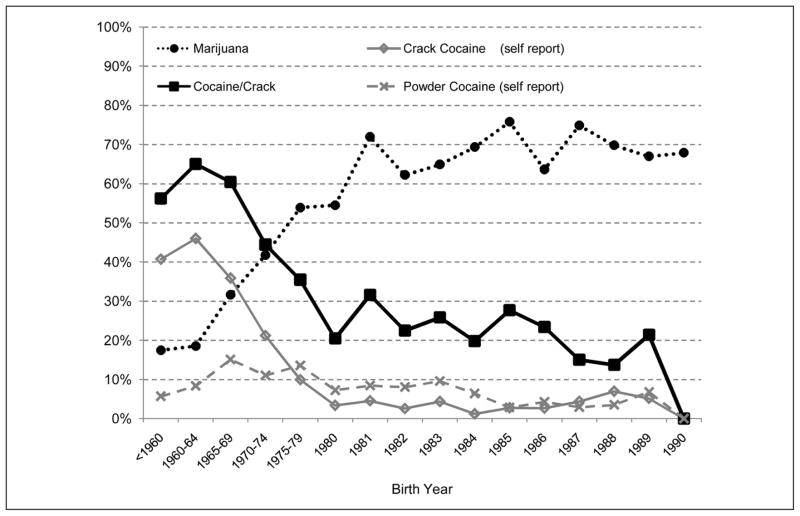
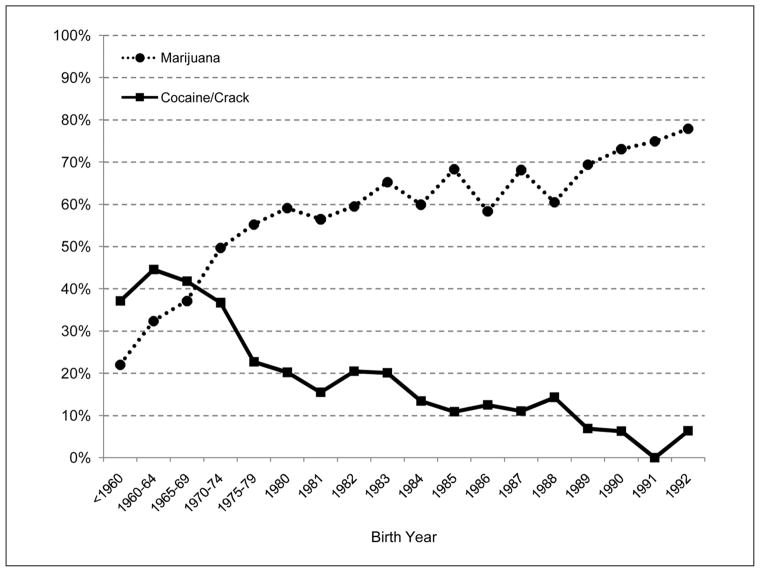
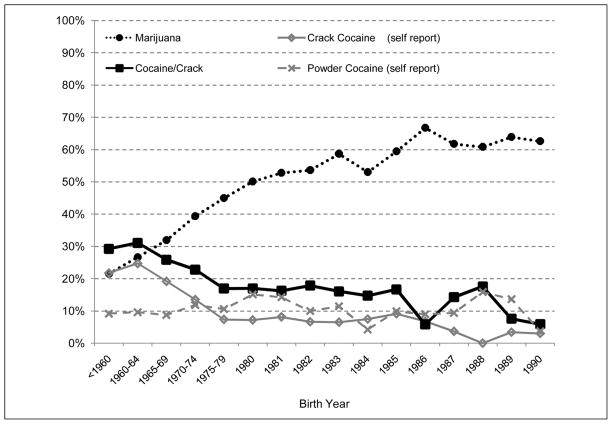
Drug use among Portland arrestees has involved fairly widespread use of five drugs. In addition to marijuana, crack, and powder cocaine, Portland has had substantial use of opiates/heroin and methamphetamine. Consequently, the variation in drug use across birth cohorts is presented as two graphs: Figures 10 and 11. Figure 10 indicates that detected cocaine/crack use among arrestees in Portland (Oregon) was most common among those born before 1965 (29%–31%). Detected cocaine/crack tapered off among arrestees born in subsequent years to just below 20% among those born between 1975 and 1985 (15%–18%) and dropped further to 6%–8% among those born between 1989 and 1990. However, the self-report data suggest that crack use declined more sharply. Self-reported crack use declined from 25% among those born between 1960 and 1964 to below 10% among those born between 1975 and 1986 (7%–9%) to below 5% among those born since 1987 (0%–4%). In contrast, self-reported powder cocaine use fluctuated around 10% across all birth years (4%–16%). This self-report information suggests that powder cocaine use has been endemic within a subpopulation of those persons in Portland who tend to sustain arrests. The findings also strongly suggest the detected cocaine/crack use among arrestees born more recently was the result of powder cocaine use and not crack. Figure 10 indicates that arrestees born since 1983 were clearly members of the Marijuana/Blunts Generation; among these arrestees, the rate of detected marijuana use was consistently around 60% (53%–67%). The rate was much lower among those born before 1970 (22%–32%).
Figure 10.
Variation in detected cocaine/crack and marijuana use by birth cohort among ADAM Portland (Oregon) male arrestees, 2000–2010 (n = 4,293)
Note: ADAM = Arrestee Drug Abuse Monitoring.
Figure 11 shows that detected opiates/heroin use was relatively constant across all birth cohorts at just over 10% (8%–21%) indicating that heroin use has been endemic within a sub-population of those persons in Portland who tend to sustain arrests. Detected methamphetamine use had also been relatively constant at about 20% of all arrestees born between 1960 and 1985 (17%–26%). However, the rate dropped to the low teens among those born between 1987 and 1989 (8%–14%) and to zero among those born in 1990. This finding is consistent with the possibility that the methamphetamine epidemic entered the decline phase. As part of an ongoing study of methamphetamine markets, law enforcement officers in Portland and other Oregon cities were asked about the lesser level of methamphetamine use among younger arrestees (Brownstein et al., 2012; Taylor et al., 2011). The officers suggested that while methamphetamine use persists among older individuals, the use of prescription opiates followed by heroin use has become a greater problem involving young people in the area.
Sacramento
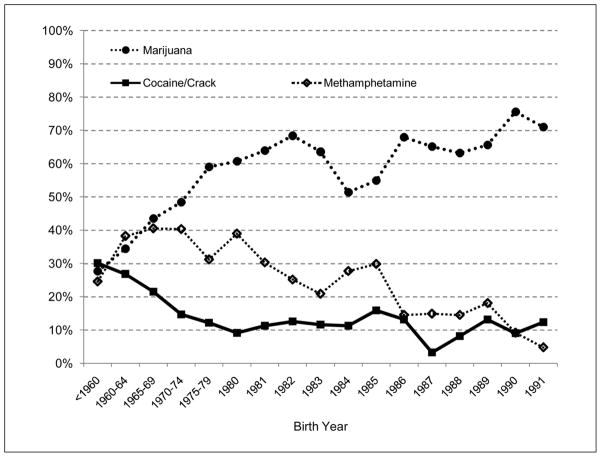
Figure 12 indicates a series of three drug generations in Sacramento: the Crack, Methamphetamine, and Marijuana Generations. Detected cocaine/crack use declined steadily from a high of 30% among those born before 1960 down to fluctuate around 10% among those born since 1975 (3%–16%). Detected methamphetamine use peaked at about 40% among those born between 1960 and 1980 (31%–41%) and then declined to less than 20% among those born since 1986 and 1989 (15%–18%), and further declined to 5% among those born in 1991. Detected marijuana use increased steadily from a low of 28% among those born before 1960 up to 68% among those born in 1982 and fluctuated moderately thereafter (51%–76%).
Figure 12.
Variation in detected drug use by birth cohort among ADAM Sacramento male arrestees, 2000–2010 (n = 4,242)
Note: ADAM = Arrestee Drug Abuse Monitoring.
Washington, D.C
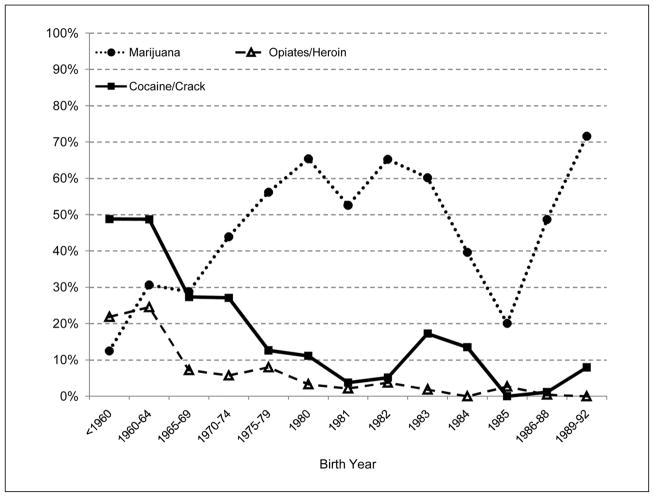
Figure 13 identifies three successive drug generations in Washington, D.C. Detected cocaine/crack use declined from nearly half (49%) among arrestees born before 1965 to 13% among those born between 1975 and 1979. Detected opiates/heroin use also declined from a high of 25% among those born between 1960 and 1964 down to below 5% among those born between 1980 and 1992 (0%–4%). Detected marijuana use increased from a low of 12% among those born before 1960 to fluctuate widely but regularly above 50% among arrestees born since 1980 (20%–72%).
Figure 13.
Variation in detected drug use by birth cohort among ADAM Washington, D.C., male arrestees, 2000–2010 (n = 897)
Note: ADAM = Arrestee Drug Abuse Monitoring.
Summary and Discussion
Table 1 presents a summary of drug generation findings for the 10 ADAM II locations. The data clearly indicate that the crack epidemic has been in its decline phase among people who tend to sustain arrests. The timing of the Crack Generation varied modestly across sites. At most locations, it was arrestees born before 1970 who were most likely to be detected as recent cocaine/crack users. At several locations, the Crack Generation entered the decline phase somewhat earlier (including Portland, Oregon; Sacramento; and Washington, D.C.). In Indianapolis, the Crack Epidemic had started later (Golub & Johnson, 1997) and the ADAM II data indicate that it entered the decline phase later. However, even though the Crack Epidemic is in the decline phase, it does not mean that the Crack Epidemic is over. More accurately, it can be said that the Crack Epidemic is drawing to a close at each location. The presence of an older Crack Generation clearly indicates a need for interventions that target these persistent users at each location. These services may be needed well into the future (perhaps decades) as an aging cohort of crack users continue to struggle with addiction, cause public safety concerns, and attempt social reintegration with varying success.
The drug-of-choice among arrestees born more recently has been and continues to be marijuana. The start of the peak birth years for the Marijuana/Blunts Generation varied modestly across ADAM II locations from 1975 through 1983. At each location, the peak years extended through the most recent birth cohorts analyzed. These findings are consistent with the idea that the Marijuana/Blunts Epidemic was still in the plateau phase as of 2010 (also see Weisheit & White, 2009). To the extent that marijuana use is involved with fewer drug-related problems than crack cocaine, this is good news (see Johnson et al., 2006, for a more extended discussion). In addition, with several states introducing medical marijuana programs allowing citizens to use and grow marijuana legally, the attitudes of law enforcement in many of these areas are changing, so the place of the expanding population of marijuana users in their communities may not be as disruptive as it might be for other illicit drugs.
Table 1 also brings into relief one of the primary advantages of the ADAM data. The ADAM program collects location-specific information, which facilitates tracking how drug epidemics vary across locations. Heroin use was limited to four locations and was in decline at three of the four. The peak years of the Heroin Generation among arrestees varied from before 1960 for Manhattan to before 1965 for Washington, D.C., and somewhat later (before 1975) for Chicago. Heroin use appears to be endemic to Portland. The rate of detected heroin use was relatively constant across birth years from those born before 1960 through those born 1990. This strongly suggests that heroin use is embedded within a small population that continues to attract new young users, a conclusion supported by reports from Oregon police interviewed for the methamphetamine market study noted earlier.
The use of powder cocaine appears to be endemic at two locations: Denver and Portland (Oregon). The use of powder cocaine is nowhere nearly as widespread as crack had been at the peak of its popularity. In this regard, cocaine powder does not represent as large an immediate problem as crack had. However, it represents a persistent problem that may be unlikely to go away over time on its own. This drug use behavior is likely rooted in the experiences of one specific subpopulation that tends to sustain arrests.
This analysis yielded surprising results regarding methamphetamine. Its use had been widespread in the West and was spreading to the Midwest and Southeast (Brownstein et al., 2012; Herz, 2000; Hunt, Kuck, & Truitt, 2005; NIJ, 2003a; Taylor et al., 2011; Weisheit & White, 2009). In response, there have been concerted efforts to reduce methamphetamine use through prevention and supply reduction (National Drug Intelligence Center, 2007; Taylor et al., 2011). The data suggest that there has been a shift in the popularity of methamphetamine at the two ADAM II locations with any substantial methamphetamine use: Sacramento and Portland (Oregon). In both West Coast locations, the Methamphetamine Epidemic appears to have entered the decline phase (also see Weisheit & White, 2009). The Methamphetamine Generation represents a delimited population at each location. In Sacramento, the peak birth years for the Methamphetamine Generation among arrestees were 1960 to 1980. In Portland (Oregon), the peak birth years were 1960 to 1985 suggesting that the Methamphetamine Epidemic entered the decline phase slightly later in Portland (Oregon) than in Sacramento. In fact, when asked about its use for the methamphetamine market study, police in Portland agreed that it is still around but that the greater problem has become pharmaceutical opiates and heroin use among young people.
Conclusion
This article has highlighted the importance of location-specific drug use data, such as the data collected by the ADAM program. The drug generations framework and graphical procedure presented in this article provide a powerful and efficient approach to concisely analyze drug use data. This approach builds upon extensive published research on the drug epidemics framework. Another value to the drug generations framework is that it is amenable to use with cross-sectional data. The drug epidemics framework requires that a location set up and maintain a data collection program, like ADAM, to be able to track the course of epidemics as they progress. As an alternative, a community could make use of the drug generations approach by taking a single cross-sectional survey and examining the variation in drug use across birth cohorts. This approach as illustrated in this article provides information about the current state of a drug epidemic, especially whether it has entered the decline phase or not. This line of research provides other insights into how criminal justice practitioners and those in related fields can analyze existing data to provide information regarding the passing of drug epidemics. Other existing data—such as arrest records, treatment data, or reports from key informants such as youth program coordinators and community leaders—could be used to identify whether a drug epidemic is entering its decline phase to the extent that they indicate that use is less prevalent among youths. The experiences of youths are key.
Limitations
The major limitation to this analysis is that it focused exclusively on male arrestees from the 10 urban locations included in the ADAM II program. The trends identified do not necessarily parallel the trends in the general population. In addition, there may be variations in drug use across gender not detectable with ADAM data. A major value of this study is that it confirms its own geographic limitations. The sometimes-idiosyncratic drug use trends identified strongly suggest that it can be difficult and sometimes inappropriate to try to generalize the findings of this analysis based on 10 locations to the nation overall or to other locations not included in the ADAM II program. The broader trends in decreasing use of crack and increasing use of marijuana across recent birth cohorts are repeated across locations suggesting these patterns may be occurring broadly, at least in urban areas. The ADAM II locations provide geographic diversity, but the program does not include any rural locations. Hence, it would be inappropriate to project the broader trends identified here to rural areas. Another problem is the possible existence of individual locations that are exceptions to the broader trends. Conceivably, there could be some locations where crack may still be common among youthful adult arrestees and marijuana less common. This potential for location-specific trends is very important with regard to tracking the use of heroin, powder cocaine, and methamphetamine, which were common at only a few of the 10 locations studied. These substantial variations across locations indicate that it is not possible to tell whether a community is dealing with these less common drugs and the nature of any trends in use without data specific to that location. This location-specific focus is the primary advantage and the central limitation of the ADAM data.
Acknowledgments
Funding
The authors disclosed receipt of the following financial support for the research, authorship, and/or publication of this article: This research was funded in part by grants from the National Institute of Justice (2010-IJ-CX-0011; 2010-93098-NY-IJ), the National Institute on Alcohol Abuse and Alcoholism (R01 AA020178), and the National Institute on Drug Abuse (R21 DA024391). Additional funding was provided by National Development and Research Institutes, Inc., and NORC at the University of Chicago.
Biographies
Andrew Golub, PhD, is a principal investigator at National Development and Research Institutes, Inc. His research focuses upon understanding drug use trends in context with a view toward developing appropriate and effective public policies.
Henry H. Brownstein, PhD, is a senior fellow at NORC at the University of Chicago. He was formerly with the National Institute of Justice and has written extensively about drug markets and the relationship between drugs and crime and violence.
Footnotes
A blunt is an inexpensive cigar in which the tobacco is replaced with marijuana. Many youths, especially African Americans, prefer to smoke their marijuana in a blunt as opposed to a joint or pipe. We use the term Marijuana/Blunts Epidemic to distinguish the recent upsurge in marijuana use from the widespread marijuana use that prevailed in the 1960s and 1970s.
We use the term cocaine/crack because the urinalysis test used by the DUF and ADAM programs does not distinguish between powder cocaine and crack. Much of the cocaine use in the 1980s and 1990s was in the form of crack.
We use the term opiates/heroin because the urinalysis test used by the ADAM program does not distinguish the use of heroin from other opiates. Presumably, most of the opiate use detected is for heroin, which has been widely used among persons who tend to sustain arrests.
Points of view in this article do not necessarily represent the official position of the U.S. Government, NIJ, NIAAA, NIDA, NDRI, or NORC.
Declaration of Conflicting Interests
The authors declared no potential conflicts of interest with respect to the research, authorship, and/or publication of this article.
References
- Anderson RM, May RM. Infectious diseases of humans: Dynamics and control. Oxford, UK: Oxford University Press; 1991. [Google Scholar]
- Bachman JG, Wadsworth KN, O’Malley PM, Johnston LD, Schulenberg JE. Smoking, drinking and drug use in young adulthood: The impacts of new freedoms and new responsibilities. Mahwah, NJ: Lawrence Erlbaum; 1997. [Google Scholar]
- Becker HS. History, culture, and subjective experience: An exploration of the social bases of drug-induced experiences. Journal of Health and Social Behavior. 1967;8:163–176. [PubMed] [Google Scholar]
- Brownstein HH, Mulcahy TJ, Taylor BG, Fernandes-Huessy J, Woods D. The organization and operation of illicit retail drug markets. Criminal Justice Policy Review. 2012;23:67–89. [Google Scholar]
- Caulkins JP, Tragler G, Wallner D. Optimal timing of use reduction vs. harm reduction in a drug epidemic model. International Journal of Drug Policy. 2009;20:480–487. doi: 10.1016/j.drugpo.2009.02.010. [DOI] [PubMed] [Google Scholar]
- Chen K, Kandel DB. The natural history of drug use from adolescence to the mid-thirties in a general population sample. American Journal of Public Health. 1995;85:41–47. doi: 10.2105/ajph.85.1.41. [DOI] [PMC free article] [PubMed] [Google Scholar]
- Curtis R. The improbably transformation of inner-city neighborhoods: Crime, violence, drugs and youth in the 1990s. Journal of Criminal Law and Criminology. 1998;88:1233–1276. [Google Scholar]
- Furst RT, Johnson BD, Dunlap E, Curtis R. The stigmatized image of the crack head: A sociocultural exploration of a barrier to cocaine smoking among a cohort of youth in New York City. Deviant Behavior. 1999;20:153–181. [Google Scholar]
- General Accounting Office. Drug use measurement: Strengths, limitations, and recommendations for improvement. Washington, DC: U.S. Author; 1993. [Google Scholar]
- Golub A. The cultural/subcultural contexts of marijuana use at the turn of the twenty-first century. Binghamton, NY: Haworth; 2005. [Google Scholar]
- Golub A, Brownstein HH. Monitoring drug epidemics and the markets that sustain them using ADAM II (Final report to the National Institute of Justice) Rockville, MD: National Criminal Justice Reference Service; 2012. https://www.ncjrs.gov/pdffiles1/nij/grants/239906.pdf. [Google Scholar]
- Golub A, Johnson BD. A recent decline in cocaine use among youthful arrestees in Manhattan (1987–1993) American Journal of Public Health. 1994;84:1250–1254. doi: 10.2105/ajph.84.8.1250. [DOI] [PMC free article] [PubMed] [Google Scholar]
- Golub A, Johnson BD. The crack epidemic: Empirical findings support a hypothesized diffusion of innovation process. Socio-Economic Planning Sciences. 1996;30:221–231. [Google Scholar]
- Golub A, Johnson BD. Crack’s decline: Some surprises across US cities (Research in Brief, NCJ 165707) Washington, DC: National Institute of Justice; 1997. [Google Scholar]
- Golub A, Johnson BD. Cohort changes in illegal drug use among arrestees in Manhattan: From the heroin injection generation to the blunts generation. Substance Use & Misuse. 1999;34:1733–1763. doi: 10.3109/10826089909039425. [DOI] [PubMed] [Google Scholar]
- Golub A, Johnson BD. The rise of marijuana as the drug of choice among youthful adult arrestees (Research in Brief, NCJ 187490) Washington, DC: National Institute of Justice; 2001. [Google Scholar]
- Golub A, Johnson BD. The new heroin users among manhattan arrestees: Variations by race/ethnicity and mode of consumption. Journal of Psychoactive Drugs. 2005;37:51–61. doi: 10.1080/02791072.2005.10399748. [DOI] [PubMed] [Google Scholar]
- Golub A, Johnson BD, Dunlap E. Subcultural evolution and substance use. Addiction Research & Theory. 2005;13:217–229. doi: 10.1080/16066350500053497. [DOI] [PMC free article] [PubMed] [Google Scholar]
- Golub A, Johnson BD, Dunlap E, Sifaneck S. Projecting and monitoring the life course of the marijuana/blunts generation. Journal of Drug Issues. 2004;34:361–388. doi: 10.1177/002204260403400206. [DOI] [PMC free article] [PubMed] [Google Scholar]
- Golub A, Johnson BD, Labouvie E. On correcting biases in self-reports of age at first substance use with repeated cross-section analysis. Journal of Quantitative Criminology. 2000;16:45–68. doi: 10.1023/A:1007573411129. [DOI] [PMC free article] [PubMed] [Google Scholar]
- Golub A, Johnson BD, Sifaneck S, Chesluk B, Parker H. Is the U.S. experiencing an incipient epidemic of hallucinogen use? Substance Use & Misuse. 2001;36:1699–1729. doi: 10.1081/ja-100107575. [DOI] [PMC free article] [PubMed] [Google Scholar]
- Hamid A. The developmental cycle of a drug epidemic: The cocaine smoking epidemic of 1981–1991. Journal of Psychoactive Drugs. 1992;24:337–348. doi: 10.1080/02791072.1992.10471658. [DOI] [PubMed] [Google Scholar]
- Harrison LD, Martin SS, Enev T, Harrington D. Comparing drug testing and self-report of drug use among youths and young adults in the general population. Rockville, MD: Substance Abuse and Mental Health Services Administration, Office of Applied Studies; 2007. [Google Scholar]
- Herz DC. Drugs in the heartland: Methamphetamine use in rural Nebraska (Research in Brief, NCJ 180986) Washington, DC: National Institute of Justice; 2000. [Google Scholar]
- Hunt D, Kuck S, Truitt L. Methamphetamine use: Lessons learned, report submitted to the national institute of justice. Cambridge, MA: Abt Associates; 2005. [Google Scholar]
- Hunt D, Rhodes W. Arrestee drug abuse monitoring program II in the United States, 2008: Technical Documentation Report. Inter-university Consortium for Political and Social Research; 2009. Available from http://www.icpsr.umich.edu. [Google Scholar]
- Hunt LG, Chambers CD. The heroin epidemic: A study of heroin use in the US, 1965–1975 (Part II) Holliswood, NY: Spectrum; 1976. [Google Scholar]
- Johnson BD, Golub A. Generational trends in heroin use and injection among arrestees in New York City. In: Musto D, editor. One hundred years of heroin. Westport, CT: Auburn House; 2002. pp. 91–128. [Google Scholar]
- Johnson BD, Golub A. Sociocultural issues. In: Lowinson J, Ruiz P, Millman R, Langrod J, editors. Substance abuse: A comprehensive textbook. Baltimore, MD: Williams & Wilkins; 2005. pp. 4pp. 107–120. [Google Scholar]
- Johnson BD, Golub A, Dunlap E. The rise and decline of drugs, drug markets, and violence in New York City. In: Blumstein A, Wallman J, editors. The crime drop in America. New York, NY: Cambridge University Press; 2006. pp. 164–206. Rev. ed. [Google Scholar]
- Johnston LD. Toward a theory of drug epidemics. In: Donohew DH, Sypher H, Bukoski W, editors. Persuasive communication and drug abuse prevention. Hillsdale, NJ: Lawrence Erlbaum; 1991. pp. 93–132. [Google Scholar]
- Jonnes J. Hip to be high: Heroin and popular culture in the twentieth century. In: Musto DF, editor. One hundred years of heroin. Westport, CT: Auburn House; 2002. pp. 227–236. [Google Scholar]
- Musto D. The rise and fall of epidemics: Learning from history. In: Edwards G, Strang J, Jaffe JH, editors. Drugs, alcohol, and tobacco: Making the science and policy connections. New York, NY: Oxford University Press; 1993. pp. 278–284. [Google Scholar]
- National Drug Intelligence Center. National drug threat assessment 2008. Washington, DC: U.S. Department of Justice; 2007. [Google Scholar]
- National Institute of Justice. 2000 arrestee drug abuse monitoring: Annual report. Washington, DC: U.S. Department of Justice; 2003a. [Google Scholar]
- National Institute of Justice. Arrestee drug abuse monitoring (ADAM) program in the United States, 2001: User guide. Washington, DC: U.S. Department of Justice; 2003b. [Google Scholar]
- National Institute of Justice. Arrestee drug abuse monitoring (ADAM) program in the United States, 2002: User guide. Washington, DC: U.S. Department of Justice; 2004a. [Google Scholar]
- National Institute of Justice. Arrestee drug abuse monitoring (ADAM) program in the United States, 2003: Codebook, data collection instruments, and other documentation. National Archive of Criminal Justice Data. 2004b Available from http://www.icpsr.umich.edu.
- National Institute of Justice. Arrestee drug abuse monitoring (ADAM) program in the United States, 2003: User guide. Washington, DC: U.S. Department of Justice; 2004c. [Google Scholar]
- Official of National Drug Control Policy. ADAM II: 2007 annual report. Author; 2008. Available from http://www.whitehousedrugpolicy.gov. [Google Scholar]
- Official of National Drug Control Policy. ADAM II: 2008 annual report. Author; 2009. Available from http://www.whitehousedrugpolicy.gov. [Google Scholar]
- Official of National Drug Control Policy. ADAM II: 2009 annual report. Author; 2010a. Available from http://www.whitehousedrugpolicy.gov. [Google Scholar]
- Official of National Drug Control Policy. Use of high intensity drug trafficking area funds to combat methamphetamine trafficking. Washington, DC: Executive Office of the President; 2010b. [Google Scholar]
- Official of National Drug Control Policy. ADAM II: 2010 annual report. Author; 2011. Available from http://www.whitehousedrugpolicy.gov. [Google Scholar]
- Rogers EM. Diffusion of innovation. 4. New York, NY: Free Press; 1995. [Google Scholar]
- Sifaneck SJ, Kaplan CD, Dunlap E, Johnson BD. Blunts and blowtjes: Cannabis use practices in two cultural settings and their implications for secondary prevention. Free Inquiry in Creative Sociology. 2003;31:1–11. [Google Scholar]
- Taylor BG, Brownstein HH, Mulcahy TJ, Woods D, Fernandes-Huessy J, Hafford C. Illicit retail methamphetamine markets and related local problems: A police perspective. Journal of Drug Issues. 2011;41:327–358. [Google Scholar]
- Weisheit R, White WL. Methamphetamine: Its history, pharmacology, and treatment. Center City, MN: Hazelden; 2009. [Google Scholar]


