

Abstract
A large and ethnically well-defined Mandenka sample from eastern Senegal was analyzed for the polymorphism of the β-globin gene cluster on chromosome 11. Five RFLP sites of the 5′ region were investigated in 193 individuals revealing the presence of 10 different haplotypes. The frequency of the sickle-cell anemia causing mutation (βS) in the Mandenka estimated from this sample is 11.7%. This mutation was found strictly associated with the single Senegal haplotype. Approximately 600 bp of the upstream region of the β-globin gene were sequenced for a subset of 94 chromosomes, showing the presence of four transversions, five transitions, and a composite microsatellite polymorphism. The sequence of 22 βS chromosomes was also identical to the previously defined Senegal haplotype, suggesting that this mutation is very recent. Monte Carlo simulations (allowing for a specific balancing selection model, a logistic growth of the population, and variable initial frequencies of the Senegal haplotype) were used to estimate the age of the βS mutation. Resulting maximum-likelihood estimates are 45–70 generations (1,350–2,100 years) for very different demographic scenarios. Smallest confidence intervals (25–690 generations) are obtained under the hypothesis that the Mandenka population is large (Ne >5,000) and stationary or that it has undergone a rapid demographic expansion to a current size of >5,000 reproducing individuals, which is quite likely in view of the great diversity found on βA chromosomes.
Introduction
Because of its link with several molecular diseases (Orkin et al. 1983; Antonarakis et al. 1985; Nagel and Fleming 1992), the molecular polymorphism of the β-globin gene cluster has been extensively studied in human populations during the past 20 years (e.g., see Antonarakis et al. 1982; Wainscoat et al. 1986; Chen et al. 1990; Long et al. 1990; Fullerton et al. 1994; Harding et al. 1997). The 5′ gene region of the β-globin gene cluster that harbors fetal and embryonic genes exhibits high levels of linkage disequilibrium (Antonarakis et al. 1982). A recombination hot spot was located within a 9-kb DNA segment separating the 5′ subhaplotypes from the 3′ part of the cluster (Chakravarti et al. 1984), which includes the adult β-globin gene. A polymorphic repetitive sequence located 500 bp upstream of the β-globin gene, in the vicinity of the recombination hot spot, is probably associated with the replication origin (Fullerton et al. 2000a).
Comparative studies of several human populations have concentrated on the diversity associated with βA chromosomes. They have shown an overall larger extent of diversity for that region in sub-Saharan African populations, in agreement with the Out-of-Africa theory of human evolution (Wainscoat et al. 1986; Chen et al. 1990; Long et al. 1990; Fullerton et al. 1994; Harding et al. 1997). Several mutations associated with hemoglobinopathies have been documented in the β-globin gene cluster (Orkin et al. 1983; Antonarakis et al. 1985). The βS (sickle cell) mutation, which results from a single-nucleotide change leading to an amino acid change (Val→Glu) at the sixth codon of the β-globin gene, is very common in countries where Plasmodium falciparum–mediated malaria is endemic, despite the strongly deleterious effects of the mutation in homozygotes (Nagel and Fleming 1992). This observation strongly suggests that heterozygous carriers are protected against P. falciparum malaria (Haldane 1949; Cavalli-Sforza and Bodmer 1971, p. 148), although the exact molecular mechanisms responsible for this protection remain unclear (e.g., see Ringelhann et al. 1976; Pasvol 1980; Flint et al. 1998; Le Hesran et al. 1999).
Several studies have shown that the βS mutation does occur on very different chromosomal backgrounds (Antonarakis et al. 1984; Chebloune et al. 1988; Labie et al. 1989; Trabuchet et al. 1991; Lapoumeroulie et al. 1992). These haplotypes have been useful for tracing the spread of migrants who carry the sickle cell mutation to different regions (e.g., see Labie et al. 1989; Rund et al. 1990; Lavinha et al. 1992; Muniz et al. 1995; Daar et al. 2000). To date, the existence of at least five different geographic centers of origin has been postulated on the basis of the predominance of major haplotypes associated with the βS mutation. Four of the centers (associated with haplotypes Bantu, Senegal, Benin, and Cameroon) have been found in sub-Saharan Africa (Pagnier et al. 1984; Nagel and Labie 1985; Lapoumeroulie et al. 1992), whereas the remaining one has been found in India and Saudi Arabia (Lie-Injo et al. 1987; Labie et al. 1989). Multiple and independent origins of the βS mutation throughout the world have been proposed (Pagnier et al. 1984; Nagel and Fleming 1992), but this inference fails to account for the absence of βS from malarial regions in Southeast Asia and Oceania (Flint et al. 1993). It is also possible that gene conversion has played a role in moving the βS mutation to different haplotype backgrounds in sub-Saharan Africa.
A specific question that, so far, has received little attention is the age of these sickle cell mutations. Some authors have argued that the mutations probably arose recently in response to the spread of agriculture throughout the world (Wiesenfeld 1967; Nagel and Fleming 1992). Although the time (<6,000 years ago) of the spread of P. falciparum (Rich et al. 1998; Ayala et al. 1999) seems well correlated with the advent of the Neolithic transition in different parts of the world, the dating of the sickle cell mutations has not been done. It has been suggested that these mutations could have already occurred in the Pleistocene era (Stine et al. 1992), but they may be much younger (Flint et al. 1993).
In the present article, we report results of a study of the genetic diversity of the β-globin gene cluster in an ethnically well-defined population, the Mandenka from eastern Senegal, which has been studied for a number of other polymorphisms (Blanc et al. 1990; Dard et al. 1992; Tiercy et al. 1992; Chen et al. 1995; Graven et al. 1995; Martinson et al. 1995; Poloni et al. 1995, 1997; Sanchez-Mazas et al. 2000). The absence of recent admixture and amalgamation in this population allows us to apply population-genetics methods to investigate the origin of the sickle cell mutation (Flint et al. 1993) and to estimate its age.
Populations and Methods
Sampled Population
The Niokholo Mandenka population includes 3,000 individuals distributed in a dozen villages located in the Niokholo Hills, 30 km northwest of Kedougou, in eastern Senegal. These Mandenkalu (plural form of “Mandenka”) belong to the large Mande linguistic group that includes several million speakers distributed from Niger to the Atlantic Ocean, mainly in Senegal, Mali, and Guinea. The Niokholo Mandenkalu constitute an endogamous group that has rare exchanges with surrounding ethnic groups (∼5% immigration per generation [Lalouel and Langaney 1976]). They are thought to have settled in eastern Senegal between the fourteenth and sixteenth century, during the decline of the Mali empire (de Montal 1985, pp. 56–64). Genetic studies have shown that the Niokholo Mandenka population exhibits much more genetic diversity than would be expected from its current census size of ∼3,000 individuals (Excoffier et al. 1996). Moreover, specific analyses of its mitochondrial genetic diversity have shown that the group underwent some demographic expansion during the Pleistocene era and that it does not present any sign of a recent bottleneck (Excoffier and Schneider 1999). It therefore seems that the genetic diversity of the Mandenkalu is representative of that of a larger population group from western Africa. This is because the original settlement of the Mandenkalu has probably not been accompanied by a bottleneck but was, rather, a corollary of the Mande expansion in West Africa that started in the 13th century (de Montal 1985, pp. 56–64). The current amount of gene flow with surrounding populations is thus certainly sufficient to counteract the effect of local genetic drift and to maintain connections with a larger, and probably subdivided, West African population.
RFLP Analyses
One hundred ninety-three individuals were tested for the status of five restriction sites detected by the endonucleases HincII and HindIII (sites 1–5, shown in fig. 1), as well as for the absence of the DdeI site at the beginning of the β-globin gene, which is indicative of the βS mutation (Chang and Kan 1981). The first five restriction sites that are in strong linkage disequilibrium (Antonarakis et al. 1982) have already been studied in several populations worldwide (e.g., see Hill and Wainscoat 1986; Wainscoat et al. 1986; Chen et al. 1990; Long et al. 1990). They will be referred to as the 5′ RFLP cluster.
Figure 1.
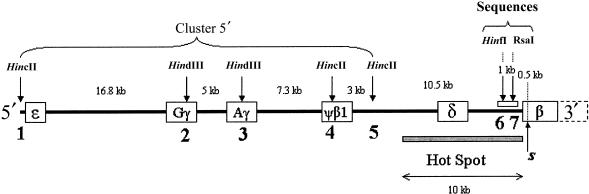
Map of the human β-globin gene cluster on chromosome 11. The location of the five polymorphic RFLP sites that define the 5′ RFLP cluster haplotypes are shown by arrows and numbers 1–5. The sequenced region between positions −1069 and −391 is indicated as a white bar.
DNA Sequence Analyses
Ninety-four individual chromosomes have been sequenced between positions −1079 and −390 upstream the Cap site of the β-globin gene (GenBank coordinates: 61 058–61 747). This region is included in the recombination hot spot (Chakravarti et al. 1984) and contains a polymorphic repeated sequence, (AT)x Ty, that has been shown to be in strong linkage disequilibrium with different βS mutations (Chebloune et al. 1988; Trabuchet et al. 1991). Direct nucleotide sequencing of PCR-amplified DNA fragments was usually not possible, because both chromosomes of a diploid organism are amplified during PCR and because most subjects were heterozygotes for two alleles of different lengths because of the polymorphism of the (AT)x Ty sequence. We therefore used the amplification refractory mutation system (ARMS), as described by Newton et al. (1989), to amplify separately each of the two chromosomes from a diploid subject. In a first step, we looked for the status of two polymorphic restriction sites, HinfI and RsaI, at positions −989 and −551, respectively (numbered 6 and 7 in fig. 1). An 828-bp fragment between positions −1228 and −401 bp was amplified in 112 unrelated individuals. This fragment was digested with restriction enzymes HinfI and RsaI, producing four different haplotypes. Their frequencies are listed in table 1. This preliminary study allowed us to find heterozygous subjects whose chromosomes can be individually amplified with the ARMS protocol.
Table 1.
HinfI-RsaI βS/βA Haplotype Frequencies in a Sample of 112 Individuals
|
Restriction Sitea |
|||||
| Haplotype | HinfI (−989) | RsaI (−551) | DdeI (βS) (+7) | Haplotype Frequencies | No. of Haplotypes Sequenced |
| 1 | − | − | − | 34 | 13 |
| 2 | + | − | + | 26 | 22 |
| 3 | + | − | − | 113 | 33 |
| 4 | − | + | − | 14 | 12 |
| 5 | + | + | − | 37 |
14 |
| Total | 224 | 94 | |||
A plus sign (+) indicates presence; a minus sign (−) indicates absence.
Specific ARMS primers were designed to amplify uniquely the HinfI−, HinfI+, DdeI− (βS), and DdeI+ (βA) chromosomes. The nucleotide sequences of these primers are HinfI− (5′-TAAAGAGAAATAGGAACTTGACTG-3′), HinfI+ (5′-TAAAGAGAAATAGGAACTTGACTC-3′), DdeI− (5′-CAGTAACGGCAGACTTCTACA-3′), and DdeI+ (5′-CAGTAACGGCAGACTTCTACT-3′). They were used in combination with appropriate reverse primers to amplify genomic DNA. PCR and nucleotide sequencing were performed as described by Perrin et al. (1998). Twenty-two individuals who were heterozygous for βS and 25 who were homozygous for βA had both chromosomes sequenced individually.
Statistical Analyses
Bootstrap sampling of DNA sequences
Because of the pattern of genotype frequencies in the sample and the constraints of the ARMS technique, it was not possible to get a fully representative sample of β-globin locus sequences. Also, because we were particularly interested in characterizing the pattern of diversity associated with the βS chromosomes, we allocated more effort to sequencing the chromosomes that bear this mutation, an approach that led to the unbalanced composition of the sequence sample reported in table 1. A bootstrap approach therefore was used to remove the bias in the composition of our sequence sample. Given the restriction haplotype frequencies of the 224 chromosomes shown in table 1, a random sample of n sequences was obtained in three steps. (1) We drew a random number uniformly distributed between 1 and 224. (2) We identified the restriction haplotype associated with this number (any random number between 1 and 34 would designate haplotype 1, and any number between 35 and 61 would designate haplotype 2, etc.), and we randomly chose one sequence among those bearing this haplotype. (3) We repeated steps 1 and 2 n times, to obtain a bootstrap sample of n sequences. Steps 1–3 were repeated many times to obtain random samples from which we obtained the distribution of several statistics that depended on haplotype-sample composition (e.g., nucleotide diversity and FST).
Sickle cell–mutation frequency
We have estimated the frequency of the βS mutation in the Mandenka by taking into account the unobserved number of lethal βSβS individuals (x), as well as the unobserved βAβA who died before adulthood (y), under the assumption that the increased fitness of βAβS individuals is due to increased viability only. Because 45 βS chromosomes were observed among 193 individuals, we needed to solve the following system of equations:  ,
,  and (assuming that we have reached equilibrium in the balancing selection model) pS=(1-wAA)/(2-wAA) to obtain pS=1-pA=0.117 and wAA=0.868. Actually, the frequency of the sickle cell mutation can be obtained much more easily by recognizing that the allele frequencies are stable over generations at selection-drift equilibrium. If we assume viability selection only, the frequencies are the same at birth as in adulthood, even though the genotypic configuration of the population does change at the same time. Therefore, a simple gene-counting procedure gives pS=45/(2×193)=0.117.
Haplotype frequencies
The maximum-likelihood (ML) frequencies of the 5′ RFLP cluster haplotypes of the five restriction sites were estimated using an expectation-maximization (EM) algorithm (Excoffier and Slatkin 1995), as implemented in Arlequin software (Schneider et al. 2000).
Gametic disequilibrium
We have performed an exact test of Hardy-Weinberg equilibrium (HWE) separately for each locus, using a modified version of the Markov-chain random-walk algorithm (Guo and Thompson 1992), as described by Schneider et al. (2000, pp. 87–88). A second analysis of potential departure from Hardy-Weinberg proportions due to inbreeding was performed using the procedure described by Ayres and Balding (1998). This procedure is based on a Bayesian Markov-chain Monte Carlo (MCMC) procedure implemented in the program hwmetc, available from Karen Ayres' Web site. We obtain the posterior distribution of the inbreeding coefficient f, computed over all loci (assumed to be independent), from which we can compute its mean and any confidence interval (CI). The f coefficient thus measures the excess (if positive) or deficit (if negative) of heterozygotes in the sample. The exact test is more sensitive to disequilibrium due to selection, whereas the Bayesian MCMC procedure is more sensitive to disequilibrium due to inbreeding. Linkage-disequilibrium likelihood-ratio tests between pairs of loci whose gametic phase is unknown (Slatkin and Excoffier 1996) were also performed between all restriction sites, as implemented in Arlequin 2.0 (Schneider et al. 2000).
Genetic structure
Population genetic structure was assessed by an analysis of molecular variance (Excoffier et al. 1992) on 72 Mandenka βA sequence data compared with other βA sequences from six other populations described elsewhere (Harding et al. 1997): 24 chromosomes from Papua New Guinea, 60 from Vanuatu, 40 from Sumatra (Indonesia), 28 from Gambia, 46 from the United Kingdom, and 48 from American Indians in the United States. Sequence between nt −780 and −490 was used for this analysis.
βS Age estimation
In the spirit of former forward simulations (e.g., see Kaplan et al. 1995), Monte Carlo simulations of the spread of a newly selected mutant in a diploid population were performed to estimate the age of the βS mutation in the Mandenka population. For comparison with our simulation results, we also used analytic methods that have been developed recently to estimate the age of an allele (Slatkin and Rannala 1997; Rannala and Slatkin 1998; see below). The problem with these analytic methods is that they are based on assumptions that do not hold for the present case.
Monte Carlo simulations were performed as follows: We simulated a two-locus system with arbitrary recombination (between a selected and a neutral locus) in a population that was demographically stationary or had recently undergone logistic growth. At generation 0, a new mutation (S) occurs at the selected locus, and it is associated with a given allele (X) at the neutral locus. The population frequency of X is a parameter that will be jointly estimated with the age of the mutation. If we assume that the estimated frequency of βS (11.7%) is that of the balancing selection system at equilibrium in the Mandenka population, the selective advantage of the heterozygotes βAβS over βAβ A is found to be 15.2%. We therefore used the following fitness values for the three genotypes at the selected locus: wSS=0, wAS=1.152, and wAA=1. Note that the selective advantage of 15.2% for heterozygotes is very similar to the value of 15% found by Cavalli-Sforza and Bodmer (1971, p. 148) and the value of 17.7% found by Livingstone (1989) in regions where malaria is also highly prevalent (Benin and Congo).
A new generation of N(t) diploid individuals is formed by drawing parents at random from the former generation. N(t) is equal to N(0) for a stationary population or is equal to N(t)=N(t-1)(1+r{1-[N(t-1)]/K}) for a logistic growth of the population, where r is the growth factor and K is the carrying capacity of the population. The probability of drawing a parent of a specific genotype is directly proportional to its fitness. A two-locus gamete is then chosen from each parent by simulating meiosis, in which mutation and recombination can occur. The combination of two random gametes gives the genotype of an offspring. We assume that mutation only occurs at the neutral locus, and that a new mutation from an allele other than X (i.e.,  ) cannot lead to X, the allele initially associated with the selected mutant S (we basically disallow reverse mutations). The frequency of the S allele is recorded, as well as that of the different gametes
  . At each generation, we check whether the population frequencies of X and S are compatible with those observed in the Mandenka sample. We define “compatible” as observations that the population frequencies lie within an interval centered on the sample estimates plus or minus two standard errors. This interval roughly corresponds to a 95% CI around the observed sample frequency. If the population frequencies are judged compatible with sampled frequency, we randomly sample a given number of S chromosomes, and we check whether the frequency of the SX gamete is equal to that of the observed sample. If that is the case, we declare that the current generation is compatible with the observed data. We let the process continue for 1,000 generations. Two thousand simulations are performed for different initial frequencies of the X allele. The demographic scenarios we have implemented consider the present-day Mandenka population (1) as a stationary population with effective size Ne=1,000, which is about one-third of its current census size (N≈3,000) (Hill 1972); (2) as a stationary population with effective size Ne=10,000, as estimated from mtDNA data (Graven et al. 1995); or (3) as a population that has undergone a period of logistic growth, with present-day carrying capacity of K=10,000 and with different growth rates and initial population sizes.
The simulation result is an approximation of the probability distribution of the observed data, conditional on the present frequencies of the S allele and SX gamete, which is a conditional likelihood. Joint ML estimates (Lmax) of the initial X frequency and the age of the βS mutation are obtained for a given demographic history of the population. A CI for the age of the βS mutation is then obtained by assuming that the quantity 2 × log (Lmax/L) follows a χ2 distribution with 2 df, implying that the limiting values of that 95% CI should have a log-likelihood 3 units less than the maximum (e.g., see Kalbfleisch 1985, p. 121).
The age of the sickle cell mutation has also been inferred using two analytic methods developed recently. One analytic method (using BDMC21 software) proposed by Slatkin and Rannala (1997) is based on intra-allelic variability. It assumes that a unique mutation event occurred in the past to define an allelic class. The present allele (mutation) frequency is an indicator of the age of that mutation, which is estimated by a Monte Carlo integration over all possible total coalescence times, conditional on the observed variability (number of polymorphic sites) associated with the mutation. The estimation procedure requires knowledge of the mutation rate, the size of the population, and the growth rate (assumed to be exponential) of the mutant allelic class, which can be a result of population demography as well as selection.
The second analytic estimation method proposed by Rannala and Slatkin (1998) is based on the extent of linkage disequilibrium between a mutation and a linked biallelic marker. The method—DMLE (disequilibrium mapping using maximum-likelihood estimation)—involves the basic assumption that linkage disequilibrium between the two loci decreases exponentially with time due to recombination. This method can be used to estimate the recombination rate if the age of the mutation is known, but we use it here to estimate the age of the mutation if the recombination rate c is known. Basically, the method compares the frequency of the allele at the linked locus that is associated with the βS mutation to its global frequency in the sample, regardless of its association to βS. The BDMC and DMLE methods both assume that the βS mutation is rare in the Mandenka population (although it is estimated to be 11.7% at birth) and that the exponential increase in frequency of the mutant class (ξ) is due to the combined effect of intrinsic population growth (r) and to the selective advantage of heterozygous individuals (σ), such that ξ=r+σ. In the case of the sickle cell mutation, the frequency increase due to balancing selection does not really follow an exponential growth but rather a logistic growth, and it is limited by the equilibrium frequency of the mutant. However, the initial phase of the balancing selection curve is approximately exponential, and we approximated the growth factor σ due to selection, by fitting an exponential curve to this initial phase of the logistic growth. When, as before, a heterozygote advantage of 15.2% is used over βAβA homozygotes, this translates into a mutation growth rate of σ=0.14.
Results
RFLP Diversity
The ML haplotype frequencies of the 5′ cluster are shown in table 2 for 148 βAβA homozygous individuals and for the entire sample (148 βAβA and 45 βAβS individuals). Ten different 5′ RFLP haplotypes are found in the Mandenka sample, and five of these are frequent: haplotypes 1 (31.3%), 11 (26.5%), 13 (12.8%), 9 (11%), and 16 (8.9%). The other five haplotypes are present at frequencies <5%. When the βS mutation locus is considered as an additional locus whose gametic phase must be determined statistically, all the βS chromosomes are found to be associated with haplotype 11 (the Senegal haplotype; Pagnier et al. 1984), using the EM algorithm estimation procedure.
Table 2.
β-Globin Gene Cluster 5′ Haplotypes Frequency in the Mandenka Population
|
Restriction Sitea(5′→3′) |
Frequency(%) |
||||||
| Haplotype | 1 HincII | 2 HindIII | 3 HindIII | 4 HincII | 5 HincII | βA and βS (n = 386) | βA (n = 296) |
| 1 | − | − | − | − | + | 31.3 | 35.6 |
| 3 | − | − | − | + | + | 1.1 | 1.5 |
| 8 | − | + | − | − | − | .9 | 1.1 |
| 9 | − | + | − | − | + | 11 | 10.7 |
| 10 | − | + | − | + | − | 4.7 | 5.1 |
| 11 | − | + | − | + | + | 26.5 | 17.2 |
| 13 | − | + | + | − | + | 12.8 | 15.5 |
| 15 | − | + | + | + | + | .1 | .1 |
| 16 | + | − | − | − | − | 8.9 | 9.7 |
| 17 | + | − | − | − | + | 2.7 | 3.5 |
A plus sign (+) indicates presence; a minus sign (−) indicates absence.
Exact tests of HWE were performed on each of the five RFLP markers separately, using 1 million Markov-chain steps. When the total sample of 193 individuals is considered, no restriction site shows significant departure at the 1% level. Only the first HincII sites show statistically significant values (P<.029). The same pattern is observed when only the 148 βAβA homozygous individuals are considered, a result that shows that balancing selection in the globin gene does not disturb HWE pattern in the 5′ cluster region. Using allelic information at the five RFLP sites, we separately estimated he posterior distribution of the inbreeding coefficient for the 148 βAβA individuals and for the total sample. The f coefficient is found to be significantly different from zero for the subsample of βAβA individuals ( ; 95% CI = 0.01–0.14; Pr(f≤0)=0.034) but not for the total sample (
 ; 95% CI −0.005 to −0.11). Strong and significant linkage disequilibrium was found between all pairs of restriction sites (results not shown) by the likelihood-ratio tests (P<.01), except between the last two HincII sites (between sites 4 and 5, P=.64). Note also that the HinfI site is found in linkage equilibrium with four restriction sites (sites 1–4) of the 5′ cluster in the sample of 112 individuals, whereas the RsaI site is found in linkage equilibrium with three of five restriction sites of the 5′ cluster. This linkage-equilibrium pattern is certainly a result of the fact that both the HinfI and RsaI sites are located within the recombination hot spot (fig. 1). Note also that the βS mutation is found in significant linkage disequilibrium (P<.01) with three of five restriction sites (sites 2, 3, and 4).
DNA Sequence Diversity
The polymorphic region upstream of the β-globin gene has been sequenced between the positions −1079 and −390 for 94 chromosomes. The polymorphic nucleotides and their frequencies are listed in table 3. Nine substitutions have been observed at positions −1069, −989, −780, −710, −703, −551, −543, −521, and −491, consisting of four transversions and five transitions. The sites −989 and −551 correspond to the polymorphisms recognized by the restriction enzymes HinfI and RsaI, respectively, whose global sample frequencies are reported in table 1. A purine-pyrimidine composite microsatellite, which is also referred to as “(RY)n sequence repeat” by Fullerton et al. (2000a), is located between positions −578 and −521 and shows a high degree of polymorphism. This polymorphism can be divided into two parts: a 5′ portion, mainly consisting in AT repeats interrupted by GT or AC, is usually found to be constant, except at position −568 (where we occasionally find an additional AT insertion); and a 3′ portion (where we observe an important variation in the number of AT and T tandem repeats), which is usually designated as the “ATXTY” structure (Semenza et al. 1984; Chebloune et al. 1988; Trabuchet et al. 1991). Three of the nucleotide substitutions mentioned above (−551, −543, and −521) are found within this composite microsatellite region.
Table 3.
Sequence Variation in the Polymorphic Region Upstream of the β-Globin Gene
|
Polymorphic Site |
||||||||||||||
| ObservedFrequencya | SampleEstimated Frequency | HinfI-RsaIHaplotype | HbStatus | −1069b | −989 | −780 | −710 | −703 | −551 | −543 | −521 | −491 | −568 | (AT)x Tyc |
| 1 | .012 | 1 | A | A | G | A | T | C | T | C | C | A | 2 | 8–6 |
| 1 | .012 | 1 | A | * | G | A | T | T | T | C | C | A | 2 | 8–6 |
| 4 | .047 | 1 | A | G | G | A | T | T | T | C | C | A | 2 | 8–5 |
| 4 | .047 | 1 | A | * | G | A | T | T | T | T | C | C | 2 | 8–4 |
| 1 | .012 | 1 | A | * | G | A | T | C | T | C | C | C | 2 | 7–7 |
| 1 | .012 | 1 | A | G | G | A | T | T | T | C | C | A | 2 | 7–7 |
| 1 | .012 | 1 | A | G | G | A | T | C | T | T | C | A | 2 | 7–6 |
| 22 | .116 | 2 | S | G | C | A | G | T | T | C | T | A | 2 | 8–4 |
| 4 | .061 | 3 | A | * | C | A | T | T | T | C | C | A | 2 | 9–4 |
| 2 | .031 | 3 | A | G | C | A | T | C | T | C | C | A | 2 | 8–5 |
| 3 | .046 | 3 | A | * | C | A | T | T | T | C | C | A | 2 | 8–5 |
| 1 | .015 | 3 | A | * | C | A | G | T | T | C | T | A | 2 | 8–4 |
| 3 | .046 | 3 | A | * | C | T | T | T | T | T | C | C | 2 | 8–4 |
| 1 | .015 | 3 | A | * | C | T | T | T | T | C | C | C | 2 | 8–4 |
| 2 | .031 | 3 | A | * | C | A | G | T | T | C | C | A | 2 | 7–6 |
| 1 | .015 | 3 | A | A | C | A | G | T | T | C | C | A | 2 | 7–7 |
| 2 | .031 | 3 | A | * | C | A | T | C | T | C | C | A | 2 | 7–7 |
| 1 | .015 | 3 | A | A | C | A | T | C | T | C | C | C | 2 | 7–7 |
| 2 | .031 | 3 | A | * | C | A | T | C | T | T | C | C | 2 | 7–7 |
| 1 | .015 | 3 | A | * | C | A | T | T | T | C | C | A | 2 | 7–7 |
| 4 | .061 | 3 | A | * | C | A | T | C | T | T | C | C | 2 | 7–6 |
| 1 | .015 | 3 | A | * | C | A | G | T | T | C | T | A | 2 | 7–6 |
| 3 | .046 | 3 | A | * | C | A | T | T | T | T | C | C | 3 | 6–8 |
| 1 | .015 | 3 | A | * | C | A | T | T | T | T | C | C | 2 | 6–8 |
| 1 | .015 | 3 | A | * | C | A | T | C | T | T | C | C | 2 | 5–9 |
| 1 | .005 | 4 | A | * | G | A | T | C | C | C | C | A | 2 | 9–5 |
| 1 | .005 | 4 | A | * | G | A | T | C | C | C | C | A | 2 | 8–5 |
| 7 | .036 | 4 | A | G | G | A | T | T | C | C | C | A | 2 | 7–7 |
| 3 | .016 | 4 | A | * | G | A | T | T | C | C | C | A | 2 | 6–9 |
| 1 | .012 | 5 | A | G | C | A | T | C | C | C | C | A | 2 | 8–5 |
| 3 | .035 | 5 | A | G | C | A | T | T | C | C | C | A | 2 | 7–7 |
| 6 | .071 | 5 | A | * | C | A | T | C | C | C | C | A | 2 | 7–7 |
| 1 | .012 | 5 | A | * | C | A | G | T | C | C | T | A | 2 | 7–6 |
| 2 | .024 | 5 | A | A | C | A | T | T | C | C | C | A | 2 | 6–9 |
| 1 | .012 | 5 | A | G | C | A | T | C | C | C | C | A | 2 | 6–7 |
Total observed frequency = 94.
Asterisk indicates that the gametic phase has not been determined for the chromosomes at this position. Therefore, the nucleotide at position −1069 can be either A or G.
Microsatellite.
A total of 35 different haplotypes are found among the 94 sequences. The 22 βS chromosomes have a sequence pattern that corresponds exactly to the Senegal sequence haplotype (Trabuchet et al. 1991). This result confirms the homogeneity of the βS chromosomes detected by the RFLP study. In clear contrast, the 72 βA chromosomes show considerable diversity, with 34 different alleles. Note that the βS-associated sequence is also found on a single βA chromosome. A total of 10 different ATXTY structures are found in the Mandenka population.
Estimates of sample diversity were obtained by the procedure described in the section on DNA bootstrap sampling. Mandenka’s nucleotide diversity ( ) for a sequence of 270 bp (between positions −780 and −490), taking into account only substitutions on βA chromosomes, is found to be 0.0078 (bootstrap 95% CI 0.0070–0.0090), which is comparable to that found in the ethnically heterogeneous sample from a nearby region in the Gambia (
 = 0.0096) (Harding et al. 1997). An analysis of molecular variance in the Mandenkalu and six other populations (American Indians, Vanuatu, Papua New Guinea, Sumatra, the Gambia, and the United Kingdom) on the basis of the same βA sequence data gave an FST estimate of 0.137 (bootstrap 95% CI 0.115–0.175), which is in the same range (10%–15%) as that of other nuclear markers, on a worldwide scale (Barbujani et al. 1997; Flint et al. 1999).
Age of the βS Mutation
Monte Carlo simulations
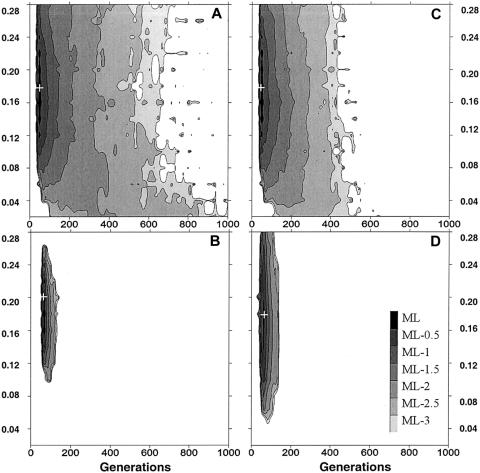
Plots of the likelihood of the age of the βS are shown in figures 2 and 3 for a few possible demographic histories of the Mandenka population. ML estimates and their approximate CIs are listed in table 4. ML estimates are consistently found at ∼45–70 generations for a large range of demographic histories and when considering either the 5′ RFLP cluster or the DNA sequences as the linked neutral marker. The limits of the CIs are, however, much more sensitive to population demography than are the point estimates. Very wide CIs are found for either small stationary population sizes (N=1,000) or for populations that have undergone a recent but slow demographic expansion (0.1% per generation). CIs are found to be wider for simulated DNA sequence data than for the 5′ RFLP cluster. This is because the overall probability of a modification of the neutral allele originally associated with the βS mutation is smaller for DNA sequences than for RFLP haplotypes. The reduced CIs are thus mainly due to the presence of the recombination hot spot between the βS mutation and the 5′ RFLP cluster.
Figure 2.

Likelihood surface of the age of the βS mutation obtained by Monte Carlo simulation of the spread of a new mutation. Simulated data correspond to sequence data in which no diversity is found in 22 βS chromosomes. The mutation rate is 5 × 10⁻⁴ per generation, when calculated as an average for dinucleotide microsatellites (Goldstein et al. 1995) and taken for the whole sequence. The estimated recombination rate between the βS mutation and the sequence data is 8 × 10⁻⁵ per generation. A, Stationary population N = 1,000. B, Stationary population N = 10,000. C, Logistic growth, N0 = 1,000, K = 10,000, r = 0.001. D, Logistic growth, N0 = 1,000, K = 10,000, r = 0.02. Plus sign (+) indicates the ML estimator.
Figure 3.
Likelihood surface of the age of the βS mutation, obtained by Monte Carlo simulation of the spread of a new mutation. The neutral linked marker corresponds to the 5′ RFLP cluster data in which no diversity is found in 45 βS chromosomes. When the estimation given by Harding et al. (1997) is used, the estimated mutation rate is 1 × 10⁻⁶ per generation taken as average for 30 bp. The estimated recombination rate between the βS mutation and the 5′ RFLP cluster is 1.6 × 10⁻³ per generation (Chakravarti et al. 1984). A, Stationary population N = 1,000. B, Stationary population N = 10,000. C, Logistic growth, N0 = 1,000, K = 10,000, r = .001. D, Logistic growth, N0 = 1,000, K = 10,000, r = 0.02. Plus sign (+) indicates the ML estimator.
Table 4.
ML Estimates of the Age of the βS Mutation in the Mandenka Population
| Statistical Analysis andDemographic Model | Initial Frequencyof Neutral AlleleAssociated with βS | Age of βS(generations) | 95% CI |
| BDMC: | |||
| DNA sequences: | |||
| N= 10,000 | … | 10 | 0–1200 |
| N= 1,000,000 | … | 55 | 15–600 |
| DMLE: | |||
| 5′ Cluster RFLPs: | |||
| N = 10,000 | … | 0 | 0–140 |
| N= 1,000,000 | … | 0 | 0–100 |
| Simulations: | |||
| 5′ Cluster RFLPs: | |||
| Stationary population: | |||
| N= 1,000 | .18 | 55 | 25–735 |
| N= 5,000 | .18 | 60 | 35–205 |
| N= 10,000 | .20 | 60 | 40–145 |
| Logistic growth: | |||
| N0 = 1,000, K = 10,000: | |||
| r = .001 | .18 | 50 | 25–590 |
| r = .01 | .20 | 50 | 25–210 |
| r = .02 | .18 | 45 | 25–160 |
| N0 = 100, K= 10,000: | |||
| r = .001 | .22 | 20 | 5–725 |
| r = .01 | .14 | 30 | 5–400 |
| r = .02 | .18 | 30 | 5–250 |
| DNA sequences: | |||
| Stationary population: | |||
| N= 1,000 | .010 | 65 | 25–(>1,000) |
| N= 5,000 | .020 | 65 | 35–(>1,000) |
| N= 10,000 | .004 | 70 | 45–690 |
| Logistic growth: | |||
| N0 = 1,000, K = 10,000: | |||
| r = .001 | .006 | 60 | 25–(>1,000) |
| r = .01 | .004 | 60 | 25–660 |
| r = .02 | .010 | 60 | 25–585 |
| N0 = 100, K= 10,000: | |||
| r = .001 | .008 | 35 | 5–(>1,000) |
| r = .01 | .002 | 165 | 5–890 |
| r = .02 | .004 | 95 | 5–660 |
Because of the gene hitchhiking effect, the molecular diversity and the gene frequencies at a neutral locus should be affected by selection at a linked locus (Maynard Smith and Haigh 1974; Braverman et al. 1995; Fay and Wu 2000; Schierup et al. 2000a). For this reason, one may wonder whether it is appropriate to compare haplotype frequencies at a neutral locus in populations in which selection is acting with those in populations in which it is not. In the case of the β-globin gene, population comparisons have been done mainly among βA chromosomes (e.g., see Wainscoat et al. 1986; Chen et al. 1990; Long et al. 1990), to avoid this problem; however, there are some exceptions (e.g., see Harding et al. 1997). Our simulation results can be used to see whether the current frequencies of the βA haplotypes are comparable to those frequencies at the onset of the selection process. For RFLP haplotypes, we find (table 4) that the ML estimates of the initial frequency of haplotype 11 (currently linked to the βS mutation) are 0.14–0.20, with most simulation conditions giving an estimate of 0.18. This is very close to the present-day frequency of 0.172 among βA chromosomes (table 2). The increase in total frequency of haplotype 11 from 0.18 to 0.265 in the total population has thus been mainly done at the expense of other haplotypes, which should have current frequencies among the βA chromosomes quite different from those prevailing before the selection episode.
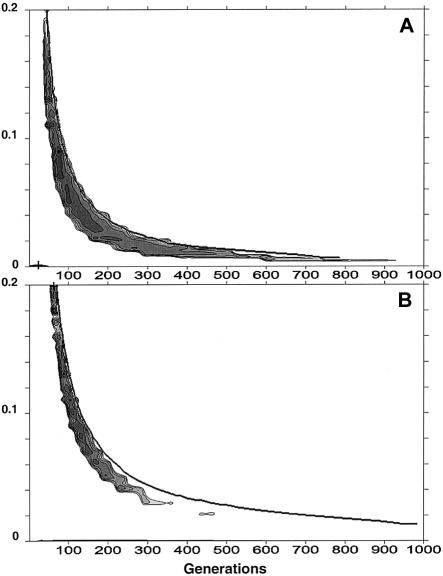
BDMC
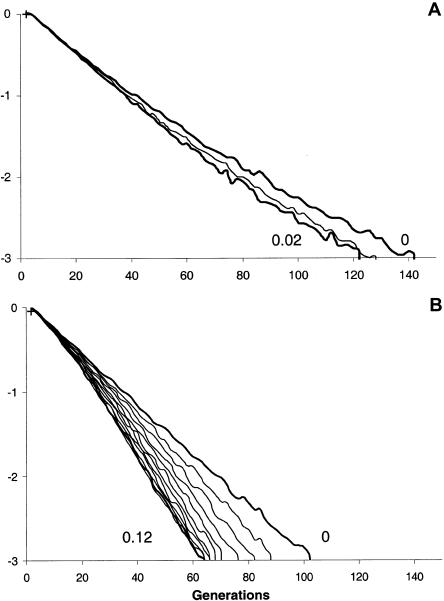
The likelihoods of the age of the βS mutation are reported in figure 4 for different growth rates (ξ) of βS chromosomes in a present-day population of 10,000 (fig. 4A) and 1 million (fig. 4B) individuals. For 1 million individuals, the estimated age of the mutation is <200 generations for ξ values >0.07, and the estimated age is <110 generations, with a growth rate >0.13. For an expanding population (ξ < 0.02, implying no selective advantage of βAβS heterozygotes), the age of the mutation estimated by the BDMC method appears unbounded, although the upper limit is 600 generations for a stationary population (ξ=0). For a growth rate of ξ=0.14, which corresponds to the initial exponential growth rate of the mutation resulting from selection only, we obtain a 95% CI of 65–100 generations for a present-day population size of 1 million individuals and of 35–70 generations for a present-day population of 10,000 individuals. The overall age estimates for 10,000 individuals are more recent than those for 1 million individuals.
Figure 4.
Plot of the likelihood obtained by the BDMC method for the age of the βS mutation for different total growth rates (ξ) of βS chromosomes in a present-day population of 10,000 individuals (A) and in a population of 1 million individuals (B). The assumed mutation rate is 5 × 10⁻⁴, and no diversity is observed among 22 chromosomes. The present frequency of the βS mutation is taken as 11.7%. The shaded regions delimit a parameter space for which the log likelihood is three units smaller than the ML, which corresponds approximately to a joint 95% CI for the growth rate and the age of the mutation. The plus sign indicates the ML estimator. The 95% CI for the age of the βS mutation (0–900 generations) does not correspond exactly to that reported in table 4 (0–1,200 generations), because we have plotted interpolated values, whereas the figures reported in table 4 are based on exact values.
DMLE
The likelihoods of the age of the βS mutation are shown in figure 5 for different values of the total growth rate. The ML values are zero for all ξ values 0–0.2. In figure 5, we have reported only the curves for ξ=0 and for the largest growth rate that maintains at least one βS chromosome in the population in the whole CI (for larger growth rates—and because DMLE relies on a time continuous approximation scaled by the population size—fractions of a single βS chromosome remain in the population). Under these conditions, the upper limits of the 95% CI are 140 generations for a population size of 10,000 with ξ=0 and are 100 generations for a population size of 1 million individuals with ξ=0.
Figure 5.
Likelihood of the age of the βS mutation, (estimated according to the DMLE method, under the assumption that 45 βS chromosomes show the same associated 5′ cluster RFLP haplotype despite a recombination rate of 1.6 × 10⁻³ per generation (Chakravarti et al. 1984). The present population is assumed to be either (A) 10,000 or (B) 1 million individuals. Likelihoods are plotted for total exponential growth rates (see text) ranging from 0% per generation (extreme right line) to the largest one that permits retention of at least one βS chromosome in the population in the whole CI (see DMLE subsection) (extreme left line) by increments of 1%. The DMLE method gives an ML value of one generation. An upper limit for the age of the βS mutation is found when the log-likelihood of that age is three units less than the maximum.
Discussion
A Single Chromosomal Background Is Associated with the βS Mutation
A striking result of the present study is the absence of diversity associated with the βS mutation, despite a very high level of diversity on βA chromosomes. The inferred association between the βS mutation and the Senegal 5′ RFLP haplotype (number 11 in table 2) has been obtained by a statistical (ML) reconstruction. One could postulate that this association may not be so strict in reality. The three other 5′ RFLP haplotypes that are associated with the βS mutation in other African populations are indeed found in the Mandenkalu associated with the βA allele. Two haplotypes have a high frequency: haplotypes 1 (Benin, 31.3%) and 13 (Cameroon, 12.8%). The remaining haplotype, 8 (Bantu) is less frequent (1.1%). The sequencing of 45 individual chromosomes for >60 kb would be necessary to directly check for this strict association. This was not feasible, because it is extremely difficult to obtain sequences of single chromosomes for >10 kb ( Nickerson et al. 1998; Fullerton et al. 2000b). However, ML estimates of haplotype frequencies are generally reliable in practice (Martinson et al. 1995; Fallin and Schork 2000; Tishkoff et al. 2000). We therefore note that the 5′ RFLP haplotype frequencies estimated for the βA chromosomes in the Mandenkalu are in close agreement with the frequencies found in a global African sample (Long et al. 1990).
The sequencing of individual chromosomes in the polymorphic repeated region upstream of the β-globin gene confirms a strict association between the βS mutation and the Senegal haplotype. The Senegal DNA sequence has already been shown to predominate among βS chromosomes in nearby Guinea without becoming monomorphic (31 of 40 sampled chromosomes; Sow et al. 1995), but in that case the analyzed sample was both geographically and ethnically much more heterogeneous than the present sample from the Niokholo Mandenkalu. The βS mutation previously had been found to be associated with several RFLP haplotypes in an urban sample from Dakar, with the predominance of the Senegal RFLP haplotype but also with significant frequencies of the Benin and Bantu haplotypes (Pagnier et al. 1984). The HbS gene associated with the Senegal haplotype is mainly restricted to West Africa, but it has been found in the Americas (e.g., see Muniz et al. 1995; Pante-De-Sousa et al. 1999), probably reflecting its spread by slave trade. Note that it has also been observed in Europe (e.g., see Lavinha et al. 1992) and once in Madagascar, probably because of recent immigration (Hewitt et al. 1996). In North Africa, the Benin type of HbS gene is predominant (e.g., see Frikha et al. 1998).
The monomorphism of the βS chromosomes in the Mandenka population is in clear contrast to the high degree of polymorphism observed among βA chromosomes, which are associated with 10 RFLP haplotypes and 34 DNA sequences. A similarly high degree of polymorphism had been previously found in the Mandenkalu for mtDNA (Chen et al. 1995; Graven et al. 1995) and several nuclear markers (Tiercy et al. 1992; Martinson et al. 1995; Poloni et al. 1995), suggesting that the Mandenka population is not an isolate and that its settlement 500–600 years ago has not been accompanied by a founder effect. Thus, despite a small census of ∼3,000 individuals, the Niokholo Mandenka’s molecular diversity seems representative of a much larger West African population (Excoffier et al. 1996). This is in keeping with its supposed recent arrival in eastern Senegal from Mali (de Montal 1985, pp. 56–64), where the origin of its diversity should be found. Even though some inbreeding could have occurred since its settlement, its estimated level remains small (f = 0.045) and nonsignificant. It thus appears that the homogeneity of βS chromosomes is not due to a recent founder event in the Mandenka followed by drift but rather reflects a recent origin.
A Recent Origin for the Senegal βS Mutation
Several methods and data sets have been used to estimate the age of the βS mutation, but all approaches suggest that it arose <100 generations ago, which (when a generation time of 30 years [Tremblay and Vezina 2000] is assumed) could be <3,000 years ago. Previous attempts to determine the age of a chromosomal segment with no associated diversity (Dorit et al. 1995) have been elaborated in a neutral context (Donnelly et al. 1996; Fu and Li 1996; Weiss and von Haeseler 1996) that does not apply here. Although our forward simulations are not as mathematically rigorous as the analytic approaches underlying the BDMC21 and DMLE programs (Slatkin and Rannala 1997; Rannala and Slatkin 1998), we give more credit to the results obtained by our forward simulations, because some assumptions of the analytic approaches do not apply to the Mandenka population and to the evolution of the β-globin gene cluster. Indeed, the βS chromosomes of the Mandenka population are not expanding at a steady exponential rate, and the mutation is not rare (as is assumed in both the BDMC and the DMLE approaches). Because the Niokholo Mandenka farming community is almost at demographic equilibrium, with ∼30% juvenile mortality rate (Pison et al. 1995, p. 128), the increase in βS chromosome counts probably has mainly resulted from the balancing selection process, which rather follows a logistic growth towards an equilibrium frequency. The BDMC approach seems especially sensitive to the exponential growth assumption, as the upper limit of the 95% CI for the age of the mutation is the time necessary to accumulate the present βS chromosome count from an initial single chromosome (see figs. 4A and 4B). The fact that the DMLE method provides ML estimates that are unrealistic (i.e., one generation), despite upper limits that appear reasonable, raises questions about the applicability of this method to a complete absence of variation (and therefore of recombination) on βS chromosomes. Methods that would take into account some prior information on the distribution of allele age would provide estimates other than one, even in the absence of recombination (Slatkin and Rannala 2000).
Adequacy of the Simulation Scheme
In our simulations, we therefore have tried to incorporate realistic assumptions about both the demography of the Mandenka population and the selective processes acting on the β-globin gene. We have preferred to model either stationary populations or populations that have undergone a logistic growth, rather than populations that grow exponentially for an indefinite period. This logistic growth may be justified by considering the Neolithization of West Africa, which is thought to have started in ∼2,500 b.c., after the desiccation of the Sahara (Shaw 1990). Because of computing limitations, it was not possible to explore the case of very large present-day population sizes, but our simulations show a clear trend that can be extrapolated to larger present-day population sizes. Although the majority of our simulation conditions give an ML age of the βS as ∼45–70 generations (1,350–2,100 years) for both RFLP and DNA sequence data, we note that if the mutation had originated in a very small population (N=100) that had then been slowly increasing in size, the absence of diversity associated with βS would not be very informative, because the CIs are extremely wide (5–1,000 generations) (table 4). Although the ML estimates are very consistent among different demographic scenarios, it is difficult to determine a meaningful overall CI, because its width varies extensively, depending on the assumed demography of the population. Given the great diversity found at neutral loci (Excoffier et al. 1996), as well as that associated with the βA chromosomes, it is likely that the Mandenka population has a relatively large effective population size, implying very small CIs for the age of βS (see figs. 2 and 3 and table 4). Under these conditions, lower and upper limits of the age of the βS mutation are ∼25 and 690 generations (700 and 20,700 years), respectively. It is, however, likely that the demographic history of the Mandenka population is more complex than the history represented by our simulations. Although our results suggest that estimates of the age of the βS mutation do not depend greatly on the size of the population, provided it is large enough, we did not consider the case of a selected mutation in a subdivided population.
Analytic results concerning the spread of a mutation, under balancing selection in a subdivided population, are still scarce (Kaplan et al. 1991; Schierup 1998), but they show that the amount of diversity that can be maintained depends on the migration rates between interconnected demes (Schierup 1998; Schierup et al. 2000a, 2000b). The level of diversity expected when migration rates between demes are low is not equivalent to that expected in a panmictic population, even after rescaling of the effective population size to take into account local population sizes and numbers of demes (Whitlock and Barton 1997). Also, in a subdivided population, the estimated age of a mutation relates to the time it was introduced by either mutation or migration. In demes of sufficient size, the time needed by a new mutation to reach the equilibrium frequency of the overdominant model is determined mainly by selection, so the minimum age obtained with our simulations should be quite insensitive to the effect of population subdivision. However, the maximum ages given by our simulations may be affected by subdivision, because neutral linked mutations or recombinations that occur elsewhere may take time to spread to the deme where the sampling of chromosomes has occurred. The sampled deme can thus be free of mutants or recombinants that have occurred in the total population. Therefore, compared with a highly subdivided population that has an identical effective size, our current simulations of a panmictic population would tend to underestimate the maximum age of the Senegal βS mutation.
Schierup and colleagues (2000a) have recently shown that, if gene flow is sufficiently high (in their case, the product of deme size N and the immigration rate m was 12.5), estimates of nucleotide diversity at a closely linked neutral locus were lowered by <10%, compared with nucleotide diversity expected in a panmictic population of identical effective size. When we assume that there are ∼1,000 reproducing Niokholo Mandenka adults and we take the estimated value of m as 5% per generation (Lalouel and Langaney 1976), we estimate Nm to be 50. The Niokholo Mandenka population thus appears to be part of a highly interconnected set of ethnic groups in a region encompassing eastern Senegal, southeastern Mali, and northwestern Guinea. Given this high number (50) of incoming migrants per generation, new mutants and recombinants from neighboring demes would become rapidly visible in samples from the Mandenka population, and we therefore have confidence in our estimates of the age of the βS mutation, which are based on the assumption of a panmictic population.
Geographic Origin of the βS Mutation
Because the inferred age of the βS mutation much predates the settlement of the Mandenka population in eastern Senegal (during the 14th century), the geographic origin of the Senegal βS mutation cannot be associated with the Niokholo Mandenka population. It may be found in the Mandenka because it was imported with the founders of this population when they settled in eastern Senegal. In that case, the Senegal mutation would have originated in the cradle of the Mandenka population, eastward in Mali. Alternatively, because of the high rate of gene flow between the Mandenka and surrounding populations, it is possible that the mutation was present in eastern Senegal for a long time before the settlement of the Mandenka. In both cases, migration is implicated in the spread of this mutation across West African populations, and the exact geographic origin of the Senegal βS mutation in West Africa cannot be located.
Our finding of a single haplotypic background for the βS mutation in the Niokholo Mandenka could be compatible with single or multiple origin(s) of the sickle cell mutation. In the case of a single mutational origin for βS and its spread to different backgrounds by recombination or gene conversion, we would not necessarily expect to see multiple sickle cell–associated haplotypes selected at high frequencies in a population if competing drift factors were strong enough to eliminate some βS haplotypes while at low frequency. The hypothesis of multiple independent origins raises the question of how several identical mutations could have occurred in a short period of time in Africa after the appearance of malaria, despite the low mutation rate of nuclear DNA. However, the presence of βS on multiple haplotypes, each at high demic frequencies, is easier to explain if these mutations had been present at low frequencies for a much longer time and then had spread from a few copies to present-day frequencies, under the pressure of recent strong malarial selection (50–100 generations under the present type of overdominant selection; results not shown). Because it is difficult to account for several identical βS mutations in a short period of time (either by a point-mutation process or by recombination and gene conversion), our estimate for the age of the Senegal βS mutation probably does not relate to the original mutational event but rather to the time since the onset of the malaria-mediated selection and the associated increase in frequency of the Senegal βS haplotype.
The present data provide an estimate for the time (1,350–2,100 years) since this origin that is fully compatible with current theories of the origin of the sickle cell mutation in response to the appearance of P. falciparum–mediated malaria (Haldane 1949). The recent (<6,000 years) spread of this Plasmodium species (Rich et al. 1998; Ayala et al. 1999) appears linked to that of agriculture in sub-Saharan Africa, an event that led to the higher population densities (Nagel and Fleming 1992; Coluzzi 1999) necessary for the efficient spread of malaria, and it provides information about a possible upper limit of the beginning of the spread of the Senegal βS haplotype in West Africa. In keeping with this interpretation and with our own results, a recent survey of the haplotypic diversity at the G6PD locus (Tishkoff et al. 2001) also suggests that two protective mutations against malaria had appeared at that locus within the last 10,000 years. The present results are also in agreement with studies reported elsewhere (Lapoumeroulie et al. 1992; Sow et al. 1995) that show βS haplotypes to be generally homogeneous in well-defined ethnic groups. Different results are found in other molecular-diversity studies that have focused on heterogeneous samples of βS homozygous patients, which showed a diversity of βS chromosomes (Pagnier et al. 1984). Although certainly representative of the usual panel of urban hospital patients, this heterogeneity probably reflects recent migrations and amalgamation processes that have led to an excess of rare mutations (Chakraborty et al. 1988), in comparison to those found in the original populations. Further genetic studies in other well-defined populations of western (and central) Africa are thus clearly necessary, because they would allow determination of the exact extent of the spread of the Senegal βS mutation in West Africa, and they would help to precisely identify the mutation's geographical origin. Such studies would also be useful when checking for the homogeneity of the background of the βS mutation in other populations and to confirm the recent increase in frequency of the βS mutation, irrespective of its haplotypic background. Finally, such studies would lead to exact estimates of levels of subdivision and migration rates between West African populations, so as to better understand the origin and propagation of specific mutations that either cause or protect against genetic diseases. The present distributions and frequencies of different βS haplotypes are certainly the result of an interaction among drift, selection, and the settlement history of sub-Saharan Africa (Ramsay and Jenkins 1987; Flint et al. 1993). Because different haplotypes appear linked to various degrees of severity of sickle cell disease and to advantages for heterozygotes (e.g., see Nagel et al. 1985; Powars et al. 1989, 1994; Steinberg et al. 1995; Thomas et al. 1998), the evolutionary mechanisms responsible for the heterozygous advantage (e.g., see Ringelhann et al. 1976; Pasvol 1980; Nagel and Fleming 1992) and the increase of the sickle cell mutation require further studies of well-defined ethnic groups in sub-Saharan Africa.
Acknowledgments
We thank Bruce Rannala for discussing different aspects of the behavior of the BDMC and DMLE approaches and for allowing us to use his computer programs. We are also grateful to two anonymous reviewers for their helpful comments on an earlier version of the article. We thank the Niokholo Mandenkalu from Bantata, Banyon, Barraboy, Batranké, Tikankali, and Tenkoto, as well as the Senegalese authorities for their permission to conduct this research program. We are grateful to Sékhou Camara for his continuous assistance in the field. We offer thanks to Drs. Alain Epelboin, Gilles Pison, and Alicia Sanchez-Mazas for their help in collecting blood samples. This work was partly supported by Swiss National Science Foundation grant 31-56755.99 (to L.E.).
Electronic-Database Information
The URLs for data in this article are as follows:
- Bruce Rannala's Research Group, http://www.rannala.org/ (for DMLE and BDMC21)
- Statistics, http://www.reading.ac.uk/Statistics/genetics/software.html/ (for hwmetc software)
References
- Antonarakis SE, Boehm CD, Giardina PJ, Kazazian HH Jr (1982) Nonrandom association of polymorphic restriction sites in the β-globin gene cluster. Proc Natl Acad Sci USA 79:137–141 [DOI] [PMC free article] [PubMed] [Google Scholar]
- Antonarakis SE, Boehm CD, Serjeant GR, Theisen CE, Dover GJ, Kazazian HH Jr (1984) Origin of the beta S-globin gene in blacks: the contribution of recurrent mutation or gene conversion or both. Proc Natl Acad Sci USA 81:853–856 [DOI] [PMC free article] [PubMed] [Google Scholar]
- Antonarakis SE, Kazazian HH Jr, Orkin SH (1985) DNA polymorphism and molecular pathology of the human globin gene clusters. Hum Genet 69:1–14 [DOI] [PubMed] [Google Scholar]
- Ayala FJ, Escalante AA, Rich SM (1999) Evolution of Plasmodium and the recent origin of the world populations of Plasmodium falciparum. Parassitologia 41:55–68 [PubMed] [Google Scholar]
- Ayres KL, Balding DJ (1998) Measuring departures from Hardy-Weinberg: a Markov chain Monte Carlo method for estimating the inbreeding coefficient. Heredity 80:769–777 [DOI] [PubMed] [Google Scholar]
- Barbujani G, Magagni A, Minch E, Cavalli-Sforza L (1997) An apportionment of human DNA diversity. Proc Natl Acad Sci USA 94:4516–4519 [DOI] [PMC free article] [PubMed] [Google Scholar]
- Blanc M, Sanchez-Mazas A, van Blyenburgh NH, Sevin A, Pison G, Langaney A (1990) Interethnic genetic differentiation: GM polymorphism in eastern Senegal. Am J Hum Genet 46:383–392 [PMC free article] [PubMed] [Google Scholar]
- Braverman JM, Hudson RR, Kaplan NL, Langley CH, Stephan W (1995) The hitchhiking effect on the site frequency spectrum of DNA polymorphisms. Genetics 140:783–796 [DOI] [PMC free article] [PubMed] [Google Scholar]
- Cavalli-Sforza LL, Bodmer WF (1971) The genetics of human populations. WH Freeman, San Francisco [Google Scholar]
- Chakraborty R, Smouse PE, Neel JV (1988) Population amalgamation and genetic variation: observations on artificially agglomerated tribal populations of Central and South America. Am J Hum Genet 43:709–725 [PMC free article] [PubMed] [Google Scholar]
- Chakravarti A, Buetow KH, Antonarakis SE, Waber PG, Boehm CD, Kazazian HH (1984) Nonuniform recombination within the human β-globin gene cluster. Am J Hum Genet 36:1239–1258 [PMC free article] [PubMed] [Google Scholar]
- Chang JC, Kan YW (1981) Antenatal diagnosis of sickle cell anaemia by direct analysis of the sickle mutation. Lancet 2:1127–1129 [DOI] [PubMed] [Google Scholar]
- Chebloune Y, Pagnier J, Trabuchet G, Faure C, Verdier G, Labie D, Nigon V (1988) Structural analysis of the 5′ flanking region of the β-globin gene in African sickle cell anemia patients: further evidence for three origins of the sickle cell mutation in Africa. Proc Natl Acad Sci USA 85:4431–4435 [DOI] [PMC free article] [PubMed] [Google Scholar]
- Chen LZ, Easteal S, Board PG, Kirk RL (1990) Evolution of beta-globin haplotypes in human populations. Mol Biol Evol 7:423–437 [DOI] [PubMed] [Google Scholar]
- Chen Y-S, Torroni A, Excoffier L, Santachiara-Benerecetti AS, Wallace DC (1995) Analysis of mtDNA variation in African populations reveals the most ancient of all human continent-specific haplogroup. Am J Hum Genet 57:133–149 [PMC free article] [PubMed] [Google Scholar]
- Coluzzi M (1999) The clay feet of the malaria giant and its African roots: hypotheses and inferences about origin, spread and control of Plasmodium falciparum. Parassitologia 41:277–283 [PubMed] [Google Scholar]
- Daar S, Hussain HM, Gravell D, Nagel RL, Krishnamoorthy R (2000) Genetic epidemiology of HbS in Oman: multicentric origin for the βS gene. Am J Hematol 64:39–46 [DOI] [PubMed] [Google Scholar]
- Dard P, Schreiber Y, Excoffier L, Sanchez-Mazas A, Shi-Isaac X, Epelbouin A, Langaney A, Jeannet M (1992) Polymorphisme des loci de classe I: HLA-A, -B, et -C, dans la population Mandenka du Sénégal Oriental. C R Acad Sci Paris 314:573–578 [PubMed] [Google Scholar]
- de Montal G (1985) Les Malinkés: les Habitants du Département de Kédougou Sénégal. Centre de Recherches Anthropologiques du Musée de l'Homme, Paris [Google Scholar]
- Donnelly P, Tavare S, Balding DJ, Griffiths RC (1996) Estimating the age of the common ancestor of men from the ZFY intron. Science 272:1357–1359 [DOI] [PubMed] [Google Scholar]
- Dorit RL, Akashi H, Gilbert W (1995) Absence of polymorphism at the ZFY locus on the human Y chromosome. Science 268:1183–1185 [DOI] [PubMed] [Google Scholar]
- Excoffier L, Poloni ES, Santachiara-Benerecetti AS, Semino O, Langaney A (1996) The molecular diversity of the Niokholo Mandenkalu from eastern Senegal: an insight into West African genetic history. In: Boyce AJ, Mascie-Taylor CGN (eds) Molecular Biology and Human Diversity. Cambridge University Press, Cambridge, England, pp 141–155 [Google Scholar]
- Excoffier L, Schneider S (1999) Why hunter-gatherer populations do not show sign of Pleistocene demographic expansions. Proc Natl Acad Sci USA 96:10597–10602 [DOI] [PMC free article] [PubMed] [Google Scholar]
- Excoffier L, Slatkin M (1995) Maximum-likelihood estimation of molecular haplotype frequencies in a diploid population. Mol Biol Evol 12:921–927 [DOI] [PubMed] [Google Scholar]
- Excoffier L, Smouse P, Quattro J (1992) Analysis of molecular variance inferred from metric distances among DNA haplotypes: application to human mitochondrial DNA restriction data. Genetics 131:479–491 [DOI] [PMC free article] [PubMed] [Google Scholar]
- Fallin D, Schork NJ (2000) Accuracy of haplotype frequency estimation for biallelic loci, via the expectation-maximization algorithm for unphased diploid genotype data. Am J Hum Genet 67:947–959 [DOI] [PMC free article] [PubMed] [Google Scholar]
- Fay JC, Wu CI (2000) Hitchhiking under positive Darwinian selection. Genetics 155:1405–1413 [DOI] [PMC free article] [PubMed] [Google Scholar]
- Flint J, Bond J, Rees DC, Boyce AJ, Roberts-Thomson JM, Excoffier L, Clegg JB, Beaumont MA, Nichols RA, Harding RM (1999) Minisatellite mutational processes reduce Fst estimates. Hum Genet 105:567–576 [DOI] [PubMed] [Google Scholar]
- Flint J, Harding RM, Boyce AJ, Clegg JB (1998) The population genetics of the haemoglobinopathies. Baillieres Clin Haematol 11:1–51 [DOI] [PubMed] [Google Scholar]
- Flint J, Harding RM, Clegg JB, Boyce AJ (1993) Why are some genetic diseases common? Distinguishing selection from other processes by molecular analysis of globin gene variants. Hum Genet 91:91–117 [DOI] [PubMed] [Google Scholar]
- Frikha M, Fakhfakh F, Mseddi S, Gargouri J, Ghali L, Labiadh Z, Harrabi M, Souissi T, Ayadi H (1998) Hemoglobin βS haplotype in the Kebili region (southern Tunisia). Transfus Clin Biol 5:166–172 [DOI] [PubMed] [Google Scholar]
- Fu YX, Li WH (1996) Estimating the age of the common ancestor of men from the ZFY intron. Science 272:1356–1357 [DOI] [PubMed] [Google Scholar]
- Fullerton SM, Bond J, Schneider JA, Hamilton B, Harding RM, Boyce AJ, Clegg JB (2000a) Polymorphism and divergence in the β-globin replication origin initiation region. Mol Biol Evol 17:179–188 [DOI] [PubMed] [Google Scholar]
- Fullerton SM, Clark AG, Weiss KM, Nickerson DA, Taylor SL, Stengard JH, Salomaa V, Vartiainen E, Perola M, Boerwinkle E, Sing CF (2000b) Apolipoprotein E variation at the sequence haplotype level: implications for the origin and maintenance of a major human polymorphism. Am J Hum Genet 67:881–900 [DOI] [PMC free article] [PubMed] [Google Scholar]
- Fullerton SM, Harding RM, Boyce AJ, Clegg JB (1994) Molecular and population genetic analysis of allelic sequence diversity at the human β-globin locus. Proc Natl Acad Sci USA 91:1805–1809 [DOI] [PMC free article] [PubMed] [Google Scholar]
- Goldstein DB, Ruiz Linares A, Cavalli-Sforza LL, Feldman MW (1995) Genetic absolute dating based on microsatellites and the origin of modern humans. Proc Natl Acad Sci USA 92:6723–6727 [DOI] [PMC free article] [PubMed] [Google Scholar]
- Graven L, Passarino G, Semino O, Boursot P, Santachiara-Benerecetti AS, Langaney A, Excoffier L (1995) Evolutionary correlation between control region sequence and RFLP diversity pattern in the mitochondrial genome of a Senegalese sample. Mol Biol Evol 12:334–345 [DOI] [PubMed] [Google Scholar]
- Guo S, Thompson E (1992) Performing the exact test of Hardy-Weinberg proportion for multiple alleles. Biometrics 48:361–372 [PubMed] [Google Scholar]
- Haldane JBS (1949) Disease and evolution. Ricerca Sci 19:3–10 [Google Scholar]
- Harding R, Fullerton S, Griffiths R, Bond J, Cox M, Schneider J, Moulin D, Clegg J (1997) Archaic African and Asian lineages in the genetic ancestry of modern humans. Am J Hum Genet 60:772–789 [PMC free article] [PubMed] [Google Scholar]
- Hewitt R, Krause A, Goldman A, Campbell G, Jenkins T (1996) β-globin haplotype analysis suggests that a major source of Malagasy ancestry is derived from Bantu-speaking negroids. Am J Hum Genet 58:1303–1308 [PMC free article] [PubMed] [Google Scholar]
- Hill AV, Wainscoat JS (1986) The evolution of the α- and β-globin gene clusters in human populations. Hum Genet 74:16–23 [DOI] [PubMed] [Google Scholar]
- Hill WG (1972) Effective size of populations with overlapping generations. Theor Popul Biol 3:278–289 [DOI] [PubMed] [Google Scholar]
- Kalbfleisch JG (1985) Probability and statistical inference. Vol 2: Statistical inference. Springer-Verlag, New York [Google Scholar]
- Kaplan NL, Hill WG, Weir BS (1995) Likelihood methods for locating disease genes in nonequilibrium populations. Am J Hum Genet 56:18–32 [PMC free article] [PubMed] [Google Scholar]
- Kaplan N, Hudson RR, Iizuka M (1991) The coalescent process in models with selection, recombination and geographic subdivision. Genet Res 57:83–91 [DOI] [PubMed] [Google Scholar]
- Labie D, Srinivas R, Dunda O, Dode C, Lapoumeroulie C, Devi V, Devi S, Ramasami K, Elion J, Ducrocq R, Krishnamoorthy R, Nagel RL (1989) Haplotypes in tribal Indians bearing the sickle gene: evidence for the unicentric origin of the βS mutation and the unicentric origin of the tribal populations of India. Hum Biol 61:479–491 [PubMed] [Google Scholar]
- Lalouel JM, Langaney A (1976) Bedik and Niokholonko of Senegal: inter-village relationship inferred from migration data. Am J Hum Genet 45:453–466 [Google Scholar]
- Lapoumeroulie C, Dunda O, Ducrocq R, Trabuchet G, Mony-Lobe M, Bodo JM, Carnevale P, Labie D, Elion J, Krishnamoorthy R (1992) A novel sickle cell mutation of yet another origin in Africa: the Cameroon type. Hum Genet 89:333–337 [DOI] [PubMed] [Google Scholar]
- Lavinha J, Goncalves J, Faustino P, Romao L, Osorio-Almeida L, Peres MJ, Picanco I, Martins MC, Ducrocq R, Labie D, Krishnamoorthy R (1992) Importation route of the sickle cell trait into Portugal: contribution of molecular epidemiology. Hum Biol 64:891–901 [PubMed] [Google Scholar]
- Le Hesran JY, Personne I, Personne P, Fievet N, Dubois B, Beyeme M, Boudin C, Cot M, Deloron P (1999) Longitudinal study of Plasmodium falciparum infection and immune responses in infants with or without the sickle cell trait. Int J Epidemiol 28:793–8 [DOI] [PubMed] [Google Scholar]
- Lie-Injo LE, Lim ML, Randhawa Z, Vijayasilan T, Hassan K (1987) Elevated G γ gene expression with specific β S gene haplotype, normal γ gene maps and presence of the Xmn I site −158 5′ to the G γ gene in Indian sickle cell anemia. Hemoglobin 11:231–239 [DOI] [PubMed] [Google Scholar]
- Livingstone FB (1989) Simulation of the diffusion of the β-globin variants in the Old World. Hum Biol 61:297–309 [PubMed] [Google Scholar]
- Long JC, Chakravarti A, Boehm CD, Antonarakis S, Kazazian HH (1990) Phylogeny of human beta-globin haplotypes and its implications for recent human evolution. Am J Phys Anthropol 81:113–130 [DOI] [PubMed] [Google Scholar]
- Martinson JJ, Excoffier L, Langaney A, Clegg JB (1995) High diversity of α-globin haplotypes in a Senegalese population, including many previously unreported variants. Am J Hum Genet 57:1186–1198 [PMC free article] [PubMed] [Google Scholar]
- Maynard Smith J, Haigh J (1974) The hitch-hiking effect of a favorable gene. Genet Res 23:23–35 [PubMed] [Google Scholar]
- Muniz A, Corral L, Alaez C, Svarch E, Espinosa E, Carbonell N, di Leo R, Felicetti L, Nagel RL, Martinez G (1995) Sickle cell anemia and β-gene cluster haplotypes in Cuba. Am J Hematol 49:163–164 [DOI] [PubMed] [Google Scholar]
- Nagel RL, Fabry ME, Pagnier J, Zohoun I, Wajcman H, Baudin V, Labie D (1985) Hematologically and genetically distinct forms of sickle cell anemia in Africa: the Senegal type and the Benin type. N Engl J Med 312:880–884 [DOI] [PubMed] [Google Scholar]
- Nagel RL, Fleming AF (1992) Genetic epidemiology of the β s gene. Baillieres Clin Haematol 5:331–365 [DOI] [PubMed] [Google Scholar]
- Nagel RL, Labie D (1985) The consequences and implications of the multicentric origin of the Hb S gene. Prog Clin Biol Res 191:93–103 [PubMed] [Google Scholar]
- Newton CR, Graham A, Heptinstall LE, Powell SJ, Summers C, Kalsheker N, Smith JC, Markham AF (1989) Analysis of any point mutation in DNA: the smplification refractory mutation system (ARMS). Nucelic Acids Res 17:2503–2516 [DOI] [PMC free article] [PubMed] [Google Scholar]
- Nickerson DA, Taylor SL, Weiss KM, Clark AG, Hutchinson RG, Stengard J, Salomaa V, Vartiainen E, Boerwinkle E, Sing CF (1998) DNA sequence diversity in a 9.7-kb region of the human lipoprotein lipase gene. Nat Genet 19:233–240 [DOI] [PubMed] [Google Scholar]
- Orkin SH, Antonarakis SE, Kazazian HH Jr (1983) Polymorphism and molecular pathology of the human β-globin gene. Prog Hematol 13:49–73 [PubMed] [Google Scholar]
- Pagnier J, Mears JG, Dunda-Belkhodja O, Schaefer-Rego KE, Beldjord C, Nagel RL, Labie D (1984) Evidence for the multicentric origin of the sickle cell hemoglobin gene in Africa. Proc Natl Acad Sci USA 81:1771–1773 [DOI] [PMC free article] [PubMed] [Google Scholar]
- Pante-De-Sousa G, Mousinho-Ribeiro RC, Dos Santos EJ, Guerreiro JF (1999) β-globin haplotypes analysis in Afro-Brazilians from the Amazon region: evidence for a significant gene flow from Atlantic West Africa. Ann Hum Biol 26:365–373 [DOI] [PubMed] [Google Scholar]
- Pasvol G (1980) The interaction between sickle haemoglobin and the malarial parasite Plasmodium falciparum. Trans R Soc Trop Med Hyg 74:701–705 [DOI] [PubMed] [Google Scholar]
- Perrin P, Bouhass R, Mselli L, Garguier N, Nigon VM, Bennani C, Labie D, Trabuchet G (1998) Diversity of sequence haplotypes associated with β-thalassaemia mutations in Algeria: implications for their origin. Gene 213:169–177 [DOI] [PubMed] [Google Scholar]
- Pison G, Hill KH, Cohen B, Foote KA (1995) Population dynamics of Senegal. National Academy Press, Washington, DC [Google Scholar]
- Poloni ES, Excoffier L, Mountain JL, Langaney A, Cavalli-Sforza LL (1995) Nuclear DNA polymorphism in a Mandenka population from Senegal: comparison with eight other human populations. Ann Hum Genet 59:43–61 [DOI] [PubMed] [Google Scholar]
- Poloni ES, Passarino G, Santachiara-Benerecetti AS, Semino O, Langaney A, Excoffier L (1997) Human genetic affinities for Y chromosome p49a,f/Taq I haplotypes show strong correspondence with linguistics. Am J Hum Genet 61:1015–1035 [DOI] [PMC free article] [PubMed] [Google Scholar]
- Powars DR, Chan L, Schroeder WA (1989) The influence of fetal hemoglobin on the clinical expression of sickle cell anemia. Ann N Y Acad Sci 565:262–278 [DOI] [PubMed] [Google Scholar]
- Powars DR, Meiselman HJ, Fisher TC, Hiti A, Johnson C (1994) β-S gene cluster haplotypes modulate hematologic and hemorheologic expression in sickle cell anemia: use in predicting clinical severity. Am J Pediatr Hematol Oncol 16:55–61 [PubMed] [Google Scholar]
- Ramsay M, Jenkins T (1987) Globin gene-associated restriction-fragment-length polymorphisms in southern African peoples. Am J Hum Genet 41:1132–44 [PMC free article] [PubMed] [Google Scholar]
- Rannala B, Slatkin M (1998) Likelihood analysis of disequilibrium mapping, and related problems. Am J Hum Genet 62:459–73 [DOI] [PMC free article] [PubMed] [Google Scholar]
- Rich SM, Licht MC, Hudson RR, Ayala FJ (1998) Malaria's Eve: evidence of a recent population bottleneck throughout the world populations of Plasmodium falciparum. Proc Natl Acad Sci USA 95:4425–4430 [DOI] [PMC free article] [PubMed] [Google Scholar]
- Ringelhann B, Hathorn MK, Jilly P, Grant F, Parniczky G (1976) A new look at the protection of hemoglobin AS and AC genotypes against Plasmodium falciparum infection: a census tract approach. Am J Hum Genet 28:270–279 [PMC free article] [PubMed] [Google Scholar]
- Rund D, Kornhendler N, Shalev O, Oppenheim A (1990) The origin of sickle cell alleles in Israel. Hum Genet 85:521–524 [DOI] [PubMed] [Google Scholar]
- Sanchez-Mazas A, Steiner Q-G, Grundschober C, Tiercy JM (2000) The molecular determination of HLA-Cw alleles in the Mandenka (West Africa) reveals a close genetic relationship between Africans and Europeans. Tissue Antigens 56:303–312 [DOI] [PubMed] [Google Scholar]
- Schierup MK (1998) The number of self-incompatibility alleles in a finite, subdivided population. Genetics 149:1153–1162 [DOI] [PMC free article] [PubMed] [Google Scholar]
- Schierup MK, Charlesworth D, Vekemans X (2000a) The effect of hitch-hiking on genes linked to a balanced polymorphism in a subdivided population. Genet Res 76:63–73 [DOI] [PubMed] [Google Scholar]
- Schierup MK, Vekemans X, Charlesworth D (2000b) The effect of subdivision on variation at multi-allelic loci under balancing selection. Genet Res 76:51–62 [DOI] [PubMed] [Google Scholar]
- Schneider S, Roessli D, Excoffier L (2000) Arlequin: a software for population genetics data analysis. User manual version 2.000. Genetics and Biometry Laboratory, Department of Anthropology, University of Geneva, Geneva [Google Scholar]
- Semenza GL, Malladi P, Surrey S, Delgrosso K, Poncz M, Schwartz E (1984) Detection of a novel DNA polymorphism in the β-globin gene cluster. J Biol Chem 259:6045–6048 [PubMed] [Google Scholar]
- Shaw CT (1990) The prehistory of West Africa. In: Ki-Zerbo J (ed) General history of Africa, abr ed. Vol 1: Methodology and African prehistory. James Currey Ltd, London, pp 264–273 [Google Scholar]
- Slatkin M, Excoffier L (1996) Testing for linkage disequilibrium in genotypic data using the EM algorithm. Heredity 76:377–383 [DOI] [PubMed] [Google Scholar]
- Slatkin M, Rannala B (1997) Estimating the age of alleles by use of intraallelic variability. Am J Hum Genet 60:447–458 [PMC free article] [PubMed] [Google Scholar]
- Slatkin M, Rannala B (2000) Estimating allele age. Annu Rev Genomics Hum Genet 1:225–249 [DOI] [PubMed] [Google Scholar]
- Sow A, Peterson E, Josifovska O, Fabry ME, Krishnamoorthy R, Nagel RL (1995) Linkage-disequilibrium of the Senegal haplotype with the βS gene in the Republic of Guinea. Am J Hematol 50:301–303 [DOI] [PubMed] [Google Scholar]
- Steinberg MH, Hsu H, Nagel RL, Milner PF, Adams JG, Benjamin L, Fryd S, Gillette P, Gilman J, Josifovska O, Hellman-Erlingsson S, Safaya S, Huey L, Rieder RF (1995) Gender and haplotype effects upon hematological manifestations of adult sickle cell anemia. Am J Hematol 48:175–181 [DOI] [PubMed] [Google Scholar]
- Stine OC, Dover GJ, Zhu D, Smith KD (1992) The evolution of two West African populations. J Mol Evol 34:336–344 [DOI] [PubMed] [Google Scholar]
- Thomas JJ, Kutlar A, Scott DF, Lanclos KD (1998) Inhibition of gene expression by the Ggamma 5′ flanking region of the Bantu βS chromosome. Am J Hematol 59:51–56 [DOI] [PubMed] [Google Scholar]
- Tiercy J-M, Sanchez-Mazas A, Excoffier L, Shi-Isaac X, Jeannet M, Mach B, Langaney A (1992) HLA-DR polymorphism in a Senegalese Mandenka population: DNA oligotyping and population genetics of DRB1 specificities. Am J Hum Genet 51:592–608 [PMC free article] [PubMed] [Google Scholar]
- Tishkoff SA, Pakstis AJ, Ruano G, Kidd KK (2000) The accuracy of statistical methods for estimation of haplotype frequencies: an example from the CD4 locus. Am J Hum Genet 67:518–522 [DOI] [PMC free article] [PubMed] [Google Scholar]
- Tishkoff SA, Varkonyi R, Cahinhinan N, Abbes S, Argyropoulos G, Destro-Bisol G, Drousiotou A, Dangerfield B, Lefranc G, Loiselet J, Piro A, Stoneking M, Tagarelli A, Tagarelli G, Touma EH, Williams SM, Clark AG (2001) Haplotype diversity and linkage disequilibrium at human G6PD: recent origin of alleles that confer malarial resistance. Science 293:455–462 [DOI] [PubMed] [Google Scholar]
- Trabuchet G, Elion J, Baudot G, Pagnier J, Bouhass R, Nigon VM, Labie D, Krishnamoorthy R (1991) Origin and spread of β-globin gene mutations in India, Africa, and Mediterranea: analysis of the 5′ flanking and intragenic sequences of βS and βC genes. Hum Biol 63:241–252 [PubMed] [Google Scholar]
- Tremblay M, Vezina H (2000) New estimates of intergenerational time intervals for the calculation of age and origins of mutations. Am J Hum Genet 66:651–658 [DOI] [PMC free article] [PubMed] [Google Scholar]
- Wainscoat JS, Hill AVS, Boyce AL, Flint J, Hernandez M, Thein SL, Old JM, Lynch JR, Falusi AG, Weatherall DJ, Clegg JB (1986) Evolutionary relationships of human populations from an analysis of nuclear DNA polymorphisms. Nature 319:491–493 [DOI] [PubMed] [Google Scholar]
- Weiss G, von Haeseler A (1996) Estimating the age of the common ancestor of men from the ZFY intron. Science 272:1359–1360 [DOI] [PubMed] [Google Scholar]
- Whitlock MC, Barton NH (1997) The effective size of a subdivided population. Genetics 146:427–441 [DOI] [PMC free article] [PubMed] [Google Scholar]
- Wiesenfeld SL (1967) Sickle-cell trait in human biological and cultural evolution. Development of agriculture causing increased malaria is bound to gene- pool changes causing malaria reduction. Science 157:1134–1140 [DOI] [PubMed] [Google Scholar]