Abstract
The isolation and purification of axon guidance molecules has enabled in vitro studies of the effects of axon guidance molecule gradients on numerous neuronal cell types. In a typical experiment, cultured neurons are exposed to a chemotactic gradient and their growth is recorded by manual identification of the axon tip position from two or more micrographs. Detailed and statistically valid quantification of axon growth requires evaluation of a large number of neurons at closely spaced time points (e.g. using a time-lapse microscopy setup). However, manual tracing becomes increasingly impractical for recording axon growth as the number of time points and/or neurons increases. We present a software tool that automatically identifies and records the axon tip position in each phase-contrast image of a time-lapse series with minimal user involvement. The software outputs several quantitative measures of axon growth, and allows users to develop custom measurements. For, example analysis of growth velocity for a dissociated E13 mouse cortical neuron revealed frequent extension and retraction events with an average growth velocity of 0.05 ± 0.14 µm/min. Comparison of software-identified axon tip positions with manually identified axon tip positions shows that the software’s performance is indistinguishable from that of skilled human users.
Keywords: Axon guidance, Image analysis, Time-lapse, Tracking, Neuron, Automated
1. Introduction
During embryonic development, neurons project their axons along specific, predetermined paths to make precise connections with their synaptic targets (Tessier-Lavigne and Goodman, 1996). Short-range guidance cues (e.g. extra-cellular matrix proteins, CAMs, NCAMs) and long-range guidance cues (i.e. gradients of soluble signaling molecules) create a chemical “roadmap” that is used by the axon to navigate its way through the embryo (Tessier-Lavigne and Goodman, 1996). In vitro studies using dissociated cultures are experimentally convenient for quantifying the turning and growth of individual neurons. However, the most commonly used method of quantifying the growth and turning response of dissociated neuron axons, developed by Poo and co-workers (Lohof et al., 1992; Ming et al., 1997a), requires the researcher to manually trace and measure the axon growth on phase-contrast micrographs. Given the large inherent variability in axon growth behavior, the number of analyzed neurons required for statistically significant quantification of axon growth and turning can be large. Commonly, 10–50 neurons per condition are traced and only the initial and end points of the growth process are recorded (Ming et al., 1997b, 2002; Xiang et al., 2002; Yuan et al., 2003). In one study (Yuan et al., 2003), the total number of neurons examined in all of the experiments was greater than 1300. The necessity of large numbers of neurons makes it impractical to analyze more than the minimum number of images required to evaluate axon growth and turning, i.e. one just before the guidance molecule is released into the extracellular environment, and one at the end of the experiment. Ming et al. (2002) have revealed the necessity of obtaining image sequences for discerning fine details and characterizing the dynamic events that collectively produce the turning angle and extent of axon growth observed at the end of the experiment. Clearly, an automated method to analyze sequences of axon growth images is needed.
Computer-assisted analysis has been used to various extents to study the migration and morphology of many cell types, including neutrophils (Azzara et al., 1992; Cheung et al., 1987; Donovan et al., 1986; Dow et al., 1987; Pedersen et al., 1988; Moghe et al., 1995; Sadhu et al., 2003; Vollmer et al., 1992) and neurons (Bilsland et al., 1999; Distasi et al., 2002; Hossain and Morest, 2000; Hynds and Snow, 2002; Szebenyi et al., 2001). Migration and axon guidance studies rely upon phase-contrast or fluorescence microscopy to document the growth process. For accurate and automated documentation of axon growth in a time-lapse series, a computer must: (1) automatically and faithfully differentiate the axon from the background in each image, (2) automatically identify the axon tip, and (3) track the position of the axon tip over time. To the best of our knowledge, none of the currently available software programs meet all the above requirements. For example, NIH Image, Scion Image, Image/J, and Metamorph® (Version 6.1) are able to process images (contrast adjustment, thresholding, filtering, etc.), but they cannot identify the axon tip nor automatically output quantitative measures on time-lapse sequences. Imaris™ 4.0 (Bitplane, Inc.) and Neurolucida™ (MicroBrightField, Inc.) cannot utilize phase-contrast images, automatically identify the axon tip, nor analyze time-lapse image sequences. Programs developed by Ziv (2004) and Hynds and Snow (2002) process images and output quantitative measures automatically, but only Ziv’s program processes time-lapse image sequences; neither program identifies the axon tip specifically. ImageXpress™ (Axon Instruments) processes time-lapse image sequences and automatically outputs quantitative measures, but it requires fluorescence images and does not identify or track the axon tip throughout the time-lapse image sequence.
Here we present a freeware computer program, termed Automated Analysis of Axon Growth (A3G), that identifies and tracks the axon tip position over time in phase-contrast, time-lapse image sequences, and outputs user-defined quantitative measures of axon growth. The speed of axon tip identification (<2 min for 90 images) far exceeds that of manual tip identification, greatly accelerating data analysis and enabling time-lapse axon growth studies. The program was developed using a commercially available software package that provides an easy-to-use framework for users to customize A3G and subsequent data analysis. For this study, we restricted our scope to the growth of murine cortical neurons, which grow a single, distinct axon with limited branching.
2. Methods
2.1. Neuronal culture
E12–E13 mouse embryos were harvested from timed-pregnant white Swiss Webster female mice (Harlan-ATL). Embryos were decapitated in ice-cold, oxygenated Shatz artificial cerebral spinal fluid (ACSF; in mM: NaCl 119, KCl 2.5, MgCl2 1.3, CaCl2 2.5, NaH2PO4 1, NaHCO3 26.2, glucose 11). Cortices were dissected using fine scissors and incubated in trypsin (0.025%) in Ca2+/Mg2+-free Shatz ACSF (in mM: 124.7, KCl 2.5, NaHCO3 26.2, NaH2PO4 1.0, glucose 11.0) for 20 min at 37 °C. The trypsin was then removed via aspiration and the cell suspension was rinsed three times with Neurobasal™ medium (Gibco) supplemented with B-27 (1×) (Gibco) and 100 U/ml penicillin–streptomycin (Gibco). The cortical tissue was then triturated with a glass Pasteur pipette. Dissociated cells were plated on 12mm diameter glass cover slips (Fischer Scientific) coated with poly-d-lysine (Sigma)(MW= 70,000–150,000, 100 µg/mL for 1 h at 25 °C, rinsed and dried overnight). Cells were then cultured in the aforementioned supplemented Neurobasal™ medium in a humidified 37 °C,5%CO2 incubator or in a custom-made microscope stage incubator. Briefly, a Plexiglas enclosure around the microscope’s body was heated to 37 °C using a silent air blower (Nikon Instruments) to maintain optimal temperature for neuron growth and minimize thermal drifts during imaging. Inside the enclosure, the cell culture dish was placed on a thin, glass microscope stage insert. The dish was covered with a small Plexiglas box, which was perfused with 5% CO2 air that has been heated and humidified in a packed-bed humidification column present inside the enclosure.
2.2. Image acquisition
Neuron growth was visualized using a SPOT camera (Diagnostic Instruments) attached to a TE2000-U inverted microscope (Nikon Instruments). Time-lapse phase-contrast micrographs were acquired using MetaMorph® 5.0 software (Universal Imaging).
2.3. Software
The A3G software was developed in the matrix language MATLAB™ (Version 6.5) (The MathWorks), utilizing the Image Processing Toolbox (Version 3.2). MATLAB™ was chosen for its built-in image processing tools and amenability to user modification. Acceptable formats include TIFF, JPG, GIF, and BMP. A3G.m and the associated subroutine QUANT_ANALYSIS.m are available under as open source license at http://www.rfpk.washington.edu.
3. Results and discussion
The A3G software analyzes time-lapse image series in three steps:
1. Initialization and image processing
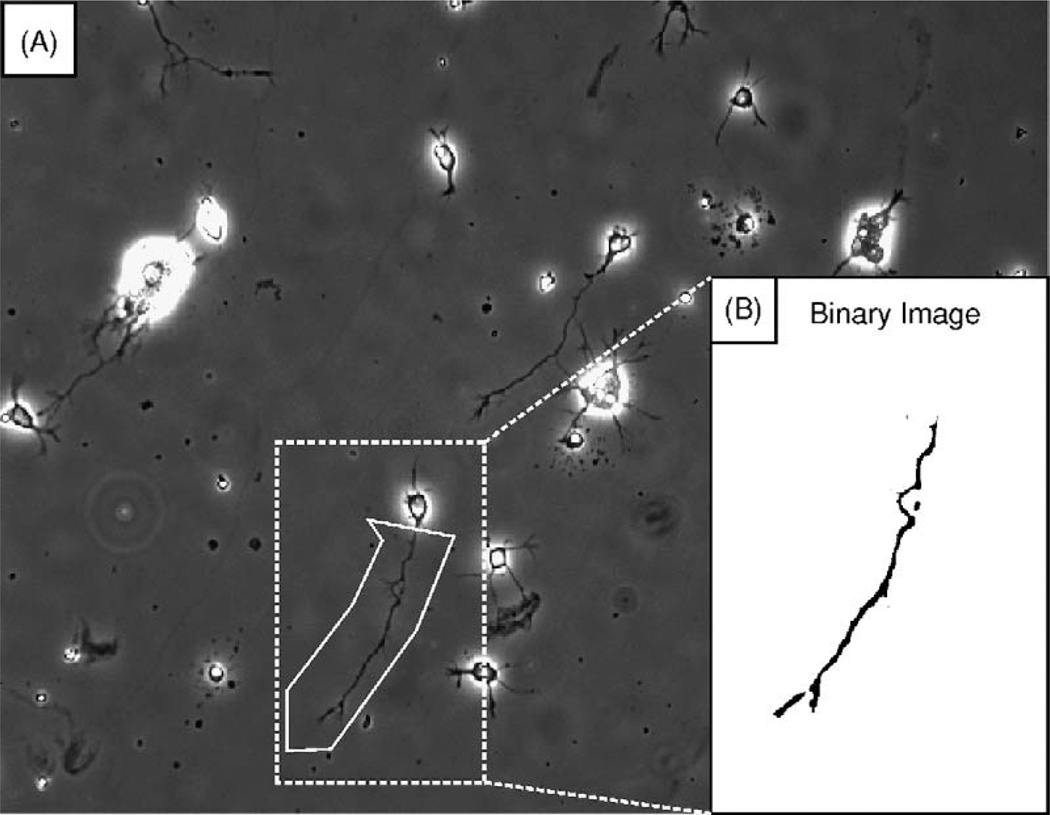
The software begins by prompting the user to crop the neuron of interest from the image sequence (Fig. 1). Image cropping allows the user to exclude other neurons in the image sequence from the analysis, and improves the performance of the axon tip search algorithm by excluding image features that may interfere with tip identification. The software then prompts the user to define the axon tip in the first and last images of the sequence. This step provides A3G with reference points to help determine the position of the axon tip. The image sequence is then contrast-adjusted, thresholded, and filtered to produce a cleaned, binary image sequence, in which the axon appears black on a white background, suitable for computer-assisted axon tip identification.
Fig. 1. Image processing.
(A) The user selects a rectangular region (dotted line) encompassing the entire neuron in the last image of the series. Debris and undesired image features can be excluded from subsequent analysis with a polygonal regioning tool (solid line). (B) The polygonal cropped image is then contrast-adjusted, thresholded, and filtered to generate the binary image used by the search algorithm.
2. Axon tip search algorithms
Prior to starting the search, the user is asked to choose the temporal direction of the search. In the event that the axon encounters another object that could not be excluded with image cropping, one of the temporal search directions is likely to be more accurate than the other. In combination with the user-defined axon tip positions, this step defines the proximal-distal axis of the axon. Next, the user must choose one of two axon tip search algorithms, termed “box search” and “region search”. For clarity, we defineATP(n) as the axon tip position in image n, where n=1, 2, …, N, and N is the number of images in the stack. Thus, the user defines ATP(1) and ATP(N) for both forward and backward searches.
Box search
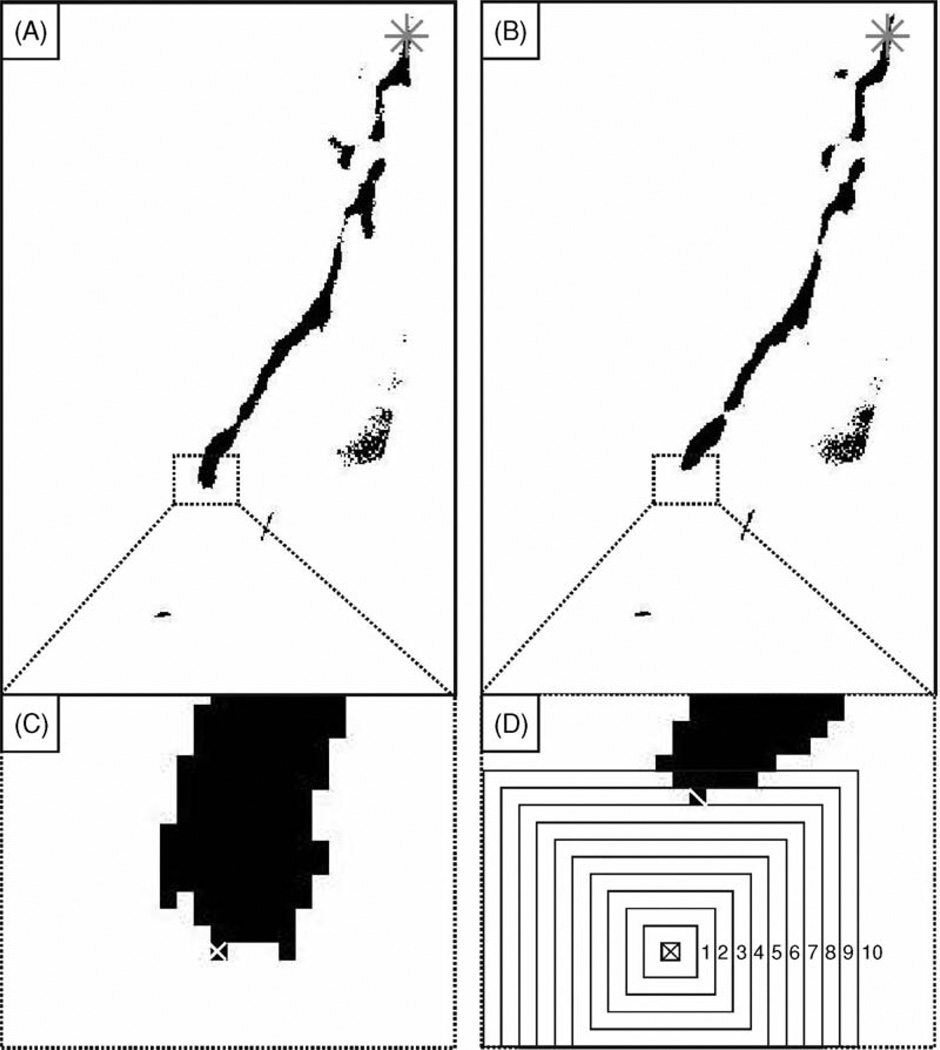
The box search algorithm restricts its searching iterations in the area where growth is expected, i.e. around the axon tip position found by the previous iteration. The algorithm searches for the nearest black pixel in increasingly larger box regions around the ATP from the previous iteration to find ATP(n) (Fig. 2). For a forward search the algorithm begins with ATP(1) and uses ATP(n − 1) to find ATP(n). For a backward search the algorithm begins with ATP(N) and uses ATP(n + 1) to find ATP(n). The search within each box is based on the overall orientation of the axon within the image. For a search on any given image n, the most distal corner of the search box is defined as the search start point and the most proximal corner is defined as the end point. If black pixels are found during the search iteration, the most distal pixel is defined as ATP(n). If ATP(n) resides in the perimeter of the search box or no black pixel is found, then the box size is increased by 2 pixel, and another search iteration is conducted. The box continues to increase in size and the searches repeated until a non-perimeter black pixel is found. The selection of a non-perimeter black pixel increases the likelihood that the algorithm finds the true axon tip and not simply the edge of the axon shaft. The box search algorithm’s accuracy and speed is designed to improve with the number of images acquired per unit time, since the differences to be detected between images decrease when the distance advanced by the axon decreases.
Fig. 2. Box search.
(A) and (B) are successive images (labeled n and n − 1, respectively) in the time-lapse series. The asterisk (*) marks the position of ATP(1). (C) The axon tip position ATP(n − 1) (marked with white ×) in (A) is used as the starting point for the search in (B). (D) The absence of a black pixel in the original 3 pixel × 3 pixel search box causes the box to increase by 2 pixel in each dimension. The 10th iteration finds the first non-perimeter black pixel (marked with white \), which is chosen as the axon tip for image n, ATP(n).
Region search
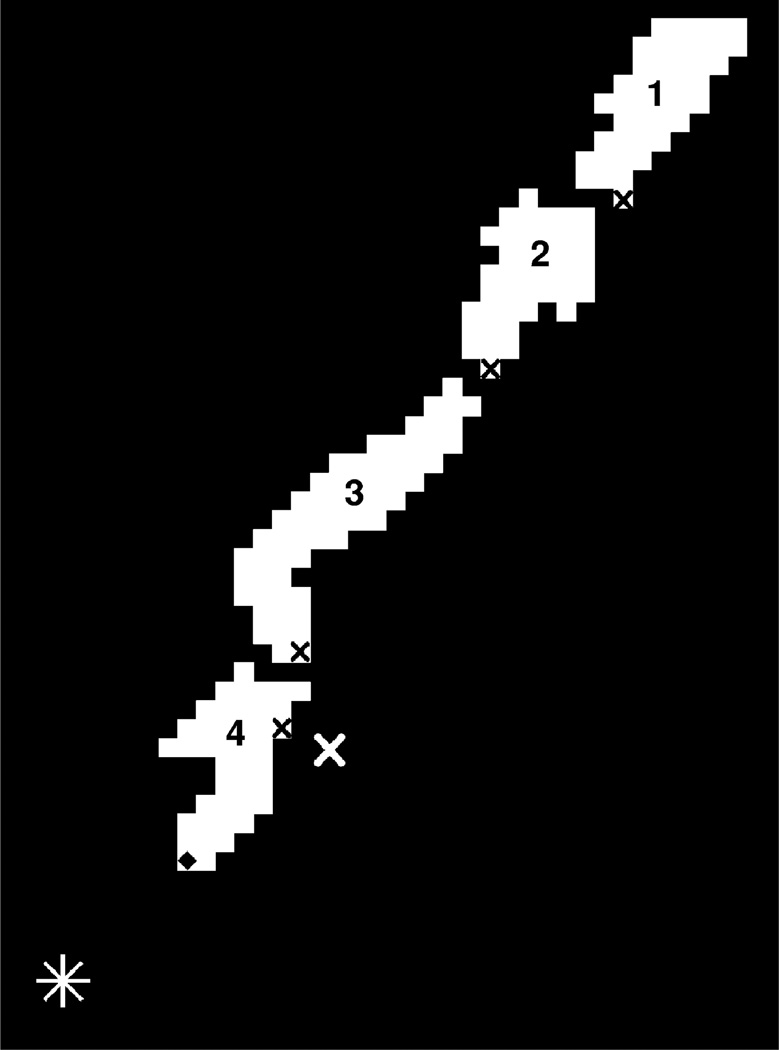
The region search algorithm takes advantage of built-in image recognition sub-routines available within MATLAB™. The search begins by inverting the binary image sequence to produce images where the axon appears white on a black background. Next, the search uses the MATLAB™ function “bwlabel”, which labels connected objects (defined as contiguous white pixel “islands”) within the image with unique identifiers (Fig. 3). For any given image n, the algorithm finds the labeled island nearest ATP(n − 1) and assumes that this island contains ATP(n). The most distal pixel within this island is thus ATP(n).
Fig. 3. Region search.
The cleaned binary image is inverted to produce a white axon on a black background. MATLAB™ labels each region with a unique number (here, 1–4). The white asterisk (*) marks the position of the axon tip identified by the user in the last image, ATP(N). The white × marks the position of the axon tip identified in the previous image of the search, ATP(n − 1). The black × in each region marks the pixel region nearest to ATP(n − 1) in that region. Here, Region 4 contains the marked pixel that is nearest to ATP(n − 1), so Region 4 is assumed to contain the axon tip. The pixel in Region 4 (marked with ◆) nearest to ATP(N) is chosen as the axon tip position for the current image, ATP(n).
3. Output
Upon completion of the tip search, the user is asked to visually confirm the accuracy of the ATP(n) set by viewing a movie of the time-lapse images with the overlaid ATP(n). If the search is deemed inaccurate, the user is given the option of re-thresholding the image sequence and repeating the search algorithm, or manually defining the axon tip in problematic images. A data file containing the (X, Y) coordinates of each accurate ATP(n) is saved in text column form in a user-specified computer directory.
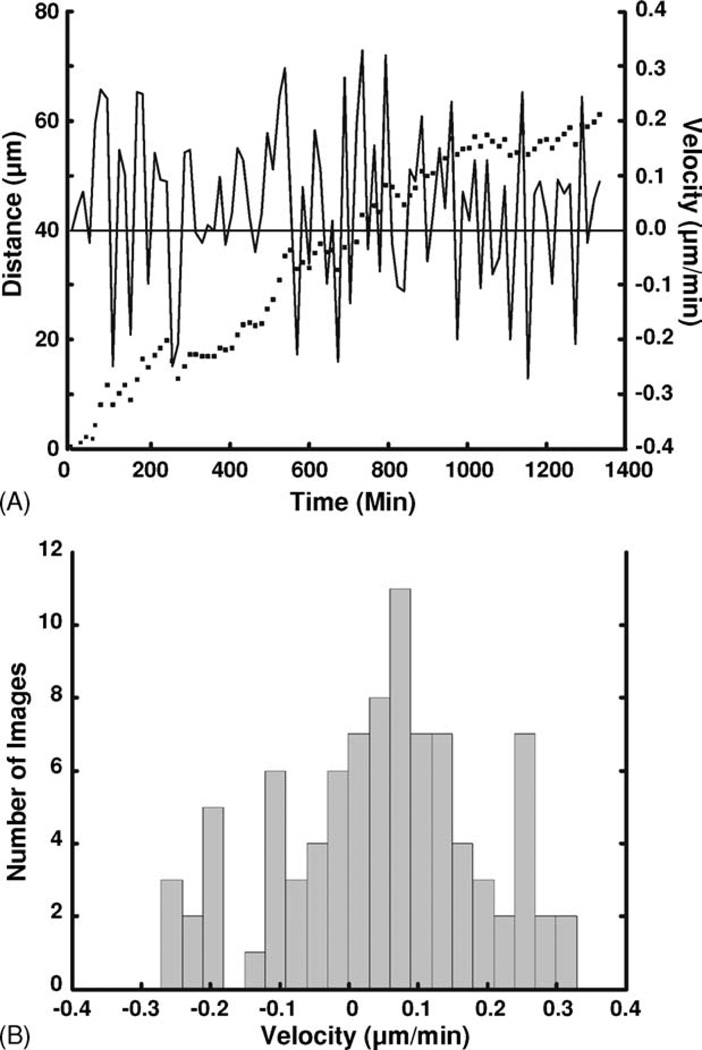
Analysis of axon growth dynamics becomes straight-forward using the ATP(n) coordinates. As an example, Fig. 4 shows how A3G can produce data on axon growth velocity and total axon growth distance for a 90-image time-lapse sequence of axon growth. To ascertain the incremental distance and velocity in the major direction of axon growth, we arbitrarily projected the vectors between successive time points onto the line connecting ATP(1) and ATP(N). A histogram of axon growth velocities, shown in Fig. 4B, reveals a mean velocity of 0.05 ± 0.14 µm/min. Note the frequent occurrence of negative velocities, corresponding to periods of axon retraction during substrate exploration by the growth cone. We stress that such data on the dynamics of axon growth would have been extremely time consuming to obtain manually. A3G also gives the user the option to calculate the traditional axon turning angle based on a user-defined time point after which the axon is expected to turn. Other quantitative measures and plots of axon growth are certainly possible and are left to the user’s interests and imagination.
Fig. 4. Axon growth distance and velocity along final trajectory.
(A) Plot of growth distance (left vertical axis, dots) and velocity (right vertical axis, continuous line) along the final axon trajectory as a function of time: (…) growth distance; (—) velocity. (B) Histogram of the growth velocities. Mean = 0.05 ± 0.14 µm/min.
3.1. A3G validation
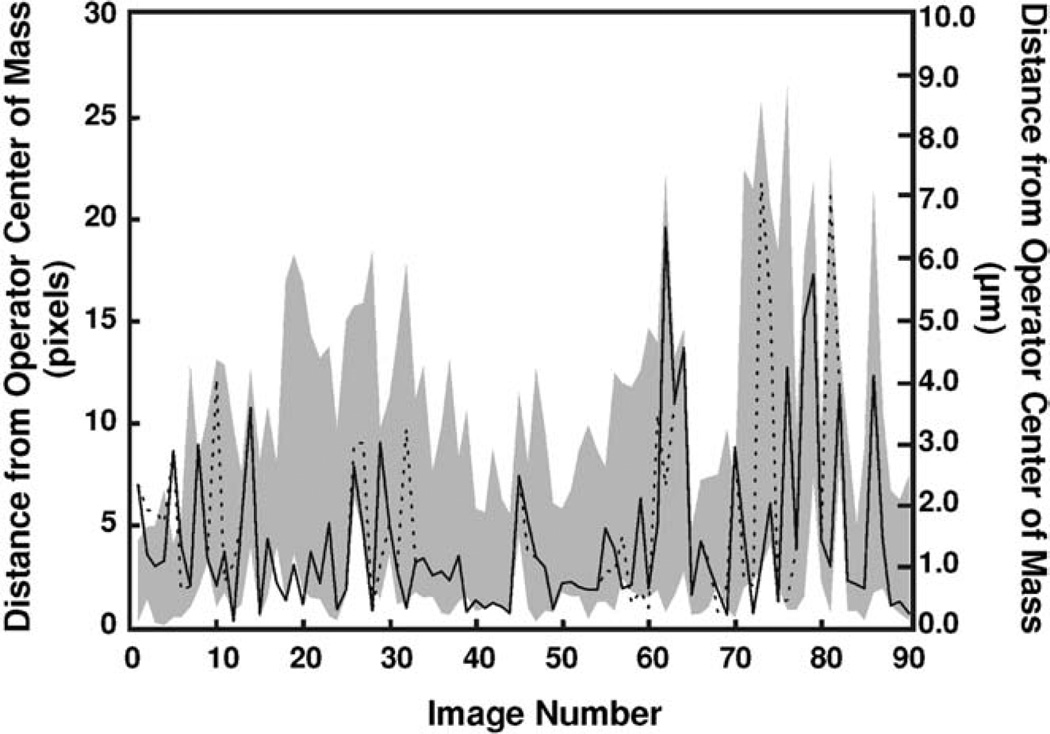
To test the accuracy of A3G, 11 users were asked to identify the axon tip manually (i.e. using the computer mouse) in two time-lapse image stacks (90 images each), generating a set of 11 human-identified axon tip positions, H-ATP(n), for each image n. Using the center of mass of these points, HCM(n), as the “gold standard”, the distance between HCM(n) and H-ATP(n) was compared to the distance between HCM(n) and the two ATP(n) (each search algorithm identified a different ATP(n)) for each image in the stacks (Fig. 5). The range of the distances between H-ATP(n) and HCM(n) is shaded in gray. Over 88.9% of the ATP(n) fall within the H-ATP(n) range, indicating that the software’s performance is virtually indistinguishable from that of a human. In the few images where ATP(n) falls outside of the H-ATP(n) range, the distance between the ATP(n) and the HCM is very small, <2.2 axon widths (~22 pixel for the camera and magnification used for this study). Not surprisingly, all the ATP(n) peaks (and most of the H the H-ATP(n) peaks) coincide with periods of intensive substrate exploration, characterized by significant growth cone branching. This exploration temporarily confuses both the program and the humans as to which branch or part of the growth cone has advanced furthest. Nevertheless, the percentage of ATP(n) within 10 pixel of the HCM was comparable to that of H-ATP(n) (89.6%) for both the box and region searches (86.7 and 90.0%, respectively). A similar human–computer comparison performed on a second stack of images yielded similar results: 87.3, 85.6 and 84.4% of the H-ATP(n), ATP(n) box search, and ATP(n) region search, respectively, fell within 1 axon width (~10 pixel) of the HCM(n); the remaining images fell within 2.0 axon widths.
Fig. 5. Manual vs. A3G tip identification.
The distances between A3Gidentified axon tips and the center of mass of axon tips identified by 11 human operators (HCM) are shown for the box (dotted line) and region (continuous line) search analyses of a 90-image sequence. The shaded region represents the range of distances between manually identified tips (11 humans) and the HCM for each image.
The accuracy of A3G depends on the image quality, especially during the thresholding step upon which the search algorithm relies. For time-lapse series in which the background and the axon have consistently distinct intensities for all images, A3G performs well with the automatic thresholding level. In all instances in which A3G was unable to accurately find the axon tip selected by human users, excluding natural axon branching events, the cause of failure was inaccurate thresholding. If the intensities of the axon and background approach the same value and/or the image intensities vary throughout the series, the use of a single thresholding level will not generate consistently faithful binary images, which can result in ATP(n) errors. With A3G the user has the ability to correct the thresholding intensity value or to manually define the axon tip in problematic images.
If the axon branches grow in very close proximity, the A3G software may not consistently choose the same axon branch even for consecutive images. The A3G software will always pick the most distal branch without regard for which branch it previously chose. Humans unaware of the final axon growth path face the same “picking dilemma” over which of the two branching tips is the “true” axon tip. Although the existence of competing axon branches can make interpretation of quantitative measures derived from the ATP(n) difficult, the picking dilemma reflects the real biological variability in axon growth mechanisms; thus, periods of intensive exploration of the substrate by the growth cone are appropriately represented as wide fluctuations in the ATP(n) values. It should be possible to add a module in A3G that keeps track of the branching events and traces growth on multiple branches.
4. Conclusion
In summary, A3G automatically identifies and records the axon tip position in every frame of a time-lapse movie of a growing axon, circumventing the prohibitive human labor requirements of analyzing large numbers of images typical of current methods. Two different search algorithms performed similarly to human users in identifying the axon tip. The A3G software is built with MATLAB™, a widely available programming platform that allows for customization by the user with minimal expertise. In its present version, A3G is limited to axons that do not branch extensively, but we believe it is possible to design a more sophisticated algorithm that tracks growth along multiple branches. Nevertheless, we believe that A3G will greatly facilitate the extraction of axon growth measurements that are crucial to understanding the subtle, dynamic mechanisms of axon guidance.
Acknowledgments
This work was partially supported by an NSF Career Award (A.F.) and NIH grants 5R21EB003307 and 5P41EB001975. Please consult http://www.rfpk.washington.edu for instructions about how to obtain A3G.
References
- Azzara A, Chimenti M, Azzarelli L, Fanini E, Carulli G, Ambrogi F. An image processing workstation for automatic evaluation of human granulocyte motility. J Immunol Meth. 1992;148:29–40. doi: 10.1016/0022-1759(92)90155-m. [DOI] [PubMed] [Google Scholar]
- Bilsland J, Rigby M, Young L, Harper S. A rapid method for semi-quantitative analysis of neurite outgrowth from chick DRG explants using image analysis. J Neurosci Meth. 1999;92:75–85. doi: 10.1016/s0165-0270(99)00099-0. [DOI] [PubMed] [Google Scholar]
- Cheung AT, Donovan RM, Miller ME, Bettendorff AJ, Goldstein E. Quantitative microscopy. I. A computer-assisted approach to the study of polymorphonuclear leukocyte (PMN) chemotaxis. J Leukoc Biol. 1987;41:481–491. doi: 10.1002/jlb.41.6.481. [DOI] [PubMed] [Google Scholar]
- Distasi C, Ariano P, Zamburlin P, Ferraro M. In vitro analysis of neuron-glial cell interactions during cellular migration. Eur Biophys J. 2002;31:81–88. doi: 10.1007/s00249-001-0194-y. [DOI] [PubMed] [Google Scholar]
- Donovan RM, Goldstein E, Kim Y, Lippert W, Cheung AT, Miller ME. A quantitative method for the analysis of cell shape and locomotion. Histochemistry. 1986;84:525–529. doi: 10.1007/BF00482986. [DOI] [PubMed] [Google Scholar]
- Dow JA, Lackie JM, Crocket KV. A simple microcomputer-based system for real-time analysis of cell behaviour. J Cell Sci. 1987;87:171–182. doi: 10.1242/jcs.87.1.171. [DOI] [PubMed] [Google Scholar]
- Hossain WA, Morest DK. Fibroblast growth factors (FGF-1, FGF-2) promote migration and neurite growth of mouse cochlear ganglion cells in vitro: immunohistochemistry and antibody perturbation. J Neurosci Res. 2000;62:40–55. doi: 10.1002/1097-4547(20001001)62:1<40::AID-JNR5>3.0.CO;2-L. [DOI] [PubMed] [Google Scholar]
- Hynds DL, Snow DM. A semi-automated image analysis method to quantify neurite preference/axon guidance on a patterned substratum. J Neurosci Meth. 2002;121:53–64. doi: 10.1016/s0165-0270(02)00231-5. [DOI] [PubMed] [Google Scholar]
- ImageXpress™, Axon Instruments, Inc. Personal communication with Chang Wang, Axon Instruments Technical Group. 2003 Sep 15; [Google Scholar]
- Imaris 4.0™. Bitplane AG. Personal communication with Tanya Hahn, Product Sales Specialist. 2003 Sep 9; [Google Scholar]
- Lohof AM, Quillan M, Dan Y, Poo M. Asymmetric modulation of cytosolic cAMP activity induces growth cone turning. J Neurosci. 1992;12:1253–1261. doi: 10.1523/JNEUROSCI.12-04-01253.1992. [DOI] [PMC free article] [PubMed] [Google Scholar]
- Ming G, Lohof AM, Zheng JQ. Acute morphogenic and chemotropic effects of neurotrophins on cultured embryonic xenopus spinal neurons. J Neurosci. 1997a;17:7860–7871. doi: 10.1523/JNEUROSCI.17-20-07860.1997. [DOI] [PMC free article] [PubMed] [Google Scholar]
- Ming G, Song H, Berninger B, Holt CE, Tessier-Lavigne M, Poo M. cAMP-dependent growth cone guidance by netrin-1. Neuron. 1997b;19:1225–1235. doi: 10.1016/s0896-6273(00)80414-6. [DOI] [PubMed] [Google Scholar]
- Ming G, Wong ST, Henley J, Yuan X, Song H, Spitzer NC, Poo M. Adaptation in the chemotactic guidance of nerve growth cones. Nature. 2002;417:411–418. doi: 10.1038/nature745. [DOI] [PubMed] [Google Scholar]
- Moghe PV, Nelson RD, Tranquillo RT. Cytokine-stimulated chemotaxis of human neutrophils in a 3-D conjoined fibrin gel assay. J Immunol Meth. 1995;180:193–211. doi: 10.1016/0022-1759(94)00314-m. [DOI] [PubMed] [Google Scholar]
- Neurolucida™, MicroBrightField Inc. Personal communication Geoff Greene. 2003 Sep 9; [Google Scholar]
- NIH Image and Image/J. [accessed August 23, 2004]; http://rsb.info.nih.gov/ [Google Scholar]
- Pedersen JO, Hassing L, Grunnet N, Jersild C. Real-time scanning and image analysis. A fast method for the determination of neutrophil orientation under agarose. J Immunol Meth. 1988;109:131–137. doi: 10.1016/0022-1759(88)90450-4. [DOI] [PubMed] [Google Scholar]
- Sadhu C, Masinovsky B, Dick K, Sowell CG, Staunton DE. Essential role of phophoinositide 3-kinase delta in neutrophil directional movement. J Immunol. 2003;170:2647–2654. doi: 10.4049/jimmunol.170.5.2647. [DOI] [PubMed] [Google Scholar]
- Szebenyi G, Dent EW, Callaway JL, Seys C, Leuth H, Kalil K. Fibroblast growth factor-2 promotes axon branching of cortical neurons by influencing morphology and behavior of the primary growth cone. J Neurosci. 2001;21:3932–3941. doi: 10.1523/JNEUROSCI.21-11-03932.2001. [DOI] [PMC free article] [PubMed] [Google Scholar]
- Tessier-Lavigne M, Goodman CS. The molecular biology of axon guidance. Science. 1996;274:1123–1133. doi: 10.1126/science.274.5290.1123. [DOI] [PubMed] [Google Scholar]
- Vollmer KL, Alberts JS, Carper HT, Mandell GL. Tumor necrosis factor-alpha decreases neutrophil chemotaxis to N-formyl-1-methionyl-1-leucl-1-phenylalanine: analysis of single cell movement. J Leukoc Biol. 1992;52:630–636. doi: 10.1002/jlb.52.6.630. [DOI] [PubMed] [Google Scholar]
- Xiang Y, Li Y, Zhang Z, Cui K, Wang S, Yuan X, Wu C, Poo M, Duan S. Nerve growth cone guidance mediated by G protein-coupled receptors. Nat Neurosci. 2002;5:843–848. doi: 10.1038/nn899. [DOI] [PubMed] [Google Scholar]
- Yuan X, Jin M, Xu X, Song Y, Wu C, Poo M, Duan S. Signalling and crosstalk of rho GTPases in mediating axon guidance. Nat Cell Biol. 2003;5(1):38–45. doi: 10.1038/ncb895. [DOI] [PubMed] [Google Scholar]
- Ziv Laboratory Homepage. Technion-Israel Institute of Technology. [accessed August 23, 2004]; http://brc.technion.ac.il/ziv.html. [Google Scholar]


