Abstract
Background
On thinking quantitatively of complex diseases, there are at least three statistical strategies for analyzing the gene-gene interaction: SNP by SNP interaction on single trait, gene-gene (each can involve multiple SNPs) interaction on single trait and gene-gene interaction on multiple traits. The third one is the most general in dissecting the genetic mechanism underlying complex diseases underpinning multiple quantitative traits. In this paper, we developed a novel statistic for this strategy through modifying the Partial Least Squares Path Modeling (PLSPM), called mPLSPM statistic.
Results
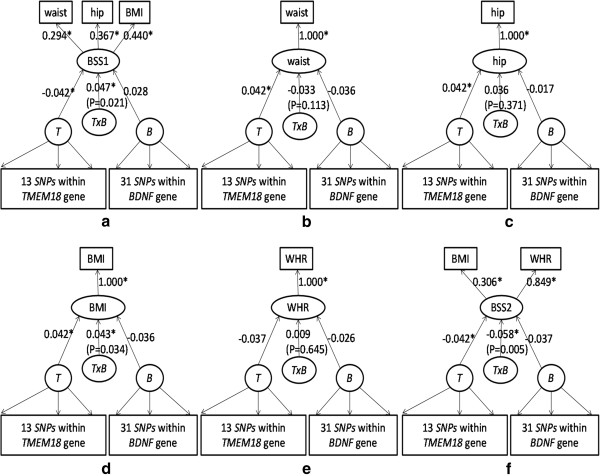
Simulation studies indicated that mPLSPM statistic was powerful and outperformed the principal component analysis (PCA) based linear regression method. Application to real data in the EPIC-Norfolk GWAS sub-cohort showed suggestive interaction (γ) between TMEM18 gene and BDNF gene on two composite body shape scores (γ = 0.047 and γ = 0.058, with P = 0.021, P = 0.005), and BMI (γ = 0.043, P = 0.034). This suggested these scores (synthetically latent traits) were more suitable to capture the obesity related genetic interaction effect between genes compared to single trait.
Conclusions
The proposed novel mPLSPM statistic is a valid and powerful gene-based method for detecting gene-gene interaction on multiple quantitative phenotypes.
Keywords: Thinking quantitatively for complex diseases, Gene-based gene-gene interaction, Quantitative traits, mPLSPM statistic
Background
In search of novel loci influencing complex traits in humans, successes in genome-wide association studies (GWAS) have been well-documented [1]. While these have greatly improved our understanding of the genetic architecture of complex traits, often implicating biological pathways previously went undetected, most genetic components for complex traits are still to be revealed. One can attribute this to the sub-optimality of their study designs, but inappropriate statistical data analysis strategy, including methods for gene-gene interaction analysis, may also play a role.
Although discussed extensively in the literature, a notable issue remains in GWAS using case–control design [2,3]. Given phenotypes of most complex diseases (obesity, hypertension, diabetes, to name a few) are actually quantitative [4], a case–control design is usually furnished by dividing particular continuous quantitative measurement into case and control groups with a cut off which might not relate so well with genetic variation. Assigning cutoff to a continuous variable can lead to loss of information, and decrease the statistical power caused by selection bias. A proposal revived recently is to treat common disorders as quantitative traits in a framework of thinking quantitatively such that GWAS should be conducted using a population cohort with multiple quantitative traits [4]. In this framework, a complex disease is caused by multiple genes with small effect and their interaction, as well as their interaction with multiple environmental factors. The quantitative phenotype (trait) is expected to be continuous and normally distributed [4-6]. While for some diseases such as body mass index (BMI, weight (in kilograms)/height (in meters)2) for obesity, blood pressure for hypertension, and mood for depression the relevant quantitative traits seem obvious, the relevant quantitative traits may not be entirely clear for diseases such as arthritis, autism, cancers, dementia and heart disease for which limited biomarkers are available. Even with obesity, BMI is only a proxy since it crudely measures the mean weight under given body surface area and varies with the amount of body fat and not a representation of its distribution. Various studies have shown that people with abdominal fat (with more weight around the waist) face more risks of cardiovascular diseases [7,8] and other related diseases (such as hypertension, type 2 diabetes, and high cholesterol) [9-11] than those with hip obesity (with more weight around the hip) [10], suggesting that the phenotype of obesity might be more appropriately a synthetically latent trait (SLT) combined from disease-related manifest variables (BMI, waist circumference, hip circumference and neck circumference etc.). This serves as a contrast with most GWASs either using case–control designs [2,3] or using quantitative variables [12-15] with simple linear regression and single SNP-SNP interaction.
To detect gene-gene interaction, at least three statistical strategies can be considered for quantitative phenotypes, including single SNP-SNP interaction on single trait, gene-gene (with multiple SNPs) interaction on single trait and gene-gene (with multiple SNPs) interaction on multiple traits. The first strategy is most susceptible to high false positive rate and low power in detecting modest effects owing to the ignorance of the linkage disequilibrium (LD) information between SNPs [16,17]. Moreover, genes are the functional units in living organisms, analysis by focusing on a gene as a system could potentially yield more biologically meaningful results. In view of this, LD information is used in the second strategy, and some methods aimed at gene-based gene-gene interaction detection exist [18-22]. Based on a gene-based association test –ATOM by combining optimally weighted markers within a gene [18], He et al. extend it to analysis gene–gene interactions [19]. First, they derive the optimal weight for both quantitative and binary traits based on pair-wised LD information and use the principal components (PCs) to summarize the information in each gene. Then, test for interactions between the PCs. In the work of Li and Cui, they conceptually propose a gene-centric framework for genome-wide gene–gene interaction detection [20]. They treat each gene as a testing unit and derive a model-based kernel machine method for two-dimensional genome-wide scanning of gene–gene interactions. Recently, Ma et al. combine marker-based interaction tests between all pairs of markers in two genes to produce a gene-level test for interaction between the two, to test the gene-based gene–gene interaction [21]. The tests are based on an analytic formula derived for the correlation between marker-based interaction tests due to LD. Although, aforementioned methods are proposed to detect the gene-based gene-gene interaction, they fall short of consideration on multiple traits or SLT, especially when the traits are genetic related. It is, therefore, desirable to develop new method to detect gene-gene (with multiple SNPs) interaction on multiple traits.
In this paper, we attempted to develop a novel model for detecting the effect of gene-gene interaction on the SLT summarized by multiple manifest traits. The proposed model was constructed by adding a product term of combined multiple SNPs effect within two genes (genes A and B) via Partial Least Squares Path Modeling (PLSPM) [23,24]. Thus, a structural equation model (SEM) was built between two genes and multiple manifest traits linked by the latent variables of gene A, gene B, gene A × gene B, and multiple traits, so that the gene-gene interaction statistic was defined based on the path coefficient between the latent variables of gene A × gene B and multiple traits. As the path coefficient in proposed statistic was calculated by modifying the Lohmöller PLSPM algorithm [25], we called it the modified PLSPM (mPLSPM) based statistic. Simulation studies were conducted to evaluate its type I error rate and power, and to compare its performance with the PCA-based linear regression model [26-28]. The method was also applied to a real data to evaluate its utility.
Methods
Statistical model
Our model is motivated from the original PLSPM which developed from structural equation models (SEM). SEM are complex models allowing the study of real world complexity by taking into account a whole number of causal relationships among latent concepts (i.e. the latent variables (LVs)), each measured by several observed indicators usually defined as manifest variables (MVs). Each path-modeling-based statistic is formed by 2 sub-models: structural (Inner) model and measurement (Outer) model. The structural model indicates the relationships among the latent variables, both of which are inferred from the observed SNPs (from different genes) and traits (e.g. waist, hip, BMI) respectively in this study. The measurement model formulation depends on the direction of the relationships between the latent variables and the corresponding manifest variables. As a matter of fact, different types of measurement model are available: the reflective model (or outwards directed model), the formative model (or inwards directed model) and the MIMIC model (a mixture of the two previous models). The reflective model has causal relationships from the latent variable to the manifest variables in its block. In contrast to reflective (or effects) model, the formative (causal) model has causal relationships from the manifest variables to the latent variables, namely the LV is caused (formed) by the MVs. Its construction is combination of observed (manifest) variables with multidimensional form and aims at minimizing residuals in structural relationships to explain the unobserved (latent) variable with higher R2[23]. More detailed interpretation for the original PLSPM see Additional file 1.
Figure 1 illustrates the framework for our mPLSPM statistic. Let X1 = (x11, x12, …, x1p) and X2 = (x21, x22, …, x2q) denote the genotypes of p SNPs within gene A and q SNPs within gene B, respectively, and Y = (y1, y2, …, yk) the multiple quantitative measures underlying specific disease, such as the waist circumference, hip circumference and BMI for measuring the human body shape. In this model, latent variables ξ1 and ξ2 from the two genes can be derived as with ξ3 from the quantitative traits. A product term ξ1 × ξ2 added to the PLSPM is used to measure the interaction between gene A and gene B, then we can get the structure model: ξ3 = β0 + β31ξ1 + β32ξ2 + γξ1ξ2 + ϵ. Moreover, path coefficients β31, β32, and γ are the main and interaction effects of gene A and gene B on the phenotype score or SLT (ξ3) respectively, while loadings (λ′s) quantify the relationship between manifest variables (MVs) and their latent variables (LVs). Parameters in the model can be estimated with Lohmöller’s algorithm [23,25], which include the latent variable scores (genetic scores ξ1, ξ2, and phenotype score ξ3), path coefficients (β31, β32, and γ) and loadings (λ′s). Specifically, latent variable scores are estimated using linear combinations of their MVs, obtained by an iterative algorithm based on simple/multiple least squares regressions. The path coefficients are derived by regression between dependent LV (ξ3) and independent LVs (including ξ1, ξ2 and their product term ξ1 × ξ2) obtained by least squares regression or partial least squares regressions (with higher multicollinearity between independent LVs). Loadings are gotten using regressions of each block of MVs with its LV, obtained by least squares regressions. Since the aim of mPLSPM statistic is mainly to capture the association between effect of SNPs set (genome region) and effect of traits (body shape), and after using “Cronbach’s alpha” tool for checking [24], the blocks meet homogeneity and unidimensionality. Therefore the reflective model is used to set up the measurement model. At the same time, the impact of multicollinearity between manifests can be alleviated.
Figure 1.
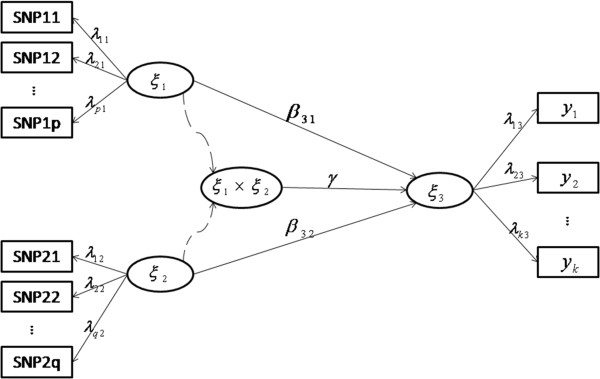
The modified PLSPM-based gene-gene interaction model.
In this paper, we modify the Lohmöller’s PLSPM algorithm to estimate the parameters. In details, the specific modified procedure is as follows: 1) working on standardized manifest variables and giving initial values on weights wij, iteratively alternating the outer and inner estimation steps; 2) specifically in the outer estimation step, the values of the latent variables ξ1, ξ2, and ξ3 were estimated by , and , respectively; 3) in the inner estimation step, the endogenous latent variable ѵη were updated with ν3 = cov(ν3, ν1)ν1 + cov(ν3, ν2)ν2 + cov(ν3, ν1ν2)ν1ν2, furthermore the exogenous latent variables ѵ1 and ѵ2 by ν1 = cov(ν1, ν3)ν3 and ν2 = cov(ν2, ν3)ν3; 4) updating weights before moving to the next step: w1j = cov(x1j, ν1), w2j = cov(x2j, ν2) and w3j = cov(yj, ν3). Steps 2)-4) were repeated until convergence (max (wij − new − wij − old) < ∆, where ∆ is a convergence tolerance usually set at 0.0001 or less), and the outer weights were obtained. In addition, significant test of path coefficients and loadings were furnished by bootstrap procedures [24,25].
Statistical significance
The modified statistics (mPLSPM) is defined as , where se (γ) denotes the standard deviation of γ. Significance of parameter γ under the null hypothesis (H0): γ = 0 and the alternative hypothesis(H1): γ ≠ 0 is tested via a normal statistic in the form , where se(γ) is calculated by the bootstrap procedures [29,30], since the distribution of parameters from modified PLSPM is unknown. The testing stages are as follows: 1) A large, pre-specified number of bootstrap samples (e.g. 1,000), each with the same number of subjects as the original sample, are generated via re-sampling with replacement. 2) Parameter estimation is done for each bootstrap sample using above modified algorithm, whose path coefficients or loadings can be viewed as drawings from their sampling distributions. All bootstrap samples together provided empirical estimators for the standard error of each parameter. 3) The result of bootstrapping procedure permits a U-test to be performed for the significance of the path coefficients or loadings, (for example in Figure 1), where Uemp represents the empirical U-value, w (for example γ in Figure 1) denotes the original path coefficient or loading, and se(w) (for example se(γ) in Figure 1) indicates its bootstrapping standard error. The normal distribution provides the critical U-values at given α-levels. The histogram of the statistic was shown in Additional file 1: Figure S2.
Simulation
Simulation was conducted similar to a previous paper [31] as follows. Genotype data was generated by software gs2.0 [32] according to phase 1 and 2 HapMap data. Multiple phenotypic data were created to mirror the European Prospective Investigation of Cancer (EPIC)-Norfolk study [33,34] for which the waist circumference, hip circumference, and BMI were defined as multiple quantitative traits to reflect the body shape as the SLT. As noted earlier [31], the influence of body fat distribution has been linked with body shape named crudely after the fruits and vegetable(s) they resemble most (chilli, apple, pear, and pear apple) [35,36]. People with a larger waist have higher risks of hypertension, type 2 diabetes and high cholesterol than those who carry excess weight on the hips [10,11]. The combination of BMI, waist and hip circumferences is also a good predictor of cardiovascular risk and mortality [11,35,37]. In this paper, the simulated phenotype data was created based on abdominal obesity population from the EPIC-Norfolk study. The simulation procedure was detailed as follows:
(1) Phased haplotype data were downloaded from the HapMap web site (http://snp.cshl.org) on regions involved FTO (Chr16:52426867..52430604 with eight SNPs) and NEGR1 (Chr1:71803870..71811085 with seven SNPs) on CEU population. Information on pair-wise r2 and minor allele frequencies is shown in Figure 2. Additive models were used for these SNPs. Based on the phased haplotypes, a large CEU population of 100,000 individuals was obtained via gs2.0 [32] with the 4th SNP of each region as the causal variants (called SNP1 and SNP2). In line with the current GWAS which are map-based rather than sequence-based, we removed the causal SNPs from simulated data to assess their indirect interaction effect on obesity related traits via correlated markers.
Figure 2.
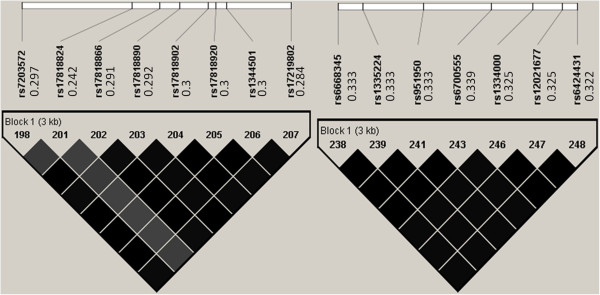
Pair-wise r2 among the selected FTO region and NEGR1region. The values to the right of the dbSNP IDs (rs# IDs) are the corresponding minor allele frequencies.
(2) As waist and waist to hip ratio (WHR) were commonly used to predict the type-II diabetes and cardiovascular disease [10,11,38,39], we created an abdominal obesity data set based on abdominal obesity sample (N = 355) in EPIC-Norfolk study. Multiple quantitative phenotypes with three traits (waist, hip, BMI) were generated from a trivariate normal distribution Y ~ N(μ, Σ) to assess our proposed statistic, where Y = (y1, y2, y3) was the random vector (waist, hip, BMI) for abdominal obesity types in EPIC-Norfolk study, with their sample mean = (105.2746, 106.0051, 29.2172) and covariance . The QQ-plots of the three variables (waist, hip, BMI) among the abdominal obesity groups are seen in Additional file 1. Supposed the causal SNPs’ interaction effect only on waist not on hip, under H0, the causal SNP1 and SNP2 had no interaction effect but main effect on BMI, thus , where SNP1, SNP2 = 0, 1, 2 for three genotypes (GG, GA, and AA) at both loci, the main effect of SNP1 (0.32) and SNP2 (0.09) were assigned according to real data [40], and waist was estimated by an empirical model . Under H1, the interaction effect of two causal SNPs (SNP1 and SNP2) on BMI was δ kg/m2, thus (. The range of the interaction effect δ = (0.10, 0.20, 0.30, 0.40, 0.50) was estimated by published data [41]. All simulation was performed by the R “mvtnorm” package available from CRAN (http://cran.r-project.org/).
(3) Under H0, 1,000 simulations given various sample sizes (N = 1000, 2000, 3000, 4000, 5000) were conducted to assess the type I error. Under H1, given δ, we repeated 1, 000 simulations under various sample sizes at two significant levels (α = 0.05, α = 0.01) to assess power of the mPLSPM statistic. The power of the proposed statistic for waist, WHR, and SLT was also estimated at given interaction effect δ under various sample sizes to compare their performance.
(4) To assess the performance of our proposed statistic, we compared it with a PCA-based linear regression model based on the ideas of three published work [20,26,28]. The PCA-based linear regression model was defined as where η denoted the PCs of the three traits (waist, hip, and BMI), represented the PCs for gene 1 and gene 2 respectively, and P,Q are the number of PCs in gene 1 and gene 2 chosen based on the proportion of variation explained. The pre-specified fraction of the total variance was 85% in this study.
Application
Obesity is related to obstruction of food intake and energy balance regulation. The neurocenter in control of the food intake, hunger, and energy balance locates at hypothalamus and brainstem, and involves in a complicated neurochemical regulatory mechanism. The roles of both TMEM18 gene and BDNF gene in the food intake and energy balance as with their association with obesity were shown [42-44]. Here we assess interaction of these two genes on obesity related quantitative traits. The genotype data of TMEM18 (13 SNPs), BDNF (31 SNPs) and phenotype data (waist, hip, BMI) are from GWAS in the EPIC-Norfolk study (N = 2417). The EPIC-Norfolk study is a population-based, ethnically homogeneous, white Europe cohort study of 25,631 residents living in the city of Norwich, United Kingdom, and its surrounding area. Participants were 39–79 years old during the baseline health check between 1993 and 1997. Of these, 2417 individuals had complete genotype data for 2,500,000 SNPs on the whole genome [31,33]. The interaction between TMEM18 and BDNF for waist, hip, BMI, WHR, body shape score 1 (BSS1, latent variable with waist, hip, and BMI as its manifest variables), and body shape score2 (BSS2, latent variable with BMI and WHR as its manifest variables) were detected using our proposed mPLSPM statistic at nominal level of α = 0.05.
Results
Simulation
Type I error rate
We first set out to verify the type I error rates of the mPLSPM statistic. In each simulation, a random sample of N individuals is drawn with N varying from 1000 to 5000 and consider two nominal significance levels, 0.01 and 0.05. For each parameter setting, we evaluate the type I error rate from 1,000 simulations. As shown in Figure 3a and 3b, type I errors of the mPLSPM statistic consistent with the nominal levels as a function of sample sizes.
Figure 3.
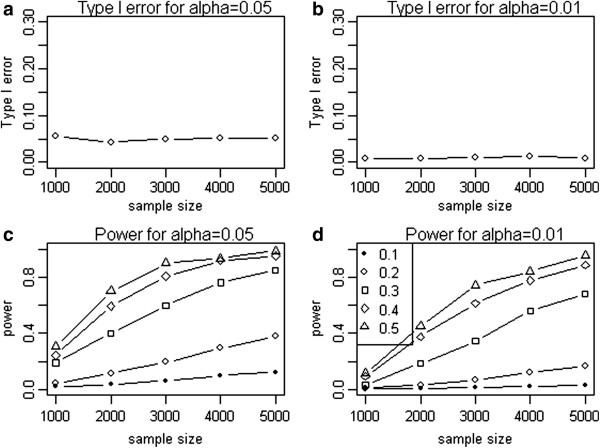
Simulation results of type I error and power for the proposed mPLSPM statistic. Type I error of mPLSPM statistic given different sample sizes under nominal level 0.05 (a) and 0.01 (b); Power of mPLSPM statistic given different interaction effects and different sample sizes under nominal level 0.05 (c) and 0.01 (d).
Statistical power
To evaluate the statistical power of the mPLSPM statistic, we repeat simulations with various interaction effect δ and sample sizes. As expected, it monotonically increases with sample size and interaction effect (δ) under two given nominal levels (α = 0.05, α = 0.01) (Figure 3c and 3d).
Figure 4 shows power of the proposed statistic for waist, WHR, and SLT with given interaction effect δ =0.03 under various sample sizes. The power for body shape score is much higher than that for WHR or waist.
Figure 4.
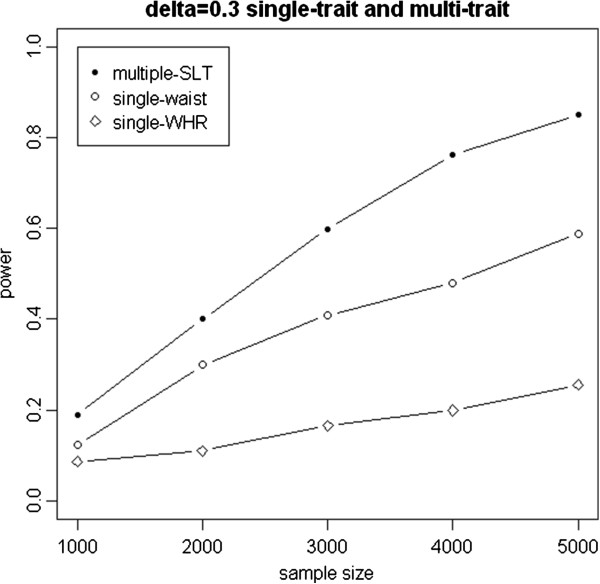
Power of mPLSPM statistic for body shape score, WHR, and waist.
Because of the first PCs of two genes explained a pre-specified fraction of the total variance (>85%), we use the first PC in the PCA-based test when comparing with the mPLSPM statistic. Figure 5 show the performances of the mPLSPM statistic and PCA-based linear regression as a function of different sample sizes and a fixed interaction effectand as a function of different interaction effect sizes and a given sample size of 3000 respectively. It can be seen that power increases monotonically with sample size and interaction effect size. Figure 6 gives their power given different causal SNPs with different minor allele frequencies and LD patterns, with the seven SNPs defined as the causal variant in turn. In all simulated scenarios, PCA-based test, which takes the approach of first collapsing markers in each of the two genes, is less powerful than the mPLSPM statistic (Figure 5, Figure 6), which may be due to a combination of the PCs not fully capturing the underlying interaction signals and the multiple degrees of freedom associated with that test statistic.
Figure 5.
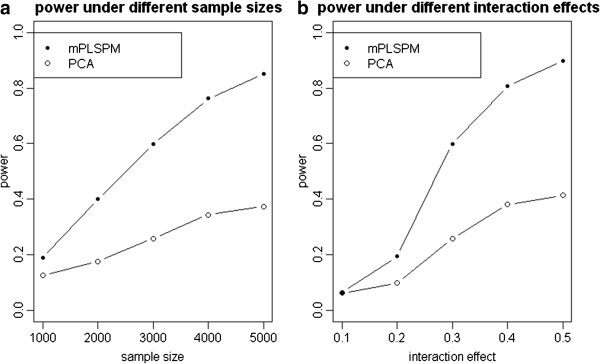
Power of two methods under different sample sizes and different interaction effect. (a) Power of mPLSPM statistic given an interaction effect of 0.3 and different sample sizes. (b) Power of mPLSPM statistic given different interaction effects and a sample size of 3,000.
Figure 6.
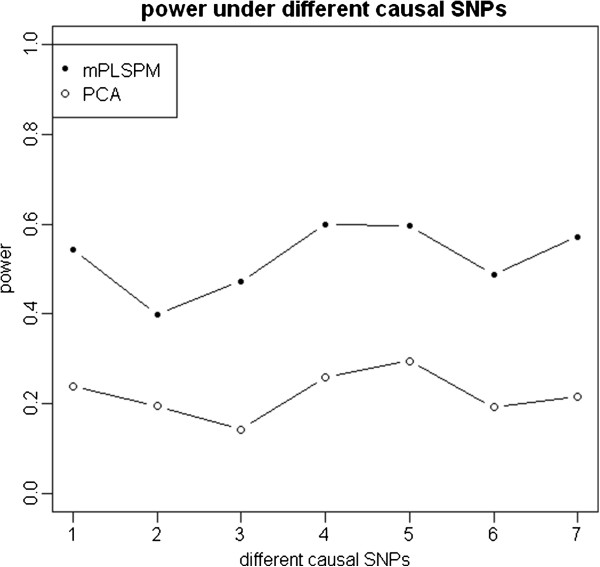
Power of two methods under different causal SNPs. Note: i (i = 1, 2, …, 7) denotes the causal SNPs are the i-th SNP in gene FTO and the i-th SNP in gene NEGR1.
As one reviewer suggested additional simulations under the case that different SNPs affecting different phenotypes have also been conducted. Similar performance can be found (see Additional file 1: Table S2).
Application
We apply above two statistics to real quantitative traits data in the EPIC-Norfolk study. Different kinds of TMEM18-BDNF interactions on obesity using different modified PLSPM under standardization are shown in Figure 7. The interaction effect between the two genes on BSS1 (γ = 0.047), BSS2 (γ = 0.058) and BMI (γ = 0.043) are statistically significant with P = 0.021, P = 0.005, and P = 0.034 respectively (Figures 6d and 7a, 7f) though not for waist (P = 0.113), hip (P = 0.371), and WHR (P = 0.645) (Figure 7b, 7c, and 7e). Also available from Figure 7a, interaction between the two genes on single trait can be obtained as a product of the path coefficient (γ) and response loadings (λ), with 0.047 × 0.440 on BMI, 0.047 × 0.294 on waist, and 0.047 × 0.367 on hip, respectively.
Figure 7.
Different models forTMEM18-BDNF interactions on obesity of the real data. Different kinds of TMEM18-BDNF interactions on BSS1 (a), waist (b), hip (c), BMI (d), WHR (e), and BSS2 (f). Note:*P < 0.05.
PCA-based method has been also applied to detect different kinds of TMEM18-BDNF interactions on obesity. None showed statistical significance when using the first PC of each gene, while only interaction on BSS1 (P = 0.012) and BMI (P = 0.008) are statistically significant when using the first two PCs (explained over 85% of the total variance).
Discussion
Under the hypothesis of thinking quantitatively [4], we have considered a general framework for gene-gene interaction on quantitative phenotype, which includes single SNP-SNP interaction on single trait, gene-gene (each with multiple SNPs) interaction on single trait and gene-gene (each with multiple SNPs) interaction on multiple traits, which was the most reasonable in genetic mechanism for multiple quantitative traits underlying complex diseases. In this paper, we furnished a novel mPLSPM statistic to detect the third of interaction. The mPLSPM statistic should alleviate the burden of single SNP- single trait paradigm which inevitably has high false positive rate due to multiplicity problem, as well as its reduction of power due to the underuse of the LD information [16,17]. Furthermore, the new approach does not have the drawback of gene (multiple SNPs)-single trait paradigm for reasons mentioned earlier, and for most complex diseases (type II diabetes, obesity, disturbance of consciousness), although their quantitative phenotype could in principle be measured, they might not be used for practical reasons (quantitative phenotypes are “really there” but hidden). Our proposed statistic uses the framework of SLT as a quantitative phenotype which was inferred from observed variables (multiple SNPs within gene regions, and multiple traits of a specific complex disease). Through simulation it was shown that the proposed novel mPLSPM statistic to be not only powerful (Figure 3c, 3d) but superior to the PCA-based linear regression method (Figure 5a, 5b, 6).
After applying the novel statistic to the real data, a significant TMEM18-BDNF interaction has been shown for body shape score as a SLT but not for its individual components (waist, hip, and WHR) (Figure 7a-7f), suggesting that the SLT (body shape score) to be more suitable to capture the interaction effect than any single trait. The biological significance in the food intake and energy balance regulation system is in line with the literature, and these two genes have been confirmed to be associated with obesity [42-44].
Our approach shares similarity with traditional SEM, available as either covariance-based or component-based [25,45,46]. However, gene-based multiple SNPs with high LD in genomic data and multiple high correlated traits, the covariance-based SEM suffers from the strong multicollinearity between them. Our use of PLSPM is a component-based with the following advantages: 1) use of reflective measurement model to avoid the impact of high multicollinearity among multiple SNPs, and among multiple traits; 2) as a “soft modeling” approach (very few distribution assumptions, variables can be numerical, ordinal or nominal, and no need for normality assumptions) suitable for any genetic model (additive, recessive, dominant, etc.) [23,24,47]. However, the usual PLSPM cannot handle the interaction between latent variables straightforwardly, the modified PLSPM has a product term of combined multiple SNPs effect within two genes (gene A and gene B).
A reviewer has also indicated that another way to test interaction would be to add a new latent variable for all the pair-wised SNP × SNP interactions to the path modeling and test whether the path coefficient from this interaction latent variable to the latent trait variable is significant [48]. We compared this method with our proposed statistic, and results showed they have similar performance (see Additional file1: Table S1). However, when the number of SNPs is large, there will be so many SNP × SNP terms and undoubtedly bringing us higher computation burden. Our method seems more practical in real data analysis. It is worth mentioning that our proposed method should only be used for testing the interaction, but not for detecting main effect. Testing multiple-traits may only be superior if pleiotropic SNPs and genetic related traits exist, and when the number of traits is large or the correlation (or LD) structure among the traits is small, the power of our statistic will decrease.
A possible drawback of the proposed approach is the computing time spending on bootstrap test used to evaluate the standard deviation of path coefficients. Ideally, a parametric statistic can be developed in the near future. Our findings on the interaction also call for replications by other studies.
Conclusions
The proposed novel mPLSPM statistic is a valid and powerful gene-based method for detecting gene-gene interaction on multiple quantitative phenotypes. Further work is needed to make its use in GWAS more practical.
Abbreviations
mPLSPM: modified Partial Least Squares Path Modeling; SLT: Synthetically latent trait.
Competing interests
The authors declare that they have no competing interests.
Authors’ contributions
FYL, JHZ, ZSY, XSZ, JDJ and FZX conceptualized the study, acquired and analyzed the data and prepared for the manuscript. All authors approved the final manuscript.
Supplementary Material
Introduction for Partial least squares path model and some additional results. The first part is an introduction for PLSPM, Additional file 1: Figures S2-S5 and Tables S1-S2 are some additional results which the reviewers indicated us to add.
Contributor Information
Fangyu Li, Email: xinye506@163.com.
Jinghua Zhao, Email: JingHua.Zhao@mrc-epid.cam.ac.uk.
Zhongshang Yuan, Email: yuanzhongshang@sdu.edu.cn.
Xiaoshuai Zhang, Email: zhxiaoshuai@gmail.com.
Jiadong Ji, Email: jjdjijiadong@163.com.
Fuzhong Xue, Email: xuefzh@sdu.edu.cn.
Acknowledgments
This work was supported by grants from National Natural Science Foundation of China (31071155). The EPIC-Norfolk study is supported by research programmer grant from Cancer Research UK and the Medical Research Council. Part of the work was done by FX during his visit to the MRC Epidemiology Unit.
References
- Stranger BE SE, Raj T. Progress and Promise of Genome-Wide Association Studies for Human Complex Trait Genetics. Genetics. 2011;187:367–383. doi: 10.1534/genetics.110.120907. [DOI] [PMC free article] [PubMed] [Google Scholar]
- Zhang Y, Liu JS. Bayesian inference of epistatic interactions in case–control studies. Nat Genet. 2007;39(9):1167–1173. doi: 10.1038/ng2110. [DOI] [PubMed] [Google Scholar]
- Gayan J, Gonzalez-Perez A, Bermudo F, Saez ME, Royo JL, Quintas A, Galan JJ, Moron FJ, Ramirez-Lorca R, Real LM. et al. A method for detecting epistasis in genome-wide studies using case–control multi-locus association analysis. Bmc Genomics. 2008;9:360. doi: 10.1186/1471-2164-9-360. [DOI] [PMC free article] [PubMed] [Google Scholar]
- Plomin R, Haworth CMA, Davis OSP. Common disorders are quantitative traits. Nat Rev Genet. 2009;10(12):872–878. doi: 10.1038/nrg2670. [DOI] [PubMed] [Google Scholar]
- Rowe NGMP, Cumming RG, Wans JJ. Diabetes, fasting blood glucose and age-related cataract: the Blue Mountains Eye Study. Ophthalmic Epidemiol. 2000;7:103–114. [PubMed] [Google Scholar]
- RA F. The correlation between relatives on the supposition of Mendelian inheritance. Am J Hum Genet. 1968;20(4):402–403. [Google Scholar]
- Donahue RP, Abbott RD. Central obesity and coronary heart disease in men. Lancet. 1987;2(8569):1215. doi: 10.1016/s0140-6736(87)91357-2. [DOI] [PubMed] [Google Scholar]
- Ducimetiere P, Richard J, Cambien F. The pattern of subcutaneous fat distribution in middle-aged men and the risk of coronary heart disease: the Paris Prospective Study. Int J Obes. 1986;10(3):229–240. [PubMed] [Google Scholar]
- Bjorntorp P. Abdominal obesity and the development of noninsulin-dependent diabetes mellitus. Diabetes Metab Rev. 1988;4(6):615–622. doi: 10.1002/dmr.5610040607. [DOI] [PubMed] [Google Scholar]
- Yusuf S, Hawken S, Ounpuu S, Bautista L, Franzosi MG, Commerford P, Lang CC, Rumboldt Z, Onen CL, Liu LS. et al. Obesity and the risk of myocardial infarction in 27,000 participants from 52 countries: a case–control study. Lancet. 2005;366(9497):1640–1649. doi: 10.1016/S0140-6736(05)67663-5. [DOI] [PubMed] [Google Scholar]
- Wells J. BMI compared with 3-dimensional bodyshape: the UK National Sizing Survey. Am J Clin Nutr. 2007;85:7. doi: 10.1093/ajcn/85.2.419. [DOI] [PubMed] [Google Scholar]
- Pare G, Cook NR, Ridker PM, Chasman DI. On the Use of Variance per Genotype as a Tool to Identify Quantitative Trait Interaction Effects: A Report from the Women's Genome Health Study. Plos Genetics. 2010;6(6):e1000981. doi: 10.1371/journal.pgen.1000981. [DOI] [PMC free article] [PubMed] [Google Scholar]
- Li M, Ye C, Fu W, Elston RC, Lu Q. Detecting Genetic Interactions for Quantitative Traits With U-Statistics. Genet Epidemiol. 2011;35(6):457–468. doi: 10.1002/gepi.20594. [DOI] [PMC free article] [PubMed] [Google Scholar]
- Culverhouse R, Suarez BK, Lin J, Reich T. A perspective on epistasis: Limits of models displaying no main effect. Am J Hum Genet. 2002;70(2):461–471. doi: 10.1086/338759. [DOI] [PMC free article] [PubMed] [Google Scholar]
- Moore JH, Hahn LW, Bass M, Martin ER. Detection of gene-gene interactions in general pedigrees. Am J Hum Genet. 2003;73(5):606. [Google Scholar]
- Beyene J, Tritchler D, Asimit JL, Hamid JS. Gene- or Region-Based Analysis of Genome-Wide Association Studies. Genet Epidemiol. 2009;33:S105–S110. doi: 10.1002/gepi.20481. [DOI] [PMC free article] [PubMed] [Google Scholar]
- Buil A, Martinez-Perez A, Perera-Lluna A, Rib L, Caminal P, Soria JM. A new gene-based association test for genome-wide association studies. BMC Proc. 2009;3Suppl 7:S130. doi: 10.1186/1753-6561-3-s7-s130. [DOI] [PMC free article] [PubMed] [Google Scholar]
- Li M, Wang K, Grant SFA, Hakonarson H, Li C. ATOM: a powerful gene-based association test by combining optimally weighted markers. Bioinformatics. 2008;25(4):497–503. doi: 10.1093/bioinformatics/btn641. [DOI] [PMC free article] [PubMed] [Google Scholar]
- He J, Wang K, Edmondson AC, Rader DJ, Li C, Li M. Gene-based interaction analysis by incorporating external linkage disequilibrium information. Eur J Hum Genet. 2010;19(2):164–172. doi: 10.1038/ejhg.2010.164. [DOI] [PMC free article] [PubMed] [Google Scholar]
- Li S, Cui Y. Gene-centric gene–gene interaction: a model-based kernel machine method. Ann Appl Stat. 2012;6(3):1134–1161. doi: 10.1214/12-AOAS545. [DOI] [Google Scholar]
- Ma L, Andrew GC, Alon K. Gene-Based Testing of Interactions in Association Studies of Quantitative Traits. Plos Genetics. 2012;9(2):e1003321. doi: 10.1371/journal.pgen.1003321. [DOI] [PMC free article] [PubMed] [Google Scholar]
- Rajapakse I, Perlman MD, Martin PJ, Hansen JA, Kooperberg C. Multivariate Detection of Gene-Gene Interactions. Genet Epidemiol. 2012;36(6):622–630. doi: 10.1002/gepi.21656. [DOI] [PMC free article] [PubMed] [Google Scholar]
- Tenenhaus M, Vinzi VE, Chatelin YM, Lauro C. PLS path modeling. Comput Stat Data Anal. 2005;48(1):159–205. doi: 10.1016/j.csda.2004.03.005. [DOI] [Google Scholar]
- Esposito VV CW, Henseler J, Wang H. Handbook of Partial Least Squares: Concepts, Methdos and Applications. Berlin Heidelberg: Springer; 2010. [Google Scholar]
- Lohmöller J. Latent variable path modeling with partial least squares. Heidelberg: Physica-Verlag Heidelberg; 1989. [Google Scholar]
- Wang KAD. A principal components regression approach to multilocus genetic association studies. Genet Epidemiol. 2008;32:108–118. doi: 10.1002/gepi.20266. [DOI] [PubMed] [Google Scholar]
- Gauderman WJ, Murcray C, Gilliland F, Conti DV. Testing association between disease and multiple SNPs in a candidate gene. Genet Epidemiol. 2007;31:383–395. doi: 10.1002/gepi.20219. [DOI] [PubMed] [Google Scholar]
- Klei L, Luca D, Devlin B, Roeder K. Pleiotropy and principal components of heritability combine to increase power for association analysis. Genet Epidemiol. 2008;32(1):9–19. doi: 10.1002/gepi.20257. [DOI] [PubMed] [Google Scholar]
- Markus MT, Groenen PJF. An introduction to the bootstrap. Psychometrika. 1998;63(1):97–101. [Google Scholar]
- Linden A, Adams JL, Roberts N. Evaluating disease management program effectiveness - An introduction to the bootstrap technique. Dis Manage Health Outcomes. 2005;13:159–167. doi: 10.2165/00115677-200513030-00002. [DOI] [Google Scholar]
- Xue F, Li S, Luan J, Yuan Z, Luben RN, Khaw K-T, Wareham NJ, Loos RJF, Zhao JH. A Latent Variable Partial Least Squares Path Modeling Approach to Regional Association and Polygenic Effect with Applications to a Human Obesity Study. Plos One. 2012;7(2):e31927. doi: 10.1371/journal.pone.0031927. [DOI] [PMC free article] [PubMed] [Google Scholar]
- Li J, Chen Y. Generating samples for association studies based on HapMap data. Bmc Bioinformatics. 2008;9:44. doi: 10.1186/1471-2105-9-44. [DOI] [PMC free article] [PubMed] [Google Scholar]
- Riboli E, Kaaks R. The EPIC project: Rationale and study design. Int J Epidemiol. 1997;26(SUPPL. 1):S6–S14. doi: 10.1093/ije/26.suppl_1.s6. [DOI] [PubMed] [Google Scholar]
- Day N, Oakes S, Luben R, Khaw KT, Bingham S, Welch A, Wareham N. EPIC-Norfolk: study design and characteristics of the cohort. Br J Cancer. 1999;80:95–103. [PubMed] [Google Scholar]
- Rimm AA, Hartz AJ, Fischer ME. A weight shape index for assessing risk of disease in 44,820 women. J Clin Epidemiol. 1988;41(5):459–465. doi: 10.1016/0895-4356(88)90047-9. [DOI] [PubMed] [Google Scholar]
- Walsh P. Research profile. The apple shape. Causes and effects. Diabetes Forecast. 2004;57(2):73–75. [PubMed] [Google Scholar]
- Walton C, Lees B, Crook D, Worthington M, Godsland IF, Stevenson JC. Body fat distribution, rather than overall adiposity, influences serum lipids and lipoproteins in healthy men independently of age. Am J Med. 1995;99(5):459–464. doi: 10.1016/S0002-9343(99)80220-4. [DOI] [PubMed] [Google Scholar]
- DALTON M, CAMERON AJ, ZIMMET PZ, SHAW JE, JOLLEY D, DUNSTAN DW, WELBORN TA. Waist circumference, waist-hip ratio and body mass index and their correlation with cardiovascular disease risk factors in Australian adults. J Intern Med. 2003;254:555–563. doi: 10.1111/j.1365-2796.2003.01229.x. [DOI] [PubMed] [Google Scholar]
- Peter T, Peter T, Katzmarzyk SRS, Wei C, Malina RM, Claude B, Berenson GS. Body Mass Index, Waist Circumference, and Clustering of Cardiovascular Disease Risk Factors in a Biracial Sample of Children and Adolescents. Pediatrics. 2004;114:e198–e205. doi: 10.1542/peds.114.2.e198. [DOI] [PubMed] [Google Scholar]
- Li S, Zhao JH, Luan J, Luben RN, Rodwell SA, Khaw K-T, Ong KK, Wareham NJ, Loos RJF. Cumulative effects and predictive value of common obesity-susceptibility variants identified by genome-wide association studies. Am J Clin Nutr. 2010;91(1):184–190. doi: 10.3945/ajcn.2009.28403. [DOI] [PubMed] [Google Scholar]
- Bhattacharya K, McCarthy MI, Morris AP. Rapid testing of gene-gene interactions in genome-wide association studies of binary and quantitative phenotypes. Genet Epidemiol. 2011;35(8):800–808. doi: 10.1002/gepi.20629. [DOI] [PMC free article] [PubMed] [Google Scholar]
- Speliotes E. Association analyses of 249,796 individuals reveal 18 new loci associated with body mass index. Nat Genet. 2010;42:937–948. doi: 10.1038/ng.686. [DOI] [PMC free article] [PubMed] [Google Scholar]
- Obici S. Minireview: Molecular targets for obesity therapy in the brain. Endocrinology. 2009;150:2512–2517. doi: 10.1210/en.2009-0409. [DOI] [PubMed] [Google Scholar]
- Walley A. The genetic contribution to non-syndromic human obesity. Nat Rev Genet. 2009;10:431–442. doi: 10.1038/nrg2594. [DOI] [PubMed] [Google Scholar]
- Henseler JR. The Use of Partial Least Squares Path Modeling in International Marketing. Advin Intern Marketing. 2009;20:277–319. [Google Scholar]
- Fornell C. In: A second generation of multivariate analysis. Fornell C, editor. New York: Praeger; 1982. A comparative analysis of two structural equation models: LISREL and PLS applied to market data. 1:289–324. [Google Scholar]
- Chin W. In: Modern methods for business research. Marcoulides GA, editor. Lawrence Erlbaum; 1998. The partial least squares approach in structural equation modeling. [Google Scholar]
- Fuzhong LPH, Duncan TE, Duncan SC, Alan A, Shawn B. Approaches to Testing Interaction Effects Using Structural Equation Modeling Methodology. Multivar Behav Res. 1998;33(1):1–39. doi: 10.1207/s15327906mbr3301_1. [DOI] [PubMed] [Google Scholar]
Associated Data
This section collects any data citations, data availability statements, or supplementary materials included in this article.
Supplementary Materials
Introduction for Partial least squares path model and some additional results. The first part is an introduction for PLSPM, Additional file 1: Figures S2-S5 and Tables S1-S2 are some additional results which the reviewers indicated us to add.


