

Abstract
Obesity is a risk factor for many chronic diseases, including glucose intolerance, lipid disorders, hypertension, and coronary heart disease. Even though the body-mass index (BMI) is a heterogeneous phenotype reflecting the amount of fat, lean mass, and body build, several studies have provided evidence of one or two major loci contributing to the variation in this complex trait. We sought to identify loci with potential influence on BMI in the data obtained from National Heart, Lung, and Blood Institute Family Heart Study. Two complementary samples were studied: (a) 1,184 subjects in 317 sibships, with 243 markers typed by the Utah Molecular Genetics Laboratory (UMGL) and (b) 3,027 subjects distributed among 401 three-generation families, with 404 markers typed by the Mammalian Genotyping Service (MGS). A genome scan using a variance-components–based linkage approach was performed for each sample, as well as for the combined sample, in which the markers from each analysis were placed on a common genetic map. There was strong evidence for linkage on chromosome 7q32.3 in each sample: the maximum multipoint LOD scores were 4.7 (P<10-5) at marker GATA43C11 and 3.2 (P=.00007) at marker D7S1804, for the MGS and UMGL samples, respectively. The linkage result is replicated by the consistent evidence from these two complementary subsets. Furthermore, the evidence for linkage was maintained in the combined sample, with a LOD score of 4.9 (P<10-5) for both markers, which map to the same location. This signal is very near the published location for the leptin gene, which is the most prominent candidate gene in this region. For the combined-sample analysis, evidence of linkage was also found on chromosome 13q14, with D13S257 (LOD score 3.2, P=.00006), and other, weaker signals (LOD scores 1.5–1.9) were found on chromosomes 1, 2, 3, 5, 6, 14, and 15.
Introduction
In Western societies, the prevalence of obesity (MIM 601665) has been increasing steadily in recent years (Flegal et al. 1998; Kumanyika 2001; Visscher and Seidell 2001), and it is clearly associated with significant morbidity and mortality, including glucose intolerance, lipid disorders, hypertension (MIM 145500), and coronary heart disease (CHD). It is known that obesity-related traits, including the body-mass index (BMI), are influenced by both genetic and environmental factors (see Bouchard et al. 1998). BMI is very easy to measure reliably and accurately in large epidemiological studies and is highly correlated with total fat mass, with the correlation being ∼0.8–0.9 in adults (Borecki et al. 1991). The majority of studies have estimated the heritability of the BMI to be 40%–55% (see Borecki et al. 1998b; Bouchard et al. 1998; Rice et al. 1999), but estimates >80% have been found in twin studies. The underlying mode of inheritance is complex; however, segregation analyses have provided evidence for a recessive major gene that accounts for 20%–40% of the variance, with an additional 34%–42% of the variance attributed to a multifactorial component (e.g., Price et al. 1990; Province et al. 1990; Moll et al. 1991). Analyses using two-locus models in independent studies (Hasstedt et al. 1997; Borecki et al. 1998a) have revealed evidence for two recessive loci that together account for ∼64%–68% of the variance. Therefore, it appears that the prospects for gene discovery are promising, even though there is evidence that some genotypes may interact with age and sex (Borecki et al. 1993).
The overall aim of the National Heart, Lung, and Blood Institute Family Heart Study (FHS) is to investigate the genetic and nongenetic determinants of CHD, preclinical atherosclerosis, and cardiovascular risk factors. BMI is an informative and useful indicator of fatness, and a high BMI has been validated as an independent risk factor for CHD (van Itallie and Abraham 1985). We have conducted an autosomal genome scan for BMI through use of a variance-components linkage analysis in families participating in the FHS, to identify regions that are likely to harbor quantitative-trait loci (QTLs).
Material and Methods
Study Design
The FHS is a multicenter, population-based genetic epidemiological study that includes the Framingham Heart Study (Framingham, MA), the Utah Health Family Tree Study (Salt Lake City, UT), and the Atherosclerosis Risk in Communities Study (Minneapolis, MN and Forsyth County, NC). Phase I of the project was based on the characterization of family histories of CHD and related conditions, using the age at diagnosis and the disease status of siblings and parents. Questionnaires were mailed to 14,592 potential probands; from this group, a sample consisting of 2,000 randomly ascertained participants and 2,000 people with a family history of CHD was selected. Family-risk scores were calculated for each ascertained family, through the ratio of observed numbers of CHD events within the family to the numbers expected on the basis of the age and sex of each individual. In phase II, the families of probands were selected, including the proband, their parents, and all siblings, spouses, and children. Both a random sample of 588 families and a nonrandom sample of 656 families with the highest family-risk scores were clinically examined through use of electrocardiograms, carotid artery ultrasound scans, and spirometry, as well as through measurements of body size, blood pressure, lipids, lipoproteins, hemostatic factors, insulin, glucose, and routine blood chemistries. Additional biochemical and molecular markers are being studied (in phase III) on selected participants. For additional information about our study design, see the report by Higgins et al. (1996).
Phenotype and Adjustments
BMI was calculated as weight (in kg) divided by the square of height (in meters) and was adjusted for covariates prior to linkage analysis. For the estimation of the regression model, data from all subjects were used, even though only two subsets, as described below, were genotyped for the linkage analysis.
The adjustments were performed separately, by sex, in three age ranges (25–44 years, 45–64 years, and ⩾65 years), using cubic polynomial age and clinical center and retaining the terms in the stepwise regression analysis that were significant at the 5% level. Extreme outliers (BMI >3 SD from the mean) were set aside, temporarily, for the adjustments. Phenotypes were further adjusted for the effects of age and center in the variance (heteroscedasticity), by regressing the squared residual on the same terms as described above. The final phenotypes were computed for all individuals, using the best regression models (residual from mean regression divided by the predicted score from the variance regression) and standardizing to 0 mean and unit variance. The resulting distribution was neither appreciably skewed nor kurtotic.
Data and Genotyping
Linkage analyses were performed on the two complementary samples of white subjects in the FHS, as well as for the combined sample. The first sample included 1,184 subjects in 317 sibships, which includes all validated sib pairs with CHD and a sample of sibships selected for high individual risk scores for CHD (see the report by Higgins et al. [1996]). An additional random sample of unrelated individuals was typed to estimate the population allele frequencies at the marker loci (N=200). A coarse genome scan was performed with 243 markers, with an average intermarker distance of ∼20 cM. The development of the markers and genotyping were performed by the Utah Molecular Genetics Laboratory (UMGL); details can be found in reports by the Utah Marker Development Group (1995) and Broman et al. (1998).
The second sample comprised 3,027 subjects from 401 of the largest and most-informative three-generation pedigrees. The ascertainment of this sample focused solely on pedigree size rather than on extreme values of any phenotype(s). The genotypes for these subjects were assessed by the Mammalian Genotyping Service (MGS) and were based on analysis of 404 markers with an average intermarker distance of ∼8.5 cM. The markers and map used were from the Marshfield Medical Research Foundation (screening set 10) (Center for Medical Genetics Web site). Power studies were performed for this large sample by simulation using the computer program SEGPOWER, developed by M. Province (Borecki et al. 1999). We determined that the data have adequate power (>80%) to detect a QTL accounting for as little as ∼9% of the trait variability, using variance-components linkage methods with α=0.05.
The combined analysis was performed using subjects from both samples. The construction of the combined linkage map was primarily based on the existing Marshfield Medical Research Foundation map, with the location of novel markers being estimated in reference to anchor markers present on both maps. Map locations (in cM) are based on sex-averaged maps from the Marshfield Medical Research Foundation. The corresponding cytogenetic locations were ascertained from the Genetic Location Database at the University of Southampton and the Human Genome Working Draft at the University of California, Santa Cruz (Genetic Location Database Web site; Human Genome Working Draft Web site). The combined sample included a total of 3,407 subjects in 536 pedigrees (the equivalent of 4,914 sib pairs), in which 804 subjects were part of both the MGS and the Utah lab samples and were genotyped by both laboratories.
To insure the integrity of the genotype data, several quality control measures were employed. All markers were used to estimate the degree of genetic relationship for all pairs of individuals within a pedigree, to verify the reported relationships. The estimated average allele sharing over all markers was compared under several alternative hypotheses, including unrelated, parent-offspring, half-sibling, and full-sibling relationships, through use of the program ASPEX (Hauser et al. 1996; Hinds and Risch 1998; available from the ASPEX ftp site). Self-reported relationships were corrected on the basis of the genetic data in instances when there was significant statistical support for an alternative relationship (i.e., LOD score >3). After verification of relationships, further inconsistencies due to non-Mendelian inheritance were identified for each marker, using the program package PEDSYS (B. Dyke; Southwest Foundation for Biomedical Research Web site). Intact pedigrees are analyzed, which provides additional information for the identification of misinheritances in instances when key individuals are not genotyped. Provided that the reported relationships could be verified by ASPEX, the genotypes of single individuals with an inconsistent marker genotype were set to missing for that marker only. If there was any ambiguity about which subjects may have the incorrect genotype leading to the inconsistency, then the entire nuclear family was deleted from the analysis for that marker.
Statistical Analysis
Linkage analysis was performed using a variance-components approach as implemented in the computer program SEGPATH (Province et al., in press). This method is an extension of a path-analysis model of family resemblance, in which correlations among family members are modeled as a function of the allele sharing at a marker locus, taking into account residual familial correlations, including genetic and common environmental effects. The proportion of alleles that are identical by descent were estimated by MAPMAKER/SIBS (Kruglyak and Lander 1995), using a multipoint approach. The heritabilities due to the trait locus and to the pseudopolygenic component are denoted by h2g and h2r, respectively. Spouse and residual sibling correlations are also estimated. The null hypothesis (in which the effect of the test locus is equal to 0—i.e., h2g=0) and the alternative hypothesis (in which the effect of the test locus is unconstrained—i.e.,  ) are estimated by maximum likelihood. The difference in minus twice the log likelihoods (-2lnL) of the two hypotheses produces a likelihood-ratio test that is asymptotically distributed as a 1/2:1/2 mixture of χ2 with 1 df and a point mass at 0. The corresponding traditional LOD scores can be calculated by dividing the χ2 value by
  . The data were analyzed using no ascertainment correction, largely because the ascertainment was so complex that there is no single adequate correction. In particular, the MGS sample was largely chosen on the basis of large pedigree size, without regard to phenotype, although approximately half of the families came from the nonrandom pool. These families were included in the study because of a high familial risk and occurrence of cardiovascular disease and not because the disease status of any specific individual(s) led to the ascertainment of the families. As a practical matter, it seemed preferable to make no adjustment for ascertainment rather than to employ an inadequate—and possibly misleading—correction.
Results
The means, standard deviations, and range intervals for age and the unadjusted BMI are given in table 1 for the complete FHS data set, as well as for the subsets used in the genome scan (i.e., the UMGL and MGS samples). Age and clinical center were significant predictors of BMI but accounted for a modest percentage (<9%) of the phenotypic variance in BMI.
Table 1.
Statistics for Unadjusted BMI in FHS Data and for the Combined, UMGL, and MGS Samples
|
Male |
Female |
|||||
| Sample and Subsetof Sample | No. ofIndividuals | Mean±SD | Range | No. ofIndividuals | Mean±SD | Range |
| Entire FHS: | ||||||
| Age | 2,762 | 52.3±14.1 | 25.0–91.0 | 3,213 | 52.9±14.0 | 25.2–93.6 |
| BMI | 2,450 | 27.8±4.5 | 16.0–63.6 | 2,882 | 27.5±6.3 | 16.0–62.4 |
| UMGL: | ||||||
| Age | 634 | 58.1±11.0 | 25.2–80.6 | 663 | 57.2±10.4 | 25.2–88.2 |
| BMI | 568 | 28.1±4.3 | 18.1–46.2 | 601 | 28.9±6.5 | 16.6–51.7 |
| MGS: | ||||||
| Age | 1,403 | 53.0±14.0 | 25.2–91.0 | 1,610 | 53.9±13.4 | 25.2–89.1 |
| BMI | 1,248 | 28.0±4.6 | 17.9–63.6 | 1,445 | 27.3±6.1 | 16.5–55.1 |
| Combined (UMGL + MGS): | ||||||
| Age | 1,638 | 53.9±13.6 | 25.2–91.0 | 1,828 | 54.3±13.0 | 25.2–89.1 |
| BMI | 1,462 | 28.0±4.6 | 17.9–63.6 | 1,649 | 27.5±6.1 | 16.5–55.1 |
Figure 1 shows the results for the autosomal genome scan in the combined sample, as well as in the UMGL and MGS samples. The strongest result from this analysis was the evidence for linkage on chromosome 7q32.3 (fig. 2). The maximum LOD score occurred at 137 cM, for the UMGL and MGS samples separately, as well as for the combined sample on the composite chromosome 7 map. For the MGS subset, the maximum LOD score was 4.7 (P<10-5) at marker GATA43C11, whereas, for the UMGL sample, the maximum LOD score was 3.2 (P=.00007) at marker D7S1804; both of these markers (GATA43C11 and D7S1804) map to the same location (7q32.3). Moreover, the combined sample augmented the evidence of linkage, with a slightly higher LOD score of 4.9 (P<10-5) at the same location.
Figure 1.
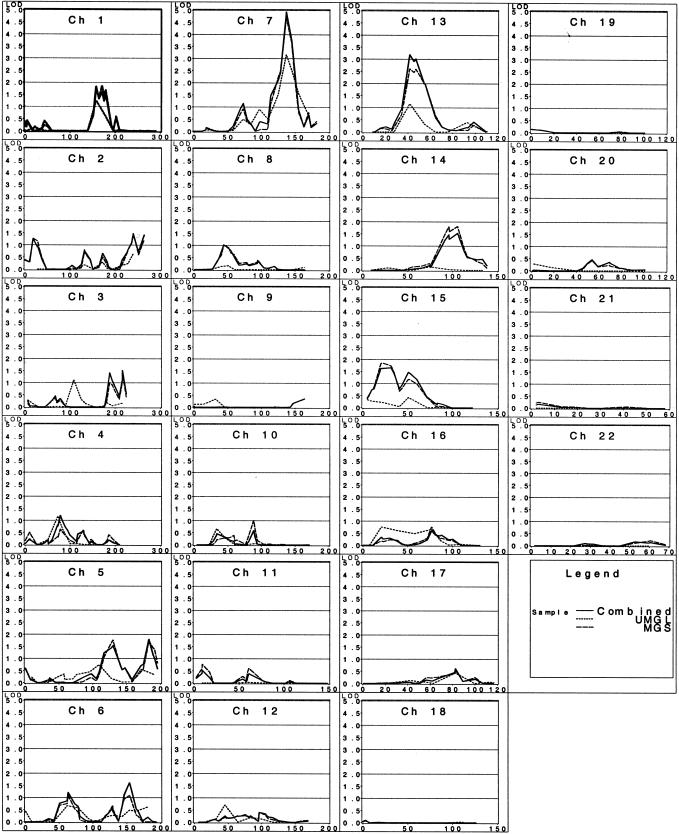
Results of the autosomal genome scan for BMI in the combined, UMGL, and MGS samples. The X-axis represents map distance in centimorgans.
Figure 2.

Overview of the multipoint linkage results for chromosomes 7 and 13 for BMI in the combined, UMGL, and MGS samples. The X-axis represents map distance in centimorgans.
In addition, evidence for linkage was also observed on chromosome 13 (q14) with a maximum multipoint LOD score of 3.2 (P=.00006) at marker D13S257, in the combined sample (table 2). Other weaker but suggestive signals (LOD scores 1.5–1.9) were observed on chromosomes 1 (markers D1S1279, GGAA5F09, and D1S370), 2 (marker D2S1279), 3 (marker D3S2305), 5 (markers GATA62A04 and MFD154), 6 (markers D6S393 and GATA165G02), 14 (marker GGAA21G11), and 15 (markers AFM248VC5, D15S184, and GAAA1C11).
Table 2.
Markers with Evidence for Linkage
| Linkage Evidenceand Chromosomea | Marker | Locationb(cM) | LODScore | P |
| Strong (LOD ⩾2.0): | ||||
| 7: | ||||
| q31.31 | D7S2847 | 125 | 2.1 | .00090 |
| q31.33 | GGAA6D03 | 128 | 2.4 | .00040 |
| q32.3 | GATA43C11 | 137 | 4.9 | .00000 |
| q32.3 | D7S1804 | 137 | 4.9 | .00000 |
| q34 | D7S2560 | 145 | 3.8 | .00002 |
| q34 | GATA32C12 | 150 | 2.3 | .00054 |
| 13: | ||||
| q14 | D13S257 | 42 | 3.2 | .00006 |
| q14 | GATA137C12 | 46 | 2.9 | .00013 |
| q14 | GATA11C08 | 47 | 3.0 | .00010 |
| q21.33 | D13S258 | 55 | 2.0 | .00124 |
| q21-22 | GATA64F08 | 55 | 2.0 | .00121 |
| Weak (LOD 1.5–1.9): | ||||
| 1: | ||||
| q24.2 | D1S1679 | 158 | 1.8 | .00187 |
| q23-24 | GGAA5F09 | 171 | 1.6 | .00328 |
| q24.3 | D1S370 | 192 | 1.5 | .00408 |
| 2: | ||||
| q37.3 | D2S1279 | 241 | 1.5 | .00482 |
| 3: | ||||
| q29 | D3S2305 | 217 | 1.5 | .00414 |
| 5: | ||||
| q23 | GATA62A04 | 129 | 1.5 | .00394 |
| q35 | MFD154 | 183 | 1.8 | .00202 |
| 6: | ||||
| q24 | D6S393 | 154 | 1.6 | .00321 |
| q24-25 | GATA165G02 | 155 | 1.6 | .00373 |
| 14: | ||||
| q32 | GGAA21G11 | 105 | 1.5 | .00394 |
| 15: | ||||
| q13.3 | AFM248vc5 | 20 | 1.6 | .00302 |
| q13.3 | D15S184 | 22 | 1.6 | .00308 |
| q14 | GAAA1C11 | 31 | 1.7 | .00287 |
Approximate chromosomal locations ascertained from the Genetic Location Database and the Human Genome Project Working Draft.
Locations based on the Marshfield Map, Center for Medical Genetics.
Discussion
Strong linkage evidence for a locus on chromosome 7q32.3, accounting for 28% (±3%) of the variation in BMI, was found and replicated using two complementary samples drawn from the FHS study. Although each of the two complementary samples exhibited linkage to the same location, through use of different marker sets, the evidence was stronger in the combined sample, producing a LOD score of 4.9 (P<10-5). An obvious candidate in this region is the leptin gene (LEP [MIM 164160]), which maps to q31.33. The leptin gene has been implicated in other studies. Evidence for linkage between markers localized in the LEP gene region and various anthropometric measures has been described in Mexican Americans (Duggirala et al. 1996; Bray et al. 1999). Duggirala et al. (1996) reported a LOD score of 3.1 for linkage between a measure of extremity subcutaneous fat and a location <1 cM from the LEP gene, and Bray et al. (1999) found suggestive linkage between the LEP gene and the waist-to-hip ratio (P=.009). In addition, suggestive linkage (P=.008) between a marker near the LEP gene and fat mass, measured by whole-body dual X-ray absorptiometry, was observed in healthy female Australian twins (Lapsys et al. 1997). Further evidence for linkage between the LEP gene and extreme obesity (BMI >35 kg/m2) was reported in French sib pairs (Clément et al. 1996), in white sib pairs from the United States (BMI >40 kg/m2; Reed et al. 1996), and in German children and adolescents (Roth et al. 1997).
Nevertheless, several genome-scan studies have detected no evidence of linkage between obesity or its related traits and the LEP gene (Comuzzie et al. 1997; Hager et al. 1998; Norman et al. 1998; Lee et al. 1999; Mitchell et al. 1999; Ohman et al. 2000; Perola et al. 2001). This discrepancy among linkage results is not unusual for studies of complex phenotypes. Many factors can affect the ability to detect trait loci, including the population studied, the power of the sampling unit, the method of analysis, and, especially, the effect size of the locus. As a consequence, one might expect that a QTL affecting a complex, quantitative trait may not be detected in all studies, since the locus may have a greater effect in some samples than in others. Therefore, the failure to detect linkage with this region in some studies does not decrease our interest in investigating this region further, especially in light of the corroboration from the LEP candidate-gene studies. Furthermore, it is interesting to note that a meta-analysis undertaken by Allison and Heo (1998) demonstrated that, in five published studies, the evidence for linkage to the LEP gene region was extremely strong (P=1.5×10⁻⁵).
Several studies have begun to elucidate the role and action of leptin in the regulation of body fat stores. Leptin is an adipocyte-derived hormone encoded by the LEP gene and has a variety of physiologic roles. It acts as a satiety factor with a receptor located mainly in the hypothalamus, a brain area known to be involved in the regulation of food intake. Leptin can also affect energy expenditure independently of food intake (see Friedman and Halaas 1998). Therefore, it appears that leptin is a powerful factor affecting energy balance.
Other evidence of linkage between obesity conditions and this region close to the LEP gene has been described, for hypertension (Cheng et al. 2000; Rice et al. 2000; Atwood et al. 2001) and diabetes (MIM 222100) (Hanson et al. 1998). Given the correlation between obesity and blood pressure, and the familial clustering of hypertension, glucose intolerance, and dyslipidemia, as seen in the multiple metabolic syndrome, it appears possible that the chromosome 7 locus identified by these studies may have broadly pleiotropic effects. Further investigation of this hypothesis is necessary.
We also report evidence for linkage on chromosome 13q (q14) with a peak LOD score of 3.2 (P=.00006) for D13S257, in the combined sample. At this same chromosomal region, additional evidence for linkage was found, by Knoblauch et al. (2000), between D13S156 (13q21) and BMI (P<.0001), low-density lipoprotein levels (P<.0002), high-density lipoprotein levels (P<.004), and total cholesterol levels (P<.0002), in a DZ twin sample. In addition, Lee et al. (1999) detected weaker evidence of linkage (P=.0245) between percentage of body fat (%BF) and D13S168 (13q14). A potential candidate gene located at the same chromosomal region of marker D13S257 marker was described for obesity-related traits. Polymorphism in the 5-hydroxy-tryptamine receptor gene (5-HTR2A [MIM 182135], located on 13q14) has been shown to be associated with dietary energy and alcohol intake in obese people (Aubert et al. 2000). Serotonin (5-HT) is a key mediator in the control of satiety mechanisms. Serotonin reduces food intake and is probably involved in weight regulation (Leibowitz 1990).
Despite the weaker levels of significance, tentative linkage relationships with esterase D (MIM 133280; on 13q14) (Borecki et al. 1994) were also suggested, for both %BF (P=.033) and the sum of six skin-fold measurements (P=.043), at approximately the same position as our signal on chromosome 13. Thus, these results suggest that a 5-HTR2A–linked gene may have pleiotropic effects on BMI and on these obesity-related traits.
Several other suggestive linkage signals with BMI were also detected. The present suggestion for linkage on chromosome 1q23-24 (LOD scores 1.5–1.8) is in a region containing prominent candidate genes for obesity: the sodium potassium-adenosine triphosphatase a2 (ATP1A2 [MIM 182340]) and b1 (ATP1B1 [MIM 182330]) genes. Significant association between ATP1A2 and both %BF (Dériaz et al. 1994) and respiratory quotient (RQ) (Dériaz et al. 1994; Katzmarzyk et al. 1999), as well as linkage of both ATP1A2 and ATP1B1 with RQ (Dériaz et al. 1994; Katzmarzyk et al. 1999), were detected in the Québec Family Study. RQ is associated with energy balance and substrate use and has thus been implicated as potentially playing a role in the development of obesity. The ATPases are essential and ubiquitous plasma membrane enzymes that are responsible for catalyzing the energy-dependent transport of Na+ and K+ across the cell membrane.
We also observed suggestive linkage with BMI on chromosome 2q37 (P=.0048), comparable to the results reported by Lee et al. (1999) with %BF (P=.0045), indicating a possible QTL for adiposity. However, no plausible candidate gene has yet been identified in this chromosomal region.
Two recent studies have reported linkage with obesity-related traits in the 3q26-27 region, near the location (3q29) of our suggestive signal. Kissebah et al. (2000) found strong linkage evidence on 3q26, for six abdominal obesity- and metabolic-syndrome–related phenotypes (LOD scores 2.37–3.54), including BMI (P=.00005). In addition, Vionnet et al. (2000) detected evidence for linkage with diabetes or glucose intolerance diagnosed at age <45 years in 92 affected sib pairs, on 3q27 (P=.000004). This chromosomal region contains several potentially interesting genes, including the genes coding for somatostatin (MIM 182450), apolipoprotein-D (apo-D [MIM 107740]), inhibitor 2 of the synthase-activating enzyme, type 1 protein phosphatase I-2 (MIM 601792), the bifunctional enzyme (with enoyl-CoA-hydratase and 3-hydroxyacyl-CoA dehydrogenase activity [MIM 261515]), glucose transporter (MIM 138160) and the adipose-tissue–secreted protein adiponectin (adipose most abundant gene transcript 1 [MIM 605441]). Although these candidate genes each are thought to have important roles in metabolism, signaling, and obesity-related diseases, specific associations with adiposity have not been demonstrated. The exceptions are adiponectin and apo-D. Plasma adiponectin has been observed to be significantly lower in obese subjects than in nonobese subjects (Arita et al. 1999), as well as in patients with coronary artery disease compared with unaffected subjects matched for age and BMI (Ouchi et al. 1999). An association between alleles of the apo-D locus and obesity has been reported—that is, genotype frequency differences were found between obese subjects and slim control individuals, and an association was also reported between the apo-D genotype and fasting insulin in white British obese subjects (Vijayaraghavan et al. 1994). Evidence of a QTL affecting cholesterol concentrations in small LDL particles was also obtained from a genome scan in approximately the same region as the apo-D gene (LOD score 4.11; Rainwater et al. 1999).
Plausible candidate genes related to obesity could not be identified in the regions 5q23 and 5q35, where we observed suggestive evidence of linkage with BMI. However, some studies have shown linkage in other regions on chromosome 5q related to obesity—namely, LIM/homeodomain islet-1 (MIM 600366, on 5q11) (Clément et al 1999), glucocorticoid receptor gene (MIM 138040, on 5q31) (Rosmond et al. 2000), and β2-adrenergic receptor (MIM 109690, on 5q32) (Large et al. 1997; Ishiyama-Shigemoto et al. 1999; Meirhaeghe et al. 1999; Yamada et al. 1999).
Corroborating evidence for linkage or the existence of plausible obesity-related candidate genes have not been reported in the 6q24-25 region. However, the estrogen receptor gene (ESR1 [MIM 133430], on 6q25) maps to this region. Lorentzon et al. (1999) observed that ESR1 was related to bone density and height during late puberty in young men, and linkage (LOD score 3.85) was found by Hirschhorn et al. (2001) between a marker close to ESR1 (6q25) and height in adults of both sexes. Furthermore, Rainwater et al. (1999) reported linkage between ESR1 and LDL-3 cholesterol (LOD score 2.92, at 6q25). Although age- and sex-adjusted BMI are not correlated with height in the present study, a relationship between heaviness and height, as well as between heaviness and lipoprotein cholesterol concentrations, are tenable. Thus, it would be interesting to investigate whether ESR1 has a potential role in obesity. Likewise, there are no previous suggestions of linkage between chromosomes 14q32 and 15q13-q14 and BMI or related phenotypes. Further investigations should be performed to determine whether these linkage results represent false positives or really point to regions containing genes contributing to obesity.
The robustness of these analyses to various factors were certainly a concern to us. To address the question of comparability of linkage results obtained using different analytic strategies, we conducted a quality control (QC) experiment in which key linkage findings from each of the four FHS centers were verified by an independent investigator at another center, using their own preferred methodology. Among the linkage approaches represented in this exercise were SEGPATH, SOLAR, GENEHUNTER2, and SAGE; we focused only on quantitative phenotypes, using the respective implementations of variance-components methods available in each of the packages. It was interesting and gratifying to note that all of these methods yielded comparable results, suggesting that our reported linkage signals are not analysis-model dependent. A detailed report of our QC experiment can be found at the Family Heart Study Web site.
Two other factors potentially affecting our analyses are (1) possible misspecification of marker allele frequencies and (2) absence of an ascertainment correction. Insofar as the former is concerned, simulation studies and empirical analyses of real data have demonstrated that linkage analyses of quantitative traits, particularly those using variance-components methods, are quite robust to variations in marker-allele frequencies (Borecki and Province 1999; Mandal et al. 2000). Perhaps the more serious concern arises in regard to the lack of an ascertainment correction. However, a recently published relevant study by de Andrade and Amos (2000) showed that the failure to correct for ascertainment in variance-components linkage analysis affected only the estimates of residual heritability and of environmental component of variance and had little impact on the linked-trait gene component of variance (and, therefore, on the linkage inference). The greater liability may be that not correcting for ascertainment can lead to a loss of power to detect linked loci (Comuzzie and Williams 1999); thus, it is possible that the support for the linkage hypothesis that we see is conservative.
In conclusion, these results suggest that at least two QTLs influence BMI in the FHS data. We obtained strong, replicated evidence for a QTL on chromosome 7q31-q34, with leptin being a prominent candidate gene in this region because of its central role in an adiposity-sensing pathway and its physiological effects on energy balance. Another region potentially harboring a QTL was identified on chromosome 13q14, with corroborative linkage evidence from several other studies. However, additional investigation will be necessary to identify and test plausible candidate genes in this region. Other suggestive linkage signals were found on chromosomes 1q23-24, 2q37, 3q29, 5 (q23 and q35), 6q24-25, 14q32, and 15q13-q14. Although there is independent evidence to support the existence of some of these putative QTLs, additional studies are necessary to replicate these findings, narrow the regions, and identify the responsible genes.
Acknowledgments
Support was provided by National Heart, Lung, and Blood Institute cooperative agreement grants U01 HL56563, U01 HL56564, U01 HL56565, U01 HL56566, U01 HL56567, U01 HL56568, and U01 HL56569. This article is presented on behalf of the investigators of the NHLBI Family Heart Study. Participating institutions and principal staff of the study are as follows: Forsyth County/University of North Carolina/Wake Forest University: Gerardo Heiss, Stephen Rich, Greg Evans, James Pankow, H. A. Tyroler, Jeannette T. Bensen, Catherine Paton, Delilah Posey, and Amy Haire; University of Minnesota Field Center: Donna K. Arnett, Aaron R. Folsom, Larry Atwood, James Peacock, and Greg Feitl; Boston University/Framingham Field Center: R. Curtis Ellison, Richard H. Myers, Yuqing Zhang, Andrew G. Bostom, Luc Djoussé, Jemma B. Wilk, and Greta Lee Splansky; University of Utah Field Center: Steven C. Hunt, Roger R. Williams (deceased), Paul N. Hopkins, Hilary Coon, and Jan Skuppin; Coordinating Center, Washington University, St. Louis: Michael A. Province, D. C. Rao, Ingrid B. Borecki, Yuling Hong, Mary Feitosa, Jeanne Cashman, and Avril Adelman; Central Biochemistry Laboratory, University of Minnesota: John H. Eckfeldt, Catherine Leiendecker-Foster, Michael Y. Tsai, and Greg Rynders; Central Molecular Laboratory, University of Utah: Mark F. Leppert, Jean-Marc Lalouel, Tena Varvil, and Lisa Baird; National Heart, Lung, and Blood Institute–Project Office: Phyliss Sholinsky, Millicent Higgins (retired), Jacob Keller (retired), Sarah Knox, and Lorraine Silsbee.
Electronic-Database Information
Accession numbers and URLs for data in this article are as follows:
- ASPEX ftp Site, ftp://lahmed.stanford.edu/pub/aspex/index.html
- Center for Medical Genetics, Marshfield Medical Research Foundation, http://research.marshfieldclinic.org/genetics/
- Family Heart Study, http://www5.biostat.wustl.edu/fhs/
- Genetic Location Database, The, http://cedar.genetics.soton.ac.uk/public_html/ldb.html
- Human Genome Project Working Draft at UCSC, http://genome.ucsc.edu/
- Online Mendelian Inheritance in Man (OMIM), http://www.ncbi.nlm.nih.gov/Omim/ (for obesity [MIM 601665], hypertension [MIM 145500], diabetes [MIM 222100], LEP [MIM 164160], 5-HTR2A [MIM 182135], esterase D [MIM 133280], ATP1A2 [MIM 182340], ATP1B1 [MIM 182330], somatostatin [MIM 182450], Apo-D [MIM 107740], protein phosphatase I-2 [MIM 601792], enoyl-CoA-hydratase [MIM 261515], glucose transporter [MIM 138160], adipose most abundant gene transcript 1 [MIM 605441], LIM/homeodomain islet-1 [MIM 600366], glucocorticoid receptor gene [MIM 138040], β2-adrenergic receptor [MIM 109690], and ESR1 [133430])
- Southwest Foundation for Biomedical Research, http://www.sfbr.org/
References
- Allison DB, Heo M (1998) Meta-analysis of linkage data under worst-case conditions: a demonstration using the human OB region. Genetics 148:859–865 [DOI] [PMC free article] [PubMed] [Google Scholar]
- Arita Y, Kihara S, Ouchi N, Takahashi M, Maeda K, Miyagawa J, Hotta K, Shimomura I, Nakamura T, Miyaoka K, Kuriyama H, Nishida M, Yamashita S, Okubo K, Matsubara K, Muraguchi M, Ohmoto Y, Funahashi T, Matsuzawa Y (1999) Paradoxical decrease of an adipose-specific protein, adiponectin, in obesity. Biochem Biophys Res Commun 257:79–83 [DOI] [PubMed] [Google Scholar]
- Atwood LD, Samollow PB, Hixson JE, Stern MP, MacCluer JW (2001) Genome-wide linkage analysis of blood pressure in Mexican Americans. Genet Epidemiol 20:373–382 [DOI] [PubMed] [Google Scholar]
- Aubert R, Betoulle D, Herbeth B, Siest G, Fumeron F (2000) 5-HT2A receptor gene polymorphism is associated with food and alcohol intake in obese people. Int J Obes Relat Metab Disord 24:920–924 [DOI] [PubMed] [Google Scholar]
- Borecki IB, Blangero J, Rice T, Pérusse L, Bouchard C, Rao DC (1998a) Evidence for at least two major loci influencing human fatness. Am J Hum Genet 63:831–838 [DOI] [PMC free article] [PubMed] [Google Scholar]
- Borecki IB, Bonney GE, Rice T, Bouchard C, Rao DC (1993) Influence of genotype-dependent effects of covariates on the outcome of segregation analysis of the body mass index. Am J Hum Genet 53:676–687 [PMC free article] [PubMed] [Google Scholar]
- Borecki IB, Higgins M, Schreiner PJ, Arnett DK, Mayer-Davis E, Hunt SC, Province MA (1998b) Evidence for multiple determinants of the body mass index: the National Heart, Lung, and Blood Institute Family Heart Study. Obes Res 6:107–114 [DOI] [PubMed] [Google Scholar]
- Borecki IB, Province MA (1999) The impact of marker allele frequency misspecification in variance components quantitative trait locus analysis using sibship data. Genet Epidemiol 17 Suppl 1:S73–S77 [DOI] [PubMed] [Google Scholar]
- Borecki IB. Province MA, Rao DC (1999) False positives and false negatives in variance components linkage analysis of quantitative traits using SEGPATH. Genet Epidemiol 17:212 [Google Scholar]
- Borecki IB, Rice T, Bouchard C, Rao DC (1991) Commingling analysis of generalized body mass and composition measures: the Quebec Family Study. Int J Obes 15:763–773 [PubMed] [Google Scholar]
- Borecki IB, Rice T, Perusse L, Bouchard C, Rao DC (1994) An exploratory investigation of genetic linkage with body composition and fatness phenotypes: the Quebec family study. Obes Res 2:213–219 [DOI] [PubMed] [Google Scholar]
- Bouchard C, Pérusse L, Rice T, Rao DC (1998) The genetics of human obesity. In: GA. Bray, C Bouchard, and WPT James (eds) Handbook of obesity. Marcel Dekker, New York, pp 157–190 [Google Scholar]
- Bray MS, Boerwinkle E, Hanis CL (1999) Linkage analysis of candidate obesity genes among the Mexican-American population of Starr County, Texas. Genet Epidemiol 16:397–411 [DOI] [PubMed] [Google Scholar]
- Broman KW, Murray JC, Sheffield VC, White RL, Weber JL (1998) Comprehensive human genetic maps: individual and sex-specific variation in recombination. Am J Hum Genet 63:861–869 [DOI] [PMC free article] [PubMed] [Google Scholar]
- Cheng LSC, Davis RC, Raffel LJ, Xiang AH, Quinones M, Hsu G, Wen PZ, Toscano E, Azen SP, Hsueh WA, Buchanan TA, Rotter JI (2000) Blood pressure and insulin resistance cosegregate at two distinct regions on chromosome 7. Hypertension 36:718 [Google Scholar]
- Clément K, Dina C, Basdevant A, Chastang N, Pelloux V, Lahlou N, Berlan M, Langin D, Guy-Grand B, Froguel P (1999) A sib-pair analysis study of 15 candidate genes in French families with morbid obesity: indication for linkage with islet 1 locus on chromosome 5q. Diabetes 48:398–402 [DOI] [PubMed] [Google Scholar]
- Clément K, Garner C, Hager J, Philippi A, LeDuc C, Carey A, Harris TJ, Jury C, Cardon LR, Basdevant A, Demenais F, Guy-Grand B, North M, Froguel P (1996) Indication for linkage of the human OB gene region with extreme obesity. Diabetes 45:687–690 [DOI] [PubMed] [Google Scholar]
- Comuzzie AG, Hixson JE, Almasy L, Mitchell BD, Mahaney MC, Dyer TD, Stern MP, MacCluer JW, Blangero J (1997) A major quantitative trait locus determining serum leptin levels and fat mass is located on human chromosome 2. Nat Genet 15:273–276 [DOI] [PubMed] [Google Scholar]
- Comuzzie AG, Williams JT (1999) Correcting for ascertainment bias in the COGA data set. Genet Epidemiol 17:S109–S114 [DOI] [PubMed] [Google Scholar]
- de Andrade M, Amos CI (2000) Ascertainment issues in variance components models. Genet Epidemiol 19:333–344 [DOI] [PubMed] [Google Scholar]
- Dériaz O, Dionne F, Perusse L, Tremblay A, Vohl MC, Cote G, Bouchard C (1994) DNA variation in the genes of the Na,K-adenosine triphosphatase and its relation with resting metabolic rate, respiratory quotient, and body fat. J Clin Invest 93:838–843 [DOI] [PMC free article] [PubMed] [Google Scholar]
- Duggirala R, Stern MP, Mitchell BD, Reinhart LJ, Shipman PA, Uresandi OC, Chung WK, Leibel RL, Hales CN, O'Connell P, Blangero J (1996) Quantitative variation in obesity-related traits and insulin precursors linked to the OB gene region on human chromosome 7. Am J Hum Genet 59:694–703 [PMC free article] [PubMed] [Google Scholar]
- Flegal KM, Carroll MD, Kuczmarski RJ, Johnson CL (1998) Overweight and obesity in the United States: prevalence and trends, 1960–1994. Int J Obes Relat Metab Disord 22:39–47 [DOI] [PubMed] [Google Scholar]
- Friedman JM, Halaas JL (1998) Leptin and the regulation of body weight in mammals. Nature 395:763–770 [DOI] [PubMed] [Google Scholar]
- Hager J, Dina C, Francke S, Dubois S, Houari M, Vatin V, Vaillant E, Lorentz N, Basdevant A, Clement K, Guy-Grand B, Froguel P (1998) A genome-wide scan for human obesity genes reveals a major susceptibility locus on chromosome 10. Nat Genet 20:304–308 [DOI] [PubMed] [Google Scholar]
- Hanson RL, Ehm MG, Pettitt DJ, Prochazka M, Thompson DB, Timberlake D, Foroud T, Kobes S, Baier L, Burns DK, Almasy L, Blangero J, Garvey WT, Bennett PH, Knowler WC (1998) An autosomal genomic scan for loci linked to type II diabetes mellitus and body-mass index in Pima Indians. Am J Hum Genet 63:1130–1138 [DOI] [PMC free article] [PubMed] [Google Scholar]
- Hasstedt SJ, Hoffman M, Leppert MF, Elbein SC (1997) Recessive inheritance of obesity in familial non–insulin-dependent diabetes mellitus, and lack of linkage to nine candidate genes. Am J Hum Genet 61:668–677 [DOI] [PMC free article] [PubMed] [Google Scholar]
- Hauser ER, Boehnke M, Guo SW, Risch N (1996) Affected-sib-pair interval mapping and exclusion for complex genetic traits: sampling considerations. Genet Epidemiol 13:117–137 [DOI] [PubMed] [Google Scholar]
- Higgins M, Province M, Heiss G, Eckfeldt J, Ellison RC, Folsom AR, Rao DC, Sprafka JM, Williams R (1996) NHLBI Family Heart Study: objectives and design. Am J Epidemiol 143:1219–1228 [DOI] [PubMed] [Google Scholar]
- Hinds D, Risch N (1998) The ASPEX package: affected sib pair exclusion mapping. Stanford University, Stanford [Google Scholar]
- Hirschhorn JN, Lindgren CM, Daly MJ, Kirby A, Schaffner SF, Burtt NP, Altshuler D, Parker A, Rioux JD, Platko J, Gaudet D, Hudson TJ, Groop LC, Lander ES (2001) Genomewide linkage analysis of stature in multiple populations reveals several regions with evidence of linkage to adult height. Am J Hum Genet 69:106–116 [DOI] [PMC free article] [PubMed] [Google Scholar]
- Ishiyama-Shigemoto S, Yamada K, Yuan X, Ichikawa F, Nonaka K (1999) Association of polymorphisms in the β2-adrenergic receptor gene with obesity, hypertriglyceridaemia, and diabetes mellitus. Diabetologia 42:98–101 [DOI] [PubMed] [Google Scholar]
- Katzmarzyk PT, Rankinen T, Perusse L, Deriaz O, Tremblay A, Borecki I, Rao DC, Bouchard C (1999) Linkage and association of the sodium potassium-adenosine triphosphatase α2 and β1 genes with respiratory quotient and resting metabolic rate in the Quebec Family Study. J Clin Endocrinol Metab 84:2093–2097 [DOI] [PubMed] [Google Scholar]
- Kissebah AH, Sonnenberg GE, Myklebust J, Goldstein M, Broman K, James RG, Marks JA, Krakower GR, Jacob HJ, Weber J, Martin L, Blangero J, Comuzzie AG (2000) Quantitative trait loci on chromosomes 3 and 17 influence phenotypes of the metabolic syndrome. Proc Natl Acad Sci USA 97:14478–14483 [DOI] [PMC free article] [PubMed] [Google Scholar]
- Knoblauch H, Müller-Myhsok B, Busjahn A, Ben Avi L, Bähring S, Baron H, Heath SC, Uhlmann R, Faulhaber H-D, Shpitzen S, Aydin A, Reshef A, Rosenthal M, Eliav O, Mühl A, Lowe A, Schurr D, Harats D, Jeschke E, Friedlander Y, Schuster H, Luft FC, Leitersdorf E (2000) A cholesterol-lowering gene maps to chromosome 13q. Am J Hum Genet 66:157–166 [DOI] [PMC free article] [PubMed] [Google Scholar]
- Kruglyak L, Lander ES (1995) Complete multipoint sib-pair analysis of qualitative and quantitative traits. Am J Hum Genet 57:439–454 [PMC free article] [PubMed] [Google Scholar]
- Kumanyika SK (2001) Minisymposium on obesity: overview and some strategic considerations. Annu Rev Public Health 22:293–308 [DOI] [PubMed] [Google Scholar]
- Lapsys NM, Furler SM, Moore KR, Nguyen TV, Herzog H, Howard G, Samaras K, Carey DG, Morrison NA, Eisman JA, Chisholm DJ (1997) Relationship of a novel polymorphic marker near the human obese (OB) gene to fat mass in healthy women. Obes Res 5:430–433 [DOI] [PubMed] [Google Scholar]
- Large V, Hellstrom L, Reynisdottir S, Lonnqvist F, Eriksson P, Lannfelt L, Arner P (1997) Human beta-2 adrenoceptor gene polymorphisms are highly frequent in obesity and associate with altered adipocyte beta-2 adrenoceptor function. J Clin Invest 100:3005–3013 [DOI] [PMC free article] [PubMed] [Google Scholar]
- Lee JH, Reed DR, Li W-D, Xu W, Joo E-J, Kilker RL, Nanthakumar E, North M, Sakul H, Bell C, Price RA (1999) Genome scan for human obesity and linkage to markers in 20q13. Am J Hum Genet 64:196–209 [DOI] [PMC free article] [PubMed] [Google Scholar]
- Leibowitz SF (1990) The role of serotonin in eating disorders. Drugs 39 Suppl 3:33–48 [DOI] [PubMed] [Google Scholar]
- Lorentzon M, Lorentzon R, Backstrom T, Nordstrom P (1999) Estrogen receptor gene polymorphism, but not estradiol levels, is related to bone density in healthy adolescent boys: a cross-sectional and longitudinal study. J Clin Endocrinol Metab 84:4597–4601 [DOI] [PubMed] [Google Scholar]
- Mandal DM, Wilson AF, Elston RC, Weissbecker K, Keats BJ, Bailey-Wilson JE (2000) Effects of misspecification of allele frequencies on the type I error rate of model-free linkage analysis. Hum Hered 50:126–132 [DOI] [PubMed] [Google Scholar]
- Meirhaeghe A, Helbecque N, Cottel D, Amouyel P (1999) β2-adrenoceptor gene polymorphism, body weight, and physical activity. Lancet 353:896 [DOI] [PubMed] [Google Scholar]
- Mitchell BD, Cole SA, Comuzzie AG, Almasy L, Blangero J, MacCluer JW, Hixson JE (1999) A quantitative trait locus influencing BMI maps to the region of the β-3 adrenergic receptor. Diabetes 48:1863–1867 [DOI] [PubMed] [Google Scholar]
- Moll PP, Burns TL, Lauer RM (1991) The genetic and environmental sources of body mass index variability: the Muscatine Ponderosity Family Study. Am J Hum Genet 49:1243–1255 [PMC free article] [PubMed] [Google Scholar]
- Norman RA, Tataranni PA, Pratley R, Thompson DB, Hanson RL, Prochazka M, Baier L, Ehm MG, Sakul H, Foroud T, Garvey WT, Burns D, Knowler WC, Bennett PH, Bogardus C, Ravussin E (1998) Autosomal genomic scan for loci linked to obesity and energy metabolism in Pima Indians. Am J Hum Genet 62:659–668 [DOI] [PMC free article] [PubMed] [Google Scholar]
- Ohman M, Oksanen L, Kaprio J, Koskenvuo M, Mustajoki P, Rissanen A, Salmi J, Kontula K, Peltonen L (2000) Genome-wide scan of obesity in Finnish sibpairs reveals linkage to chromosome Xq24. J Clin Endocrinol Metab 85:3183–3190 [DOI] [PubMed] [Google Scholar]
- Ouchi N, Kihara S, Arita Y, Maeda K, Kuriyama H, Okamoto Y, Hotta K, Nishida M, Takahashi M, Nakamura T, Yamashita S, Funahashi T, Matsuzawa Y (1999) Novel modulator for endothelial adhesion molecules: adipocyte-derived plasma protein adiponectin. Circulation 100:2473–2476 [DOI] [PubMed] [Google Scholar]
- Perola M, Öhman M, Hiekkalinna T, Leppävuori J, Pajukanta P, Wessman M, Koskenvuo M, Palotie A, Lange K, Kaprio J, Peltonen L (2001) Quantitative-trait-locus analysis of body-mass index and of stature, by combined analysis of genome scans of five Finnish study groups. Am J Hum Genet 69:117–123 [DOI] [PMC free article] [PubMed] [Google Scholar]
- Price RA, Ness R, Laskarzewski P (1990) Common major gene inheritance of extreme overweight. Hum Biol 62:747–765 [PubMed] [Google Scholar]
- Province MA, Arnqvist P, Keller J, Higgins M, Rao DC (1990) Strong evidence for a major gene for obesity in the large, unselected, total Community Health study of Tecumseh. Am J Hum Genet Suppl 47:A143 [Google Scholar]
- Province MA, Rice T, Borecki IB, Gu C, Rao DC. A multivariate and multilocus variance components approach using structural relationships to assess quantitative trait linkage via SEGPATH. Genet Epidemiol (in press) [DOI] [PubMed] [Google Scholar]
- Rainwater DL, Almasy L, Blangero J, Cole SA, VandeBerg JL, MacCluer JW, Hixson JE (1999) A genome search identifies major quantitative trait loci on human chromosomes 3 and 4 that influence cholesterol concentrations in small LDL particles. Arterioscler Thromb Vasc Biol 19:777–783 [DOI] [PubMed] [Google Scholar]
- Reed DR, Ding Y, Xu W, Cather C, Green ED, Price RA (1996) Extreme obesity may be linked to markers flanking the human OB gene. Diabetes 45:691–694 [DOI] [PubMed] [Google Scholar]
- Rice T, Perusse L, Bouchard C, Rao DC (1999) Familial aggregation of body mass index and subcutaneous fat measures in the longitudinal Quebec family study. Genet Epidemiol 16:316–334 [DOI] [PubMed] [Google Scholar]
- Rice T, Rankinen T, Province MA, Chagnon YC, Perusse L, Borecki IB, Bouchard C, Rao DC (2000) Genome-wide linkage analysis of systolic and diastolic blood pressure: the Quebec Family Study. Circulation 102:1956–1963 [DOI] [PubMed] [Google Scholar]
- Rosmond R, Chagnon YC, Holm G, Chagnon M, Perusse L, Lindell K, Carlsson B, Bouchard C, Bjorntorp P (2000) A glucocorticoid receptor gene marker is associated with abdominal obesity, leptin, and dysregulation of the hypothalamic-pituitary-adrenal axis. Obes Res 8:211–218 [DOI] [PubMed] [Google Scholar]
- Roth H, Hinney A, Ziegler A, Barth N, Gerber G, Stein K, Bromel T, Mayer H, Siegfried W, Schafer H, Remschmidt H, Grzeschik KH, Hebebrand J (1997) Further support for linkage of extreme obesity to the obese gene in a study group of obese children and adolescents. Exp Clin Endocrinol Diabetes 105:341–344 [DOI] [PubMed] [Google Scholar]
- Utah Marker Development Group (1995) A collection of ordered tetranucleotide-repeat markers from the human genome. Am J Hum Genet 57:619–628 [PMC free article] [PubMed] [Google Scholar]
- van Itallie TB, Abraham S (1985) Some hazards of obesity and its treatment. In: Hirsch J and van Itallie TB (eds) Recent advances in obesity research, vol 4. J Libbey, London, pp [Google Scholar]
- Vijayaraghavan S, Hitman GA, Kopelman PG (1994) Apolipoprotein-D polymorphism: a genetic marker for obesity and hyperinsulinemia. J Clin Endocrinol Metab 79:568–570 [DOI] [PubMed] [Google Scholar]
- Vionnet N, Hani EH, Dupont S, Gallina S, Francke S, Dotte S, De Matos F, Durand E, Lepretre F, Lecoeur C, Gallina P, Zekiri L, Dina C, Froguel P (2000) Genomewide search for type 2 diabetes-susceptibility genes in French whites: evidence for a novel susceptibility locus for early-onset diabetes on chromosome 3q27-qter and independent replication of a type 2-diabetes locus on chromosome 1q21-q24. Am J Hum Genet 67:1470–1480 [DOI] [PMC free article] [PubMed] [Google Scholar]
- Visscher TL, Seidell JC (2001) The public health impact of obesity. Annu Rev Public Health 22:355–375 [DOI] [PubMed] [Google Scholar]
- Yamada K, Ishiyama-Shigemoto S, Ichikawa F, Yuan X, Koyanagi A, Koyama W, Nonaka K (1999) Polymorphism in the 5′-leader cistron of the β2-adrenergic receptor gene associated with obesity and type 2 diabetes. J Clin Endocrinol Metab 84:1754–1757 [DOI] [PubMed] [Google Scholar]