

Abstract
Evidence that exogenous dietary miRNAs enter the bloodstream and tissues of ingesting animals has been accompanied by an indication that at least one plant miRNA, miR168, participates in “cross-kingdom” regulation of a mammalian transcript. If confirmed, these findings would support investigation of miRNA-based dietary interventions in disease. Here, blood was obtained pre- and post-prandially (1, 4, 12 h) from pigtailed macaques that received a miRNA-rich plant-based substance. Plant and endogenous miRNAs were measured by RT-qPCR. Although low-level amplification was observed for some plant miRNA assays, amplification was variable and possibly non-specific, as suggested by droplet digital PCR. A consistent response to dietary intake was not observed. While our results do not support general and consistent uptake of dietary plant miRNAs, additional studies are needed to establish whether or not plant or animal xenomiRs are transferred across the gut in sufficient quantity to regulate endogenous genes.
Keywords: microRNA, plant, diet, nutrition, xenomiR, digital PCR, RT-qPCR, extracellular vesicle, exosome
Introduction
In 2012 L. Zhang et al. presented the hypothesis that plant miRNAs are transferred into blood and then tissue from dietary sources.1 Not only did the authors report detection of plant miRNA in animals, they also provided evidence that one specific, abundant plant miRNA, miR168, regulated the expression of low-density lipoprotein receptor-associated protein 1 (LDLRAP1)1 in mice. Plant miRNAs, then, might be capable of performing the same gene regulatory functions as endogenous animal miRNAs.2,3 Furthermore, plant miRNAs appeared to exert this function in tissue after entering from the circulation. Endogenous animal miRNAs are known agents of intercellular communication4-6 and are carried and protected in a diverse array of biofluids by extracellular vesicles, protein complexes7,8 and other vehicles.9
The hypothesis of L. Zhang et al., which we have elsewhere called the dietary “xenomiR” hypothesis,10 has understandably provoked considerable attention, and the implications of validation would be many. Plant miRNAs that traverse the gut in numbers sufficient to regulate specific animal genes could be considered a new form of nutrient. If confirmed, this finding would provide new evidence-based approaches to dietary preventive strategies and nutritional therapies of human disease. In addition to careful use of abundant native plant miRNAs, specific, normally low-abundance xenomiRs or even artificial miRNAs designed to target disease-related transcripts could be overexpressed in plants for dietary administration. Some have stated that plant xenomiRs could even explain the putative efficacy of herbal folk remedies.11 Nor is there any reason to assume that plants provide the only xenomiRs. Since unpackaged RNA is rapidly degraded in the biological environment, uptake of foreign RNA would likely include the native protective packaging of the RNA (e.g., proteins or vesicles). If specific uptake could occur for plant material, it might be more likely to occur for non-human animal miRNAs that share more highly conserved packaging.10 Animal miRNAs would be more difficult than plant xenomiRs to detect in the ingesting animal, given the 100% conservation of most abundant canonical miRNAs, but sequencing approaches12 and carefully controlled labeling experiments could provide answers.
Amidst the justifiable excitement, however, questions about the hypothesis have been raised.10,12,13 Few follow-up studies have been published.12,14 Publicly available sequencing data were found to diverge from the originally reported prevalence of plant xenomiRs in animal samples.12 It was also noted that, in the original study, only five plant miRNAs were detected consistently (but quite variably) in RNA isolated from 100 mL of pooled serum.10 Petrick and colleagues calculated that the feeding regimen in the original mouse studies would correspond with a human intake of 33 kg of cooked rice per day.13 The group of Ivashuta and Heck addressed the issue of an apparent disconnect between abundance of miRNA in dietary sources and in animal samples with a point-counterpoint review of several possibilities, namely that:
“plant miRNA abundance detected in animal tissue datasets should reflect the distribution of miRNAs in plant tissues unless (a particular miRNA) undergoes preferential uptake or stabilization in animals, or that alternatively there is active discrimination against more abundant plant miRNAs.”12
With the goal of shedding more light on the likelihood of dietary xenomiR transfer, we used the Macaca nemestrina nonhuman primate model to examine response to dietary intake of a plant miRNA-rich food source. Sensitive mature miRNA-specific RT-qPCR assays were used to detect and quantitate xenomiRs and endogenous miRNAs in plasma before and following dietary intake.
Results
A commercially available plant-based, plant miRNA-rich substance (a “Silk” fruit and protein shake) was chosen for administration to pigtailed macaques. The substance contained soy and fruit material but no animal products. Relative abundance of mature plant miRNAs was assessed in relation to the moderately abundant miR160 (Fig. 1A). A stem-loop primer, hydrolysis probe-based RT-qPCR assay for miR160 showed consistent and efficient amplification through at least 35 PCR cycles (Fig. 1B). Dilutions indicated that miR160 was consistently detected in reverse transcribed material corresponding to less than 200 picoliters (dilution 6) to s nanoliters (dilution 1) of the original substance (Fig. 1B).
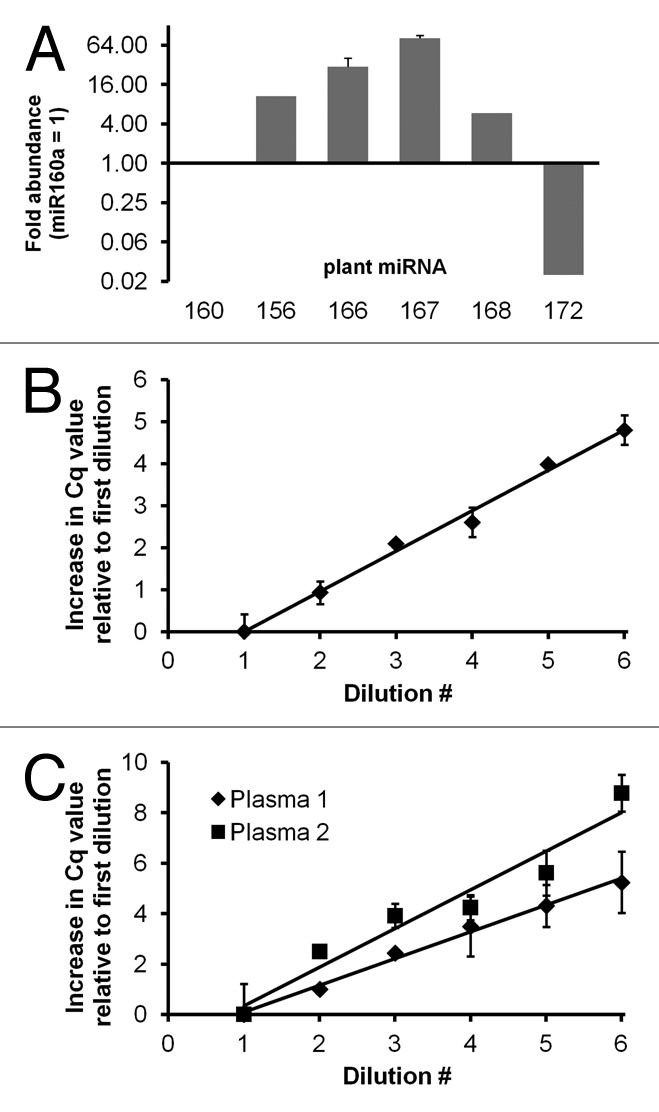
Figure 1. miRNA abundance and amplification efficiency in a plant-based dietary substance and in mammalian plasma. (A) Relative abundance of several highly conserved plant miRNAs in a soy- and fruit substance. RNA was purified from 100 µl “Silk” using the mirVana total RNA isolation protocol (Ambion/Life Technologies). Hydrolysis probe-based RT-qPCR measurements were made from up to three independent RNA isolations. Fold abundance was calculated relative to miR160. Similar results were obtained at different input RNA dilutions (not shown). Error bars represent standard deviation. (B and C) RT-qPCR assay linearity and amplification efficiency was assessed (shown here: miR160) using 2-fold serial dilutions of cDNA prepared with mature miRNA-specific stem-loop primers and plant RNA from the dietary substance (B) or RNA from pre- or post-prandial plasma samples (C). For plant RNA, (B) starting dilution (#1) corresponded to cDNA from approximately 6.3 nanoliters of the original substance. Final dilution (#6) was from about 200 picoliters original volume. Amplification occurred in all wells, and amplification efficiency was approximately 100%. Error bars are standard deviation of triplicate measurements (less than half a cycle for all dilutions). For plasma, dilutions corresponded to material from 2 µl plasma (#1) down to 60 nl plasma (#6). Standard deviation corresponded to half a cycle or greater for 8 of 12 samples, and several wells within technical replicate groups did not amplify. Amplification efficiencies were 94% (plasma 1) and 65% (plasma 2).
The substance was administered by gavage to two male pigtailed macaques following overnight fasting. Gavage volume was approximately 5% of estimated blood volume for each animal (see Methods and Table S1). Based on the results of L. Zhang et al., in which changes in plasma miRNA abundance were reported in mice within 3–6 h of food intake (rice),1 we drew blood at 1, 4 and 12 h postprandial time points for comparison with an overnight fasting, pre-intake time point. We chose these time points because our food source was relatively homogenized compared with raw rice and because we wished to allow ample time (12 h) for return of plant miRNA to fasting levels, assuming a post-prandial increase. Plasma was isolated and frozen, and RNA was isolated from all plasma samples simultaneously for RT-qPCR analysis.
RT-qPCR results indicated late amplification of some plant miRNA, but the quality of data was low and inconsistent with specific, reliable detection. Strikingly, despite consistent and efficient plant miRNA amplification from material corresponding to sub-nanoliter volumes of the plant miRNA source to 35 PCR cycles, results of RT-qPCR reactions for plasma were highly variable. Many reactions did not amplify, and standard deviations for amplifying replicates were high. We aim generally for Cq standard deviations of 0.2 or less for our miRNA assays; for all but the miR160 reactions, standard deviations (to the extent they could be calculated) were generally greater than 1. miR172 did not amplify before 40 cycles, and miRs166, 167 and 168 had median Cq greater than 35. For miR168, but not for other plant miRNA or endogenous RNA, no-template controls also amplified regularly within the same Cq range as the experimental samples (data not shown). Even for miR160, the earliest and most consistently amplifying plant miRNA (mean Cq of 32.6), efficiency of amplification varied considerably as assessed by dilution experiments (see Fig. 1C for two examples). Together, these results diminish confidence in the specificity and reliability of RT-qPCR amplification of these particular plant miRNA from plasma. Indeed, the most conservative interpretation is that, with the possible but ambiguous exception of miR160, there is little evidence for presence of these plant miRNA in non-human primate blood prior to or following dietary intake of a plant miRNA-rich substance.
Nevertheless, it remained possible that extremely low levels of plant miRNA were present and detected, so we sought to identify trends in the data that could support the xenomiR hypothesis. We could justify closer examination of only miR160 and miR166 because of the widespread lack of amplification of miR167 and miR172 and the no-template control amplification of miR168, which indicated non-specificity. If xenomiRs were introduced into the bloodstream from the diet, it might stand to reason that the plasma plant miRNA profile would adjust to resemble the profile of the ingested substance. Furthermore, based on the data of L. Zhang, et al.,1 the fasting xenomiR profile should be rapidly altered by dietary intake.
The apparent abundance of xenomiRs in plasma at time zero did not shift consistently following gavage, nor did the relative quantities of miRNA in the dietary substance resemble those in the plasma at any time point. In the plant-based substance, miR160 was considerably less abundant than miR166 (as well as 167 and 168, Fig. 1A). However, miR160 was apparently much more abundant than miR166 in plasma before dietary intake, and it remained so at all post-prandial time points (Fig. 2A) with no consistent adjustment toward the ratio in the ingested material. Although abundance of miR166 relative to miR160 appeared to increase on average (Fig. 2A), this finding must be viewed against the tremendous variability of miR166 values. Examining the data in a different way, data for our two pilot subjects were not only highly variable; they generally did not track with each other (Fig. 2B and C).
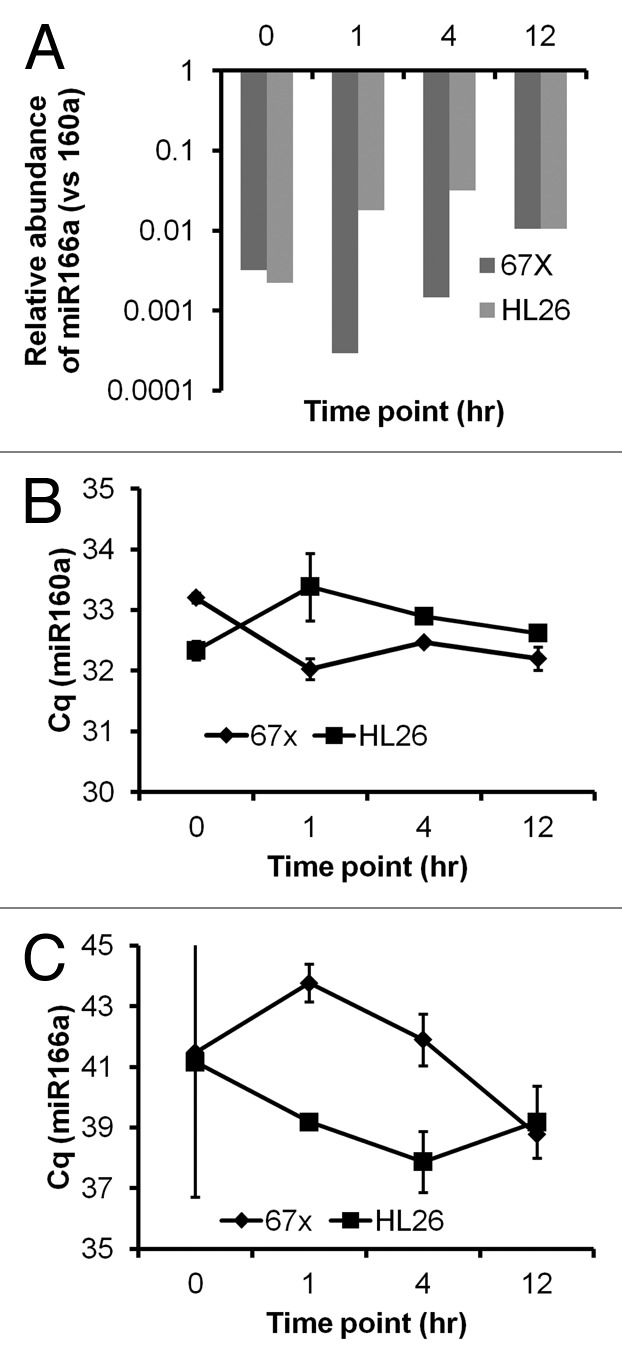
Figure 2. Plant miRNAs in circulation before and following intake of a miRNA-rich food source. (A) Apparent abundance in plasma of miR166 relative to miR160, as assessed by RT-qPCR with RNA samples purified by mirVana technique, did not match relative abundance in the food source at any time point pre- or post-prandial (compare with Fig. 1A) in either of two macaque subjects designated “67X” and “HL26.” (B and C) Plasma miR160 and miR166 Cq values and standard deviations by time point and subject (67X and HL26). Missing standard deviation bars are due to insufficient numbers of amplifying wells. Note that, to the extent it could be estimated, direction of apparent regulation often differed between the two subjects.
While we were conducting this study, in December 2012, a new biofluids-specific RNA purification system became available (miRCURY RNA Isolation Kit - Biofluids from Exiqon). According to the manufacturer, this system provides improved yield and enhanced removal of PCR inhibitors. We have confirmed the outstanding performance of this system for small RNA isolation from both plasma and cerebrospinal fluid.15 With the goal of determining whether low RNA recovery or the presence of PCR inhibitors in our initial isolations could have contributed to largely negative results, we repeated the above experiments after isolating RNA with the Exiqon Biofluids procedure from previously unthawed macaque plasma. Despite greater recovery of endogenous miRNAs from plasma with this method, inconsistent amplification and high standard deviations for plant miRNAs in plasma were again observed. In contrast with results from the first RNA isolation method, miR160 did not amplify consistently before 40 cycles (Fig. 3). miRs166, 167 and 168 amplified between about 35 and 38 cycles, albeit with considerable variability (Fig. 3, top and middle panels). Since we had previously examined only four of the top six plant miRNA reported by Zhang et al.,1 in these experiments, we also measured plant miR156. Just as for the other plant miRNAs, miR156 amplified late and inconsistently in macaque plasma both before and after gavage of plant material (Fig. 3, lower panels). No consistent trends were observed in the two subjects.

Figure 3. RT-qPCR results for RNA isolated with a high-performance biofluids-specific protocol (Exiqon). Cq and standard deviation of RT-qPCR results for five plant miRNAs and one exogenous spike-in RNA are shown for plasma from subjects 67X (left) and HL26 (right) obtained at the pre-prandial (0) time point and at 1, 4 and 12 h post-prandial. Asterisk indicates a time point for which no reactions amplified for that miRNA. In the bottom panels, highly consistent recovery is shown for a miRNA (cel-miR-39) that was spiked in to the RNA isolation reactions to assess variability in the isolation technique that could have affected results.
Although our isolation replicates would have tended to minimize the possibility that RNA isolation efficiency outliers could affect results, we tested the level of a spiked-in exogenous RNA to confirm technical recovery. Values were highly consistent across all samples (Fig. 3, lower panels). Thus, whether for raw data or data normalized for technical recovery, there was no apparent increase in miRNA levels following dietary intake. However, apparent increase or lack thereof would appear to be irrelevant, as no-template controls often amplified in the same cycle range as the plant miRNAs. This was not the case for endogenous animal miRNAs or the spiked-in control, supporting the case that the late apparent amplification of plant xenomiRs from these RNA isolations was non-specific.
To investigate further the potential for extremely low copy numbers of plant miRNA in animal plasma, as well as to examine specificity, we employed droplet digital PCR (ddPCR).16 With the ddPCR platform we used, the PCR reaction mix, including fluorescently labeled hydrolysis probes, was emulsified into nanoliter droplets. Following thermocycling, positive and negative droplets were counted to provide copy number estimates. Plant miRNAs were reliably counted in high dilutions of the RNA samples from plant material, down to fractional copies per microliter in the multi-microliter input sample (Fig. 4A and B; additional examples not shown but available upon request). Counts were also generated for macaque plasma (Fig. 4A‒C), but intensity plots showed that these counts were generally of very low and variable intensity, as for non-specific amplification. For mir160, the plant miRNA with relatively high apparent counts in the mirVana-purified plasma RNA, large numbers of counts appeared, but the intensity plots for these reactions revealed a “rain” appearance, consistent with nonspecific amplification (Fig. 4C). No-template control reactions for miRs166, 167, 168 and others also showed very low-level apparent amplification that would register “positive” depending on threshold. Droplet digital PCR, then, underscored the non-specific nature of many amplification events assigned to plant miRNA in macaque plasma.

Figure 4. Droplet digital PCR indicates specific amplification of plant miRNA from plant source but not from pre- or postprandial animal plasma. (A and B) Intensity plots of DX100 QuantaSoft results for miR167 and miR168: for RNA from the dietary plant material (left), positive droplets clustered at high and relatively consistent intensity (specific amplification). Droplets from four hour postprandial plasma samples (right) had low and varying intensity, especially for miR168, consistent with inefficient or spurious amplification. Triplicate reactions are shown. Note that the intensity scale is not necessarily equivalent between different plots. (C) miR160 showed the highest level of amplification from plasma for miRNAs we examined by RT-qPCR (see Fig. 2), but by ddPCR with pre- and post-prandial plasma samples, there was a wide range of droplet intensities. From plant material, droplet intensities clustered consistently as for the miRNAs in (A and B) (not shown). The horizontal line is an example of where a threshold might be drawn. (D) Low-level non-specific amplification for plant miRs166, 167 and 168 from one no-template control reaction each (water). (E) Copy number counts and confidence interval minimum and maximum for miR160 per microliter of reaction volume over a 1:4 dilution series of material corresponding to cDNA from input into a reverse transcription reaction that corresponded to RNA obtained from 6.25 nl (dilution 1), 1.6 nl (dilution 2) and 400 pl (dilution 3) of the “Silk” plant-based substance. (F) Counts and confidence intervals for undiluted material from plasma RNA isolations for the pre-intake and 4 h postprandial time points for miR160 for subjects 67X and HL26.
Discussion
Our results indicate that, even if some plant miRNAs appeared to amplify from nonhuman primate plasma, their levels were quite low and/or amplification was non-specific. Detection was largely unreliable for plant miRNAs 156, 160, 166, 167, 168 and 172 despite the relative abundance of all but miR172 in a soy- and fruit-substance that was administered to the macaque subjects. Copy numbers from digital PCR revealed miRNA amounts ranging from 0.11‒2.26 fmol/mL in the soy/fruit substance. Comparing these amounts with the data of L. Zhang et al. on miRNA content of raw and cooked rice, the abundance in the substance was intermediate between raw rice and the cooked food that was the dietary staple of the human subjects of L. Zhang et al.1 Nevertheless, plant xenomiR levels did not appear to change in response to dietary intake and did not respond consistently in the two subjects of our pilot study.
miR160 initially appeared to provide the best evidence for presence and diet responsiveness in animal plasma. However, additional evidence weighed against this interpretation of the data. A second, biofluids-specific RNA isolation method did not allow replication of the miR160 results. Amplification appeared to be non-specific even in the original samples according to ddPCR. Also, L. Zhang et al. reported sequence reads of miR160 in only five of 10 human serum pools, and in those samples, there was a median of only eight sequences per million reads (analysis of supplemental data from ref. 1).
Had the miR160 results been more reliable, copy numbers would still have been low, corresponding to approximately one 1,000th the level of miR-16 (not shown), a moderately abundant plasma miRNA.7,17 This raises the issue of stoichiometry: How much of a miRNA must be present in plasma to have a physiologic effect, for example, to influence gene regulation in tissue? There is no consensus on the answer, and although it has been proposed that fairly high copy numbers of miRNA must be present in a cell to exert regulation,18 it is possible that some miRNAs or some regulatory mechanisms are exceptional. We cannot dismiss out-of-hand the potential of very low copy number plant miRNAs to have a physiologic effect.
In addition to the results reported here, several lines of evidence must be considered when weighing the dietary xenomiR hypothesis, at least as regards plant miRNA. First, serum data from the original study were highly variable (Fig. S1, plot of supplemental data from ref. 1) and perhaps suggestive of possible contamination or other issues, as has been intimated previously for plant pollen in the case of results involving putatively non-Mendelian inheritance.19,20 For example, from 12‒27,758 miR168 reads per million were reported across the 12 serum pools that were sequenced.1 Since sample pooling tends to mask variability, this range in detection gives pause, especially considering the reported enrichment of miR168 and miR156 in plant pollen.21 Also, if an abundant dietary xenomiR such as miR168 is present at levels as low as 12 per million reads, it is difficult to envision how rare, exotic plant-specific miRNAs could reach functionally relevant levels in the organism,10 as has been proposed.11
Second, additional negative results included the analysis of public data sets by the group of Ivashuta and Heck,12 as well as accompanying results from the same team examining insect feeding.12 Writing in BMC Genomics, this group found that miR168 was the exclusive or the overwhelmingly predominant plant miRNA detected in the majority of 63 high-throughput sequencing studies that examined organisms ranging from insects to humans and including cell culture. The monocot-specific miR168 predominated even in animals with a dicot diet. Furthermore, the abundance of plant miRNAs in animal RNA populations was at least an order of magnitude lower than reported by L. Zhang et al.,1 even in the study with the highest reported abundance of plant miRNAs.12 In insect feeding studies, plant miRNA were found even in non-feeding neonates. Thus, some detection of plant miRNA, and miR168 in particular, could be due to technical artifact or cross-contamination of sequencing experiments.12
Finally, we are unaware of any firm published confirmation of the results of L. Zhang et al. Although the study has been cited almost 100 times as of this writing (according to a Google Scholar search on May 6, 2013), most treatments of the plant miRNA hypothesis have understandably taken the form of review and hypothesis.10,11,22,23 In a primary study by Wang, et al., plant RNA sequences were found in plasma along with diverse bacterial and fungal RNA sequences.14 However, the only reported plant miRNA in this study was miR168, and it was present at a median of less than three copies per million sequence reads. Exogenous plasma RNAs were also reported in a study by Semenov et al., but it does not appear that plant miRNAs were examined.24 Raw data appeared to be unavailable for these studies,14,24 as for the original study.1 Since expression data may often be useful beyond the purposes for which they were intended, all researchers are encouraged to deposit sequencing and microarray data to facilitate transparency and replication.25
Several potential weaknesses of the current study must be emphasized. It is unclear how or whether to normalize data for low-quantity endogenous miRNA in plasma, much less xenomiRs. Although normalization to multiple endogenous features is recommended for endogenous miRNA,26-28 the populations of vehicles that carry and protect miRNA in circulation—extracellular vesicles, protein complexes and possibly others—may change in quantity and/or size distribution following dietary intake, as suggested by nanoparticle tracking analysis (Fig. S2), and potentially during the Circadian day.6 Further studies would be needed to determine appropriate normalization strategies for plant xenomiRs. Generally, we have presented raw Cq values because we feel that they are the most open and unambiguous presentation of the data, indicating variability and apparent abundance; because spike-in experiments demonstrated no significant difference in technical RNA recovery between samples; and because any sort of technical or biological normalization is of limited or no value for the questionably specific amplification we observed.
Another important weakness is that our feeding experiments included only two macaque subjects. It is formally possible that these animals could have been coincidentally deficient in a hypothetical pathway necessary for dietary miRNA uptake. However, we have observed the same specificity problems in larger numbers of plasma samples from mouse models (data not shown).
Confirming the exciting and noteworthy hypothesis that xenomiRs are absorbed from the diet and exert functional effects in animals would have profound implications.10,29 However, we submit that our data do not provide strong support for entry into the bloodstream of large proportions of the miRNA complement of dietary plant sources. It is unclear (and would be more difficult to ascertain) whether dietary animal xenomiRs contribute to the circulating miRNA profile. Careful sequencing studies should be done to address this possibility. Overall, additional, carefully controlled studies with larger groups of subjects are needed to answer the many questions surrounding the xenomiR hypothesis.
Materials and Methods
Ethics statement
Animal studies were approved by the Johns Hopkins University Institutional Animal Care and Use Committee and conducted in accordance with the Weatherall Report, the Guide for the Care and Use of Laboratory Animals and the USDA Animal Welfare Act.
Reagents
“Silk” fruit and protein substance (WhiteWave Foods Company) was purchased from a local grocer and stored at 4°C until use. Paired stem-loop reverse transcription primers and hydrolysis probe/primer combinations for RT-qPCR were purchased from Life Technologies for the following miRNAs: plant miRs156, 160, 166, 167, 168, 172; cel-miR-39 (spike-in); and mammalian miRNAs miRs-15b, -16, -17, -20a*, -21, -122, -191 and -223. RNA isolation kits were from Life Technologies (mirVana, AM1561) or Exiqon (miRCURY RNA Isolation kit - Biofluids, #300112). All RT-qPCR and ddPCR reagents were purchased from Life Technologies or BioRad. Additional reagents included glycogen (Ambion/Life Technologies, AM9510) and synthetic cel-miR-39 (Integrated DNA Technologies—custom product synthesized to sequence from miRbase.org).30
Experimental design and sample handling
Two macaque subjects were chosen for the feeding experiment (see characteristics in Table S1). Animals were chemically restrained with ketamine hydrochloride (10–12 mg/kg) intramuscularly for blood sampling and gastric gavage. Blood samples were obtained by venipuncture after overnight fasting (time 0). A volume of “Silk” fruit and protein substance corresponding to approximately 5% of total blood volume was administered by gastric gavage. Blood was drawn at 1, 4 and 12 h after gavage. All samples were collected with ACD anticoagulant to avoid interference with nucleic acid amplification reactions, and plasma was isolated by centrifugation as described previously.28 Samples were frozen in small aliquots and maintained at -80°C until use.
RNA isolation
RNA samples were isolated simultaneously to avoid unnecessary introduction of batch effects. Using the mirVana total RNA isolation protocol (Life Technologies), RNA was extracted from 100 µl plasma as previously described,28,31 with elution in 100 µl highly pure water. Isolation with the miRCURY Biofluids kit (Exiqon) was done from 170 µl plasma, with elution in 50 µl for a concentration factor of 3.4 compared with the mirVana-isolated RNA (assuming equal recovery). Manufacturer’s instructions were followed with the following modifications: 3 µg per reaction highly pure glycogen was used as a carrier/co-precipitant, and an amount of synthetic cel-miR-39 (Integrated DNA Technologies) corresponding to 10 pg per isolation was added to lysis buffer (“lysis solution BF”). We note that synthetic RNA cannot be added directly to plasma or other biological substances because endogenous RNases will degrade it forthwith. Isolated RNA from all isolation methods was stored at -80°C.
RT-qPCR
Reverse transcription and RT-qPCR steps were performed according to manufacturer’s protocol with any modifications as described previously.28,32 Real-time detection systems were the iQ5 and CFX96 instruments (BioRad). Although we typically do not perform more than 35 RT-qPCR cycles, we allowed all reactions to proceed for 45 cycles so as not to eliminate late but potentially consistently amplifying xenomiR reactions.
Droplet digital PCR
ddPCR was performed with stem-loop RT reactions as input and with hydrolysis probe miRNA-specific assays from Life Technologies as described above. We used the QX100 droplet generator and droplet reader, along with QuantaSoft software (all from BioRad). Manufacturer’s instructions were followed throughout.
Supplementary Material
Acknowledgments
The authors thank members of the Department of Molecular and Comparative Pathobiology for interesting discussions and gratefully acknowledge the support of Janice E. Clements, M. Christine Zink and Joseph L. Mankowski, the assistance of Kelly A. Metcalf Pate, and the technical contributions of Sarah S. Subaran. K.W.W. would like to thank Jasper D. Rine for insightful comments during a poster session at the 2013 Keystone Symposium “Nutrition, Epigenetics, and Human Disease,” at which a portion of this work was presented. The authors also thank the anonymous reviewers for their expert guidance. This project was supported by the National Center for Research Resources and the Office of Research Infrastructure Programs (ORIP) and the National Institutes of Health through Grant Number P40 OD013117. K.W.W. and M.A.M. are supported in part by NIMH Center grant P30 MHO75673, and K.W.W. receives support from NIH grants NS076357, MH070306 and AI096113 (J.E. Clements, PI).
Glossary
Abbreviations:
- miRNA
microRNA
- xenomiR
exogenous miRNA
- RT
reverse transcription
- PCR
polymerase chain reaction
- RT-qPCR
real-time quantitative polymerase chain reaction
- ddPCR
droplet digital PCR
- Cq
quantification cycle
Disclosure of Potential Conflicts of Interest
No potential conflicts of interest were disclosed.
Note
Another publication on this topic, also appearing in this issue, describes results of feeding experiments with humans, mice and bees.33 These results were consistent with those reported here.
Footnotes
Previously published online: www.landesbioscience.com/journals/rnabiology/article/25246
References
- 1.Zhang L, Hou D, Chen X, Li D, Zhu L, Zhang Y, et al. Exogenous plant MIR168a specifically targets mammalian LDLRAP1: evidence of cross-kingdom regulation by microRNA. Cell Res. 2012;22:107–26. doi: 10.1038/cr.2011.158. [DOI] [PMC free article] [PubMed] [Google Scholar]
- 2.Bartel DP. MicroRNAs: target recognition and regulatory functions. Cell. 2009;136:215–33. doi: 10.1016/j.cell.2009.01.002. [DOI] [PMC free article] [PubMed] [Google Scholar]
- 3.Mendell JT, Olson EN. MicroRNAs in stress signaling and human disease. Cell. 2012;148:1172–87. doi: 10.1016/j.cell.2012.02.005. [DOI] [PMC free article] [PubMed] [Google Scholar]
- 4.Valadi H, Ekström K, Bossios A, Sjöstrand M, Lee JJ, Lötvall JO. Exosome-mediated transfer of mRNAs and microRNAs is a novel mechanism of genetic exchange between cells. Nat Cell Biol. 2007;9:654–9. doi: 10.1038/ncb1596. [DOI] [PubMed] [Google Scholar]
- 5.Pegtel DM, Cosmopoulos K, Thorley-Lawson DA, van Eijndhoven MA, Hopmans ES, Lindenberg JL, et al. Functional delivery of viral miRNAs via exosomes. Proc Natl Acad Sci USA. 2010;107:6328–33. doi: 10.1073/pnas.0914843107. [DOI] [PMC free article] [PubMed] [Google Scholar]
- 6.Witwer KW, Buzas EI, Bemis LT, Bora A, Lasser C, Lotvall J, et al. Standardisation of sample collection, isolation and analysis methods in extracellular vesicle research: An ISEV position paper. Journal of Extracellular Vesicles. 2013 doi: 10.3402/jev.v2i0.20360. In press. [DOI] [PMC free article] [PubMed] [Google Scholar]
- 7.Arroyo JD, Chevillet JR, Kroh EM, Ruf IK, Pritchard CC, Gibson DF, et al. Argonaute2 complexes carry a population of circulating microRNAs independent of vesicles in human plasma. Proc Natl Acad Sci USA. 2011;108:5003–8. doi: 10.1073/pnas.1019055108. [DOI] [PMC free article] [PubMed] [Google Scholar]
- 8.Turchinovich A, Weiz L, Langheinz A, Burwinkel B. Characterization of extracellular circulating microRNA. Nucleic Acids Res. 2011;39:7223–33. doi: 10.1093/nar/gkr254. [DOI] [PMC free article] [PubMed] [Google Scholar]
- 9.Turchinovich A, Weiz L, Burwinkel B. Extracellular miRNAs: the mystery of their origin and function. Trends Biochem Sci. 2012;37:460–5. doi: 10.1016/j.tibs.2012.08.003. [DOI] [PubMed] [Google Scholar]
- 10.Witwer KW. XenomiRs and miRNA homeostasis in health and disease: evidence that diet and dietary miRNAs directly and indirectly influence circulating miRNA profiles. RNA Biol. 2012;9:1147–54. doi: 10.4161/rna.21619. [DOI] [PMC free article] [PubMed] [Google Scholar]
- 11.Jiang M, Sang X, Hong Z. Beyond nutrients: food-derived microRNAs provide cross-kingdom regulation. Bioessays. 2012;34:280–4. doi: 10.1002/bies.201100181. [DOI] [PubMed] [Google Scholar]
- 12.Zhang Y, Wiggins BE, Lawrence C, Petrick J, Ivashuta S, Heck G. Analysis of plant-derived miRNAs in animal small RNA datasets. BMC Genomics. 2012;13:381. doi: 10.1186/1471-2164-13-381. [DOI] [PMC free article] [PubMed] [Google Scholar]
- 13.Petrick JS, Brower-Toland B, Jackson AL, Kier LD. Safety assessment of food and feed from biotechnology-derived crops employing RNA-mediated gene regulation to achieve desired traits: A scientific review. Regul Toxicol Pharmacol. 2013;66:167–76. doi: 10.1016/j.yrtph.2013.03.008. [epub ahead of print] [DOI] [PubMed] [Google Scholar]
- 14.Wang K, Li H, Yuan Y, Etheridge A, Zhou Y, Huang D, et al. The complex exogenous RNA spectra in human plasma: an interface with human gut biota? PLoS One. 2012;7:e51009. doi: 10.1371/journal.pone.0051009. [DOI] [PMC free article] [PubMed] [Google Scholar]
- 15.McAlexander MA, Phillips MJ, Witwer KW. Comparison of methods for miRNA extraction from plasma and quantitative recovery of RNA from plasma and cerebrospinal fluid. Front Genet. 2013;4:83. doi: 10.3389/fgene.2013.00083. [DOI] [PMC free article] [PubMed] [Google Scholar]
- 16.Hindson BJ, Ness KD, Masquelier DA, Belgrader P, Heredia NJ, Makarewicz AJ, et al. High-throughput droplet digital PCR system for absolute quantitation of DNA copy number. Anal Chem. 2011;83:8604–10. doi: 10.1021/ac202028g. [DOI] [PMC free article] [PubMed] [Google Scholar]
- 17.Watson AK, Witwer KW. Do platform-specific factors explain microRNA profiling disparities? Clin Chem. 2012;58:472–4, author reply 474-5. doi: 10.1373/clinchem.2011.175281. [DOI] [PubMed] [Google Scholar]
- 18.Mullokandov G, Baccarini A, Ruzo A, Jayaprakash AD, Tung N, Israelow B, et al. High-throughput assessment of microRNA activity and function using microRNA sensor and decoy libraries. Nat Methods. 2012;9:840–6. doi: 10.1038/nmeth.2078. [DOI] [PMC free article] [PubMed] [Google Scholar]
- 19.Peng P, Chan SW, Shah GA, Jacobsen SE. Plant genetics: increased outcrossing in hothead mutants. Nature. 2006;443:E8–, discussion E8-9. doi: 10.1038/nature05251. [DOI] [PubMed] [Google Scholar]
- 20.Lolle SJ, Victor JL, Young JM, Pruitt RE. Genome-wide non-mendelian inheritance of extra-genomic information in Arabidopsis. Nature. 2005;434:505–9. doi: 10.1038/nature03380. [DOI] [PubMed] [Google Scholar]
- 21.Wei LQ, Yan LF, Wang T. Deep sequencing on genome-wide scale reveals the unique composition and expression patterns of microRNAs in developing pollen of Oryza sativa. Genome Biol. 2011;12:R53. doi: 10.1186/gb-2011-12-6-r53. [DOI] [PMC free article] [PubMed] [Google Scholar]
- 22.Hirschi KD. New foods for thought. Trends Plant Sci. 2012;17:123–5. doi: 10.1016/j.tplants.2012.01.004. [DOI] [PubMed] [Google Scholar]
- 23.Kosaka N, Ochiya T. Unraveling the Mystery of Cancer by Secretory microRNA: Horizontal microRNA Transfer between Living Cells. Front Genet. 2011;2:97. doi: 10.3389/fgene.2011.00097. [DOI] [PMC free article] [PubMed] [Google Scholar]
- 24.Semenov DV, Baryakin DN, Brenner EV, Kurilshikov AM, Vasiliev GV, Bryzgalov LA, et al. Unbiased approach to profile the variety of small non-coding RNA of human blood plasma with massively parallel sequencing technology. Expert Opin Biol Ther. 2012;12(Suppl 1):S43–51. doi: 10.1517/14712598.2012.679653. [DOI] [PubMed] [Google Scholar]
- 25.Witwer KW. Data submission and quality in microarray-based microRNA profiling. Clin Chem. 2013;59:392–400. doi: 10.1373/clinchem.2012.193813. [DOI] [PMC free article] [PubMed] [Google Scholar]
- 26.Vandesompele J, De Preter K, Pattyn F, Poppe B, Van Roy N, De Paepe A, et al. Accurate normalization of real-time quantitative RT-PCR data by geometric averaging of multiple internal control genes. Genome Biol. 2002;3:H0034. doi: 10.1186/gb-2002-3-7-research0034. [DOI] [PMC free article] [PubMed] [Google Scholar]
- 27.Meyer SU, Kaiser S, Wagner C, Thirion C, Pfaffl MW. Profound effect of profiling platform and normalization strategy on detection of differentially expressed microRNAs--a comparative study. PLoS One. 2012;7:e38946. doi: 10.1371/journal.pone.0038946. [DOI] [PMC free article] [PubMed] [Google Scholar]
- 28.Witwer KW, Sarbanes SL, Liu J, Clements JE. A plasma microRNA signature of acute lentiviral infection: biomarkers of CNS disease. AIDS. 2011;204:1104–14. doi: 10.1097/QAD.0b013e32834b95bf. [DOI] [PMC free article] [PubMed] [Google Scholar]
- 29.Liang H, Zen K, Zhang J, Zhang CY, Chen X. New roles for microRNAs in cross-species communication. RNA Biol. 2013;10 doi: 10.4161/rna.23663. [epub ahead of print.] In press. [DOI] [PMC free article] [PubMed] [Google Scholar]
- 30.Mitchell PS, Parkin RK, Kroh EM, Fritz BR, Wyman SK, Pogosova-Agadjanyan EL, et al. Circulating microRNAs as stable blood-based markers for cancer detection. Proc Natl Acad Sci USA. 2008;105:10513–8. doi: 10.1073/pnas.0804549105. [DOI] [PMC free article] [PubMed] [Google Scholar]
- 31.Sisk JM, Clements JE, Witwer KW. miRNA profiles of monocyte-lineage cells are consistent with complicated roles in HIV-1 restriction. Viruses. 2012;4:1844–64. doi: 10.3390/v4101844. [DOI] [PMC free article] [PubMed] [Google Scholar]
- 32.Witwer KW, Watson AK, Blankson JN, Clements JE. Relationships of PBMC microRNA expression, plasma viral load, and CD4+ T-cell count in HIV-1-infected elite suppressors and viremic patients. Retrovirology. 2012;9:5. doi: 10.1186/1742-4690-9-5. [DOI] [PMC free article] [PubMed] [Google Scholar]
- 33.Snow JW, Hale AE, Isaccs SK, Baggish AL, Chan SY. Ineffective delivery of diet-derived microRNAs to recipient animal organisms. RNA Biology. 2013;10 doi: 10.4161/rna.25246. In press. [DOI] [PMC free article] [PubMed] [Google Scholar]
Associated Data
This section collects any data citations, data availability statements, or supplementary materials included in this article.