

Summary
Understanding BRCA1 mutant cancers is hampered by difficulties in obtaining primary cells from patients. We therefore generated and characterized 24 induced pluripotent stem cell (iPSC) lines from fibroblasts of eight individuals from a BRCA1 5382insC mutant family. All BRCA1 5382insC heterozygous fibroblasts, iPSCs, and teratomas maintained equivalent expression of both wild-type and mutant BRCA1 transcripts. Although no difference in differentiation capacity was observed between BRCA1 wild-type and mutant iPSCs, there was elevated protein kinase C-theta (PKC-theta) in BRCA1 mutant iPSCs. Cancer cell lines with BRCA1 mutations and hormone-receptor-negative breast cancers also displayed elevated PKC-theta. Genome sequencing of the 24 iPSC lines showed a similar frequency of reprogramming-associated de novo mutations in BRCA1 mutant and wild-type iPSCs. These data indicate that iPSC lines can be derived from BRCA1 mutant fibroblasts to study the effects of the mutation on gene expression and genome stability.
Highlights
-
•
Induced pluripotent stem cell (iPSC) lines from a BRCA1 mutant family were made
-
•
BRCA1 was elevated in iPSC lines compared with progenitor fibroblast lines
-
•
Protein kinase C-theta was elevated in mutant iPSCs and ER-negative breast cancer
-
•
Increased de novo mutations were found in only one BRCA1 mutant iPSC line
Twenty-four induced pluripotent stem cell (iPSC) lines were generated from a BRCA1 mutant family. Protein kinase C-theta (PKC-theta) was elevated in BRCA1 mutant compared to wild-type iPSC lines. PKC-theta was also increased in ER-negative breast cancers. A bioinformatic filter using the genome sequence of lymphoblasts, fibroblasts, and iPSCs from each patient identified reprogramming-associated de novo mutations. Increased mutation numbers were found in one of the BRCA1 mutant iPSC lines and none of the wild-type iPSC lines.
Introduction
BRCA1/2 mutations are autosomal-dominant mutations that dramatically increase the risk for developing breast and ovarian cancer, and to a lesser extent other malignancies, such as melanoma, pancreatic cancer, and prostate cancer (Futreal et al., 1994; Lancaster et al., 1996; Miki et al., 1994). The BRCA1 and BRCA2 tumor-suppressor proteins play roles in transcriptional regulation and DNA repair (Turner et al., 2004). BRCA1 also participates in cell-cycle regulation (McPherson et al., 2004), polyadenylation of messenger RNA (mRNA) (Kleiman et al., 2005), and ubiquitinylation (Baer and Ludwig, 2002). The cancers that arise in patients with inherited BRCA1 mutations appear to be more aggressive than those in patients with BRCA2 mutations or sporadic breast tumors. This aggressiveness is thought to result at least in part from the fact that BRCA1-deficient tumors, but not BRCA2-deficient tumors, are usually estrogen receptor (ER) and progesterone receptor (PR) negative (Turner et al., 2004) and therefore unresponsive to hormonal therapies. These observations suggest that the shared DNA repair functions of BRCA1 and BRCA2 do not solely account for differences in cancer incidence among patients with mutations in these genes. Evidence also indicates that cancer risk differs depending on the location of the mutation in the BRCA sequences (Risch et al., 2006). Examination of different BRCA1/2 mutant cells that are prone to tumor formation will identify new BRCA1 and BRCA2 tumor-suppressor functions.
One BRCA2 (BRCA2 6174 delT) and two BRCA1 (BRCA1 5382insC and BRCA1 185 delAG) founder mutations account for 90% of inherited BRCA1/2 mutations in patients of Ashkenazi Jewish descent (Petrucelli et al., 2010). Because 0.1% of the Ashkenazi population carries the BRCA1 5382insC mutation, we estimate that this mutation is present in approximately 10,000 individuals in the United States alone. A deeper understanding of how each of the Ashkenazi BRCA mutations leads to breast cancer is important because it will improve our understanding of phenotypic variabilities due to different mutations in the same gene.
Although mice genetically engineered to have either Brca1 or Brca2 deficiency have been informative models for studies of breast cancer development (Drost et al., 2011; Drost and Jonkers, 2009; Evers and Jonkers, 2006; Shakya et al., 2011), differences in underlying biology exist between humans and mice. Thus, human models are necessary to complement animal models. It has been reported that mutation of a single BRCA1 allele leads to genomic instability in human cells, a phenomenon not observed in mice (Konishi et al., 2011). Generation of induced pluripotent stem cells (iPSCs) (Takahashi et al., 2007) from patients carrying BRCA1/2 mutations may provide a window into the cellular phenotypic differences driving their increased cancer risk. BRCA1/2 mutant iPSC lines may also prove useful for screening therapeutic compounds for the prevention and treatment of genetically predisposed cancer patients.
To probe the cellular phenotypes of patients with BRCA1-associated cancers, we reprogrammed primary dermal fibroblasts from a family carrying the Ashkenazi BRCA1 5382insC mutation into 24 iPSCs. Here, we report on our characterization of these cell lines using in vitro and in vivo cellular differentiation assays as well as gene-expression and whole-genome sequencing (WGS) analyses.
Results
Generation of Wild-Type and BRCA1 5382insC Heterozygous iPSCs
Prior to this work, it was not known whether iPSCs could be generated from patients with BRCA1 mutations, due to the reported genome instability of cells heterozygous for these mutations (Konishi et al., 2011). We recruited a large family with BRCA1 mutant cells to donate samples for fibroblast reprogramming (Figure 1A; Table 1). We obtained skin biopsies from family members who spanned three generations and ranged in age from 20 to 90 years. Four family members had no mutation at the BRCA1 locus, and four were heterozygous for the BRCA1 5382insC mutation (Figure 1A). A prior reference to this family (Ross, 2012) noted that the index breast cancer patient (III.5) died at age 38. This patient was heterozygous for the family’s BRCA1 5382insC mutation, as her 22-year-old daughter (IV.3) carries the mutation (Figure 1A; Ross, 2012).
Figure 1.
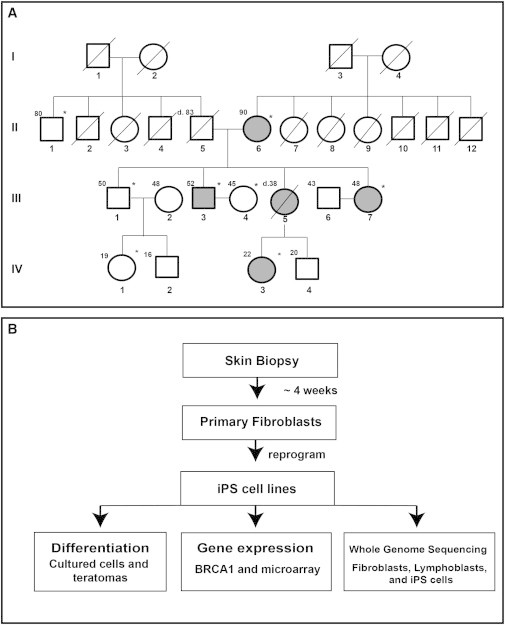
Pedigree and iPSC Generation and Characterization Flowchart
(A) The four-generation pedigree of the BRCA1 5382insC family. Patient identifiers are located below each symbol. Patient ages at the time of sample acquisition or death are located to the upper left of each symbol. Shaded symbols identify patients carrying the BRCA1 5382insC mutation. A diagonal line indicates deceased individuals. Asterisks identify patients whose skin samples were used for iPSC derivation.
(B) Flowchart for iPSC generation using nonintegrative mRNA and miRNA-based reprogramming, gene expression by microarray, qPCR, western blots, and whole-genome sequencing.
Table 1.
Clinical Characteristics and BRCA1 Status of the Study Subjects
| Patient No. | Agea and Gender | Cancer History (Age at Diagnosis) | BRCA1b | Other Health Issues |
|---|---|---|---|---|
| II.1 | 80 M | none | WT | none |
| II.2 | 87 M | pancreatic cancer (85), colon cancer (70) | WT | none |
| II.3 | 65 F | ovarian cancer (64) | WT | none |
| II.4 | 60 M | adrenal cancer (50) | WT | none |
| II.5 | 83 M | pheochromocytoma (50), lung adenocarcinoma (55), melanoma (78), bronchoalveolar lung (80) | WT | none |
| II.6 | 90 F | endometrial cancer (50), breast cancer (73) | mutant | monoclonal gammopathy of undetermined significance |
| III.1 | 50 M | none | WT | dysplastic nevi, chondroma (elbow), colon polyps |
| III.3 | 52 M | testicular cancer (28), prostate cancer (55) | mutant | none |
| III.4 | 45 F | none | WT | none |
| III.7 | 48 F | melanoma (38) | mutant | dysplastic nevi, endometrial atypia, focal nodular hyperplasia (liver), prophylactic surgeriesc |
| IV.1 | 19 F | none | WT | none |
| IV.3 | 22 F | none | mutant | none |
Age at the time of sample acquisition or at the time of death.
WT, wild-type for both BRCA1 alleles; mutant, BRCA1 5382insC heterozygous.
Bilateral mastectomies, hysterectomy, and oophorectomies.
To avoid the complications of insertional mutagenesis, which often occurs with retroviral expression of reprogramming factors in cells from an already cancer-prone BRCA1 family, were generated iPSC lines from fibroblasts using nonintegrating mRNA-based transfections to express the reprogramming factors (OCT4, SOX2, KLF4, LIN28, and c-MYC) (Warren et al., 2010). Primary fibroblasts were isolated from skin biopsies (II.1, II.6, III.1, III.3, III.4, III.7, IV.1, and IV.3; Figure 1B), and at passage 5 or 6, these cells were transfected with reprogramming factors and GFP (Warren et al., 2010). All eight fibroblast cultures exhibited similar transfection efficiencies, as measured by GFP protein expression during the course of daily transfections (data not shown). The majority of patient fibroblasts were reprogrammed within two attempts. Two samples, II.1 and III.1, both of which are wild-type at the BRCA1 locus, failed to be reprogrammed by mRNA alone after three attempts. They were then subjected to either one of two cocktails of microRNAs (miRNAs) previously used for reprogramming by Anokye-Danso et al. (2011) (mixture A) and Miyoshi et al. (2011) (mixture B). Cotransfection on days 1 and 4 with either miRNA mixture A or mixture B with the five-factor mRNA transfections led to the generation of iPSC-like colonies. We did not observe a significant change in iPSC colony frequency (colonies per number of cells transfected) in the presence of the BRCA1 5382insC mutation (Table S1 available online). On average, three independently derived clonal iPSC lines were selected and expanded from each patient’s fibroblasts (Table 2).
Table 2.
Summary of iPSC Derivation from Fibroblasts
| Fibroblast Samplesa | Reprogramming Methodb | iPSC Clones | Attempts to Reprogram | BRCA1 Statusc |
|---|---|---|---|---|
| II.1 | mRNA + miRNA | iPS.II.1.1, iPS.II.1.2, iPS.II.1.3, iPS.II.1.4 | 4 | WT |
| II.6 | mRNA | iPS.II.6.1, iPS.II.6.2, iPS.II.6.3 | 1 | mutant |
| III.1 | mRNA + miRNA | iPS.III.1.1, iPS.III.1.2 | 4 | WT |
| III.3 | mRNA | iPS.III.3.1, iPS.III.3.2, iPS.III.3.3 | 2 | mutant |
| III.4 | mRNA | iPS.III.4.1, iPS.III.4.2 | 1 | WT |
| III.7 | mRNA | iPS.III.7.1, iPS.III.7.2, iPS.III.7.3, iPS.III.7.4 | 2 | mutant |
| IV.1 | mRNA | iPS.IV.1.1, iPS.IV.1.2, iPS.IV.1.3 | 2 | WT |
| IV.3 | mRNA | iPS.IV.3.1, iPS.IV.3.2, iPS.IV.3.3 | 1 | mutant |
See also Table S1.
Skin samples were harvested from patients after they gave informed consent.
mRNA transfection (Warren et al., 2010) and miRNA choices and expression were as previously described (Anokye-Danso et al., 2011; Miyoshi et al., 2011).
WT, wild-type at both BRCA1 alleles; mutant, BRCA1 5382insC heterozygous.
Differentiation of Wild-Type and BRCA1 5382insC iPSCs
The 24 iPSC lines were characterized for pluripotency. As illustrated in the representative examples in Figure 2A, all isolated iPSC lines displayed an embryonic stem cell-like morphology and expressed pluripotency-associated antigens including TRA-1-60 (proteoglycan), TRA-1-81 (proteoglycan), SSEA3 (carbohydrate), SSEA4 (glycolipid), and NANOG (Figures 2A and S1; data not shown). No significant differences in morphology or other growth patterns between the BRCA1 wild-type and mutant iPSCs were noted. To further evaluate the pluripotency of the iPSCs and to determine whether functional differences in differentiation capacity existed between the wild-type and mutant cell lines, all iPSC lines were induced in culture to differentiate into cells representative of all three germ layers. Analysis of lineage-specific protein expression by immunofluorescence indicated that the iPSC lines readily differentiated into cells of the ectoderm (assessed by PAX6 and βIII-tubulin expression), mesoderm (BRACHYURY and GATA4 expression), and endoderm (FOXA2 and SOX17 expression; Figures 2B and S2). No differences in differentiation potential between wild-type and BRCA1 5382insC mutant iPSCs were observed.
Figure 2.
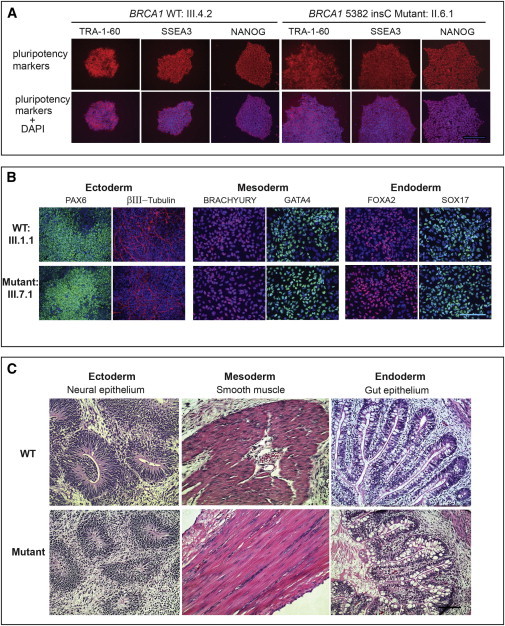
Generation and Analysis of iPSC Lines from Wild-Type and BRCA1/5382insC Heterozygous Fibroblasts
(A) Representative iPSC colonies derived from BRCA1 wild-type (III.4.2) and heterozygous (II.6.I) mutant fibroblasts. All iPSC lines stained positive for the pluripotency markers TRA-1-60, SSEA3, and NANOG. The nucleus was stained with DAPI. The scale bar represents 100 μm.
(B) In-vitro-directed differentiation and analyses of lineage-specific genes in representative wild-type and mutant iPSC lines from (A). The ectoderm was identified with PAX6 and β-tubulin, mesoderm was identified with BRACHYURY and GATA4, and endoderm was identified with FOXA2 and SOX17. The nucleus was stained with DAPI. The scale bar represents 50 μm.
(C) Representative histological analysis showing in vivo differentiation of wild-type (WT, top) and mutant (bottom) iPSC lines into teratomas with tissue components that represent all three germ layers: ectoderm (neural epithelium; patients III.4.2 and III.3.2), mesoderm (muscle; patients IV.1.3 and II.6.2), and endoderm (gut; patients IV.1.3 and III.7.1). Sections were stained with hematoxylin and eosin. The scale bar represents 50 μm.
See also Figures S1–S3 and Table S1.
To observe in vivo differentiation capacities of BRCA1 wild-type and mutant iPSCs, each cell line was injected into the kidney capsule of nonobese diabetic (NOD)/severe combined immunodeficiency (SCID) mice and observed for teratoma formation and composition. Once tumors formed, the histopathology of the tumors was evaluated for mesoderm-, ectoderm-, and endoderm-derived tissues. The ability to form benign teratomas containing tissues from all three germ layers is an inherent characteristic of iPSCs. Figure 2C displays histologic sections from representative BRCA1-mutant- and wild-type iPSC-derived teratomas, and demonstrates the presence of tissues from all three germ layers. The ectoderm is represented by the neural epithelium, the mesoderm is represented by muscle, and the endoderm is represented by gut epithelium. All iPSC lines formed teratomas in vivo without obvious differences in their differentiation patterns (Figure S3). Invasive cancers were not observed in any of the BRCA1 wild-type or mutant teratomas.
BRCA1 mRNA Expression Levels in Fibroblasts, iPSCs, and Teratomas
Because the BRCA1 mutant fibroblasts reprogrammed so readily, we hypothesized that rare fibroblasts with loss of heterozygosity (LOH) at the BRCA1 locus or loss of BRCA1 expression might have been present in the skin biopsies, and that these cells were under positive selection during reprogramming. The process of reprogramming has been reported to be similar to tumorigenesis (Riggs et al., 2013), which is supported by the fact that p53 deficiency enhances reprogramming (Hong et al., 2009). To compare total BRCA1 expression levels in fibroblasts and iPSCs, we measured the absolute levels of BRCA1 transcripts using quantitative PCR (qPCR). Wild-type and heterozygous mutant fibroblasts expressed, on average, similar levels of total BRCA1 with 70 copies/ng total RNA, and a 2-fold upregulation of total BRCA1 transcript was observed in all derivative iPSCs (n = 24) upon reprogramming (Figure 3A). This differential expression of the BRCA1 gene was confirmed at the protein level (Figure 3A, inset). Because BRCA1 is thought to be involved in differentiation of luminal mammary progenitors into luminal epithelial cells (Lim et al., 2009), it was somewhat of a surprise that BRCA1 levels increased upon dedifferentiation; however, this increase may be required to maintain genomic stability in iPSCs. In fact, increased expression of DNA damage repair genes in two iPSC lines as compared with two differentiated fibroblast lines have been observed previously (Momcilovic et al., 2010).
Figure 3.
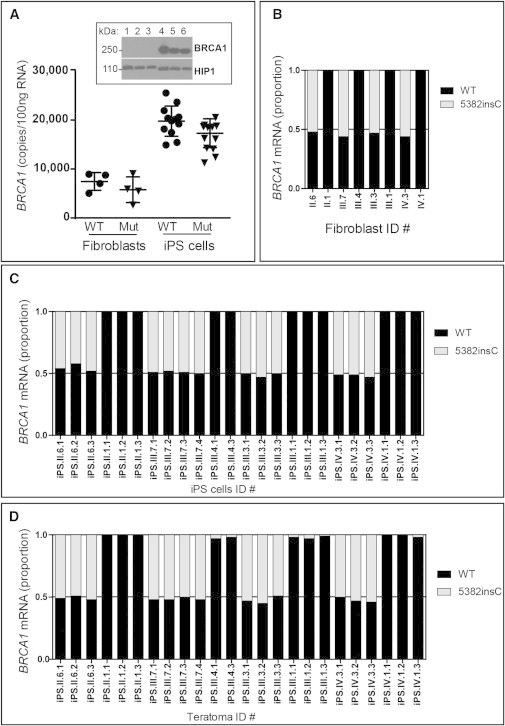
BRCA1 Wild-Type and Mutant Expression in Fibroblasts, iPSCs, and Teratomas
(A) qPCR for absolute BRCA1 mRNA levels in wild-type (WT) and BRCA1 5382insC fibroblasts and iPSCs. Reprogramming led to a doubling of total BRCA1 mRNA in iPSCs. A total of eight fibroblast cell lines and 24 iPSC lines were analyzed. Each point is an average of three replicate PCR reactions. The difference in expression of BRCA1 between the iPSCs and fibroblasts was statistically significant (Pearson chi squared, p < 0.001). The western blot for BRCA1 (top panel) in six BRCA1 WT fibroblast (lanes 1–3) or iPSC (lanes 4–6) lines confirmed that the BRCA1 protein is also induced with reprogramming. The HIP1 protein was used as a loading control and migrates faster when derived from iPSC extracts compared with fibroblast extracts (bottom panel).
(B) Allele-specific qPCR was used to quantitate the relative levels of WT (black bar) and mutant (gray bar) BRCA1 mRNA in fibroblasts. The eight fibroblast cell lines were analyzed with three replicate reactions and averaged. There were no significant differences in expression of the WT and mutant alleles.
(C) qPCR, as in (B), was used to quantitate the relative levels of WT (black bar) and mutant (gray bar) BRCA1 mRNA in iPSC lines. The 24 iPSC lines were analyzed with three replicate reactions and averaged. There were no significant differences in expression of the WT and mutant alleles.
(D) qPCR, as in (B), was used to quantitate the relative levels of WT (black bar) and mutant (gray bar) BRCA1 mRNA in teratomas. RNAs from the 24 teratomas were analyzed with three replicate reactions and averaged. There were no significant differences in expression of the WT and mutant alleles.
See also Figure S4.
To explore the possibility of BRCA1 LOH or a compensatory alteration in the expression levels of either the BRCA1 wild-type or mutant alleles in the mutant iPSCs during reprogramming, we quantified BRCA1 wild-type or mutant allele-specific expression in the patient fibroblasts, iPSCs, and teratomas. To quantify the absolute levels of BRCA1 wild-type and mutant transcripts, we designed mismatched primers that specifically amplified either the wild-type or mutant mRNA (Figure S1). Wild-type and mutant BRCA1 transcripts were present at equivalent levels in the heterozygous fibroblasts (Figure 3B). Thus, mutant cells (II.6, III.3, III.7, and IV.3) exhibited a 50% decrease in the absolute amount of wild-type BRCA1 transcript compared with fibroblasts with two wild-type BRCA1 alleles (II.1, III.1, III.4, and IV.1). All of the mutant iPSC lines (Figure 3C) and teratomas (Figure 3D) also expressed equivalent levels of both wild-type and mutant transcripts, indicating that neither the wild-type nor the mutant alleles were lost during the reprogramming process or during differentiation into teratomas, and that BRCA1 haploinsufficiency persisted. Hence, there was no evidence for silencing or loss of the wild-type BRCA1 allele during reprogramming. This was a surprise because LOH of tumor suppressors, such as p53, promotes reprogramming (Hong et al., 2009).
Transcriptional Profiles of Mutant and Wild-Type iPSCs
Since the ability to differentiate in vitro and in vivo was similar between BRCA1 wild-type and mutant iPSCs, we evaluated the mutant and wild-type iPSCs for molecular differences. We used genome-wide microarray expression analysis to determine whether the BRCA1 mutant iPSCs had a unique gene-expression signature compared with the wild-type iPSC lines. Expression differences (≥2-fold) between the mutant and wild-type lines were evaluated further only if those expression changes were observed in all mutant lines. Only one gene, PRKCQ, the gene that encodes protein kinase C-theta (PKC-theta), was dysregulated in all of the 13 mutant iPSC lines compared with the 11 wild-type lines (Figure 4A). No differential gene expression between wild-type and mutant iPSC lines was observed for other members of the PRKC gene family (Figure 4B). The specific upregulation of PKC-theta in BRCA1 mutant iPSCs was readily confirmed by qPCR (Figure 4C) and western blot analysis (Figure 4D). Analysis for differential expression of PKC-theta in BRCA1 wild-type and mutant fibroblasts was not possible because PKC-theta expression was undetectable in the fibroblasts by qPCR (Figure 4C). Notably, gene-expression analysis of the eight dermal fibroblast cultures did not uncover any specific gene-expression changes between BRCA1 mutant and wild-type fibroblasts. As might be expected for two different cell types, comparison of gene expression between fibroblasts and iPSC lines uncovered thousands of differentially expressed genes, with approximately 5,000 upregulated and 5,000 downregulated genes (data not shown).
Figure 4.
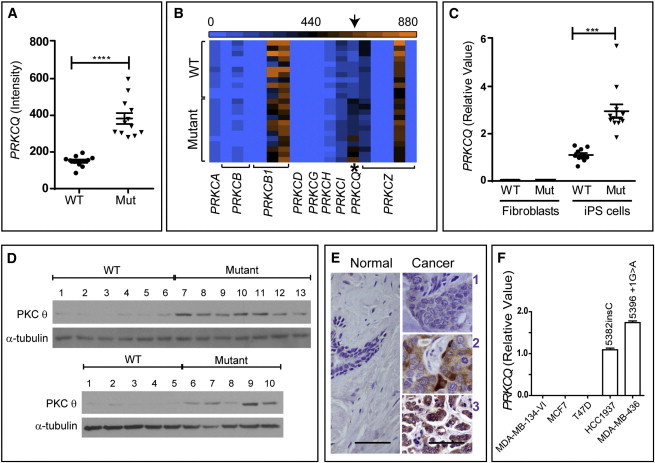
Gene-Expression Profiling Identified Upregulation of PRKCQ in BRCA1 Mutant iPSCs
(A) Microarray analysis of gene expression identified PRKCQ, the gene for PKC-theta, as a consistently differentially upregulated gene in BRCA1 5382insC iPSC lines (p < 0.001). Twenty-four iPSC lines were analyzed. Eleven were WT and the other 13 were mutant.
(B) The relative expression levels (blue, zero expression; orange, highest expression) of other members of the PKC family exhibited no significant differences between WT and mutant iPSC lines.
(C) qPCR showed that fibroblast lines express very low levels of PKC-theta relative to iPSC lines and that PKC-theta is elevated in BRCA1 mutant iPSCs (p < 0.001). A total of eight fibroblast cell lines and 24 iPSC lines were analyzed. Each point is an average of three replicate PCR reactions. The difference in expression of BRCA1 between the iPSC lines and fibroblast lines was statistically significant (Pearson chi squared, p < 0.001).
(D) Immunoblot analysis confirmed that PKC-theta protein was also increased in all BRCA1 mutant heterozygous iPSC lines. (Top) lanes 1–6: BRCA1 WT iPSC lines (iPS.II.1.1, iPS.II.1.2, iPS.II.1.3, iPS.III.4.1, iPS.III.4.3, and iPS.III.1.1); lanes 7–13: BRCA1 mutant iPSC lines (iPS.III.7.4, iPS.III.7.1, iPS.III.7.2, iPS.III.7.3, iPS.II.6.1, iPS.II.6.2, and iPS.II.6.3). (Bottom) lanes 1–5: BRCA1 WT iPSC lines (iPS.III.1.2, iPS.III.1.3, iPS.IV.1.1, iPS.IV.1.2, and iPS.IV.1.3); lanes 6–10: BRCA1 mutant iPSC lines (iPS.IV.3.1, iPS.IV.3.2, iPS.IV.3.3, iPS.III.3.1, and iPS.III.3.2).
(E) PKC-theta immunohistochemistry of representative breast tumors (right-hand panels) that have weak (1), intermediate (2), or strong (3) stains. The normal tissue stains weakly (1) for PKC-theta (left). Scale bars represent 50 μm.
(F) qPCR showed that BRCA1 mutant breast cancer cell lines (HCC1937 and MDA-MB-436) expressed higher levels of PKC-theta compared with the tested WT breast cancer cell lines.
See also Table S2.
PKC-theta Protein Expression in Breast Cancer Tissue
These data document the association of elevated PKC-theta levels with a BRCA1 mutation. Because the overexpression was readily detected in dedifferentiated iPSCs, we sought to examine PKC-theta overexpression in breast tumors, another dedifferentiation condition. PKC-theta is a member of the tumor-promoting PKC serine/threonine kinase family (Griner and Kazanietz, 2007), and this kinase is overexpressed in most gastrointestinal stromal tumors (GISTs) (Blay et al., 2004; Ou et al., 2008; Wong and Shelley-Fraser, 2010) and has recently been found to be elevated in ER-negative mouse breast cancers induced by a c-rel transgene (Belguise and Sonenshein, 2007). Because PKC-theta has been evaluated extensively for expression in GISTs, we used the same assay to stain breast cancer samples (n = 47) and found that PKC-theta was upregulated in more than half of these patients’ tumors compared with normal tissue (see Figure 4E; Table S2). PKC-theta was not expressed in normal breast epithelium (n = 39; nine samples were matched to patient tumors), consistent with reports of restricted PKC-theta expression in T lymphocytes, platelets, and skeletal muscle (Isakov and Altman, 2012). Tumors that expressed high levels of PKC-theta were more frequently ER/PR negative than those that did not express PKC-theta. And tumors with low PKC-theta expression were often ER/PR positive (55%), compared to only 22% ER/PR positivity among tumors with high PKC-theta expression (Table S2; p < 0.03). No significant correlation was found between PKC-theta staining intensity and Her2/neu, p53, or tumor stage (Table S2).
Whether PKC-theta is overexpressed in tumors from the subset of breast cancer patients with germline BRCA1 mutations and whether this factor is a predictive marker or therapeutic target for some breast cancers is unknown. Here, we found that out of five tested breast cancer cell lines, the two breast cell lines known to have deleterious C-terminal BRCA1 frameshift (HCC1937 has the BRCA1 5382insC mutation of the family studied here) or truncation (MDA-MB-436 has the BRCA1 5396+1G > A mutation) mutations had significantly higher PKC-theta mRNA levels (Figure 4F). The other three breast cancer cell lines known to have wild-type BRCA1 (MDA-MB-134-VI, MCF7 and T47D) did not express PKC-theta.
Whole-Genome Sequence Analysis of iPSC Lines
To determine whether increased expression of PKC-theta in BRCA1 mutant iPSCs resulted from an accumulation of distinct de novo mutations during the reprogramming process, we performed WGS on all 24 iPSC lines, their parental fibroblasts, and matched lymphoblasts to identify de novo mutations. It has been reported that the process of reprogramming results in de novo coding mutations in iPSCs (Gore et al., 2011; Ji et al., 2012; Ruiz et al., 2013).
Variants identified by WGS were conservatively analyzed to reduce the number of false-positive de novo mutations. Because putative de novo variants are often false positives with low sequence quality, we saw an enrichment of de novo variants with low-quality scores compared with variants annotated in the Single Nucleotide Polymorphism database (dbSNP; Figure 5A). A stringent quality threshold was used to filter de novo variants (see the Experimental Procedures). The performance of quality control (QC) filtering was assessed using two methods: (1) measuring genome-wide genotype concordance between matched fibroblast and lymphoblast genomes and (2) Sanger sequence validation of randomly selected variants. Genome-wide genotype concordance between the fibroblast and lymphoblast genomes after QC filtering was >98.45% (data not shown), and Sanger sequencing confirmed 85% of the called variants (Table S3).
Figure 5.
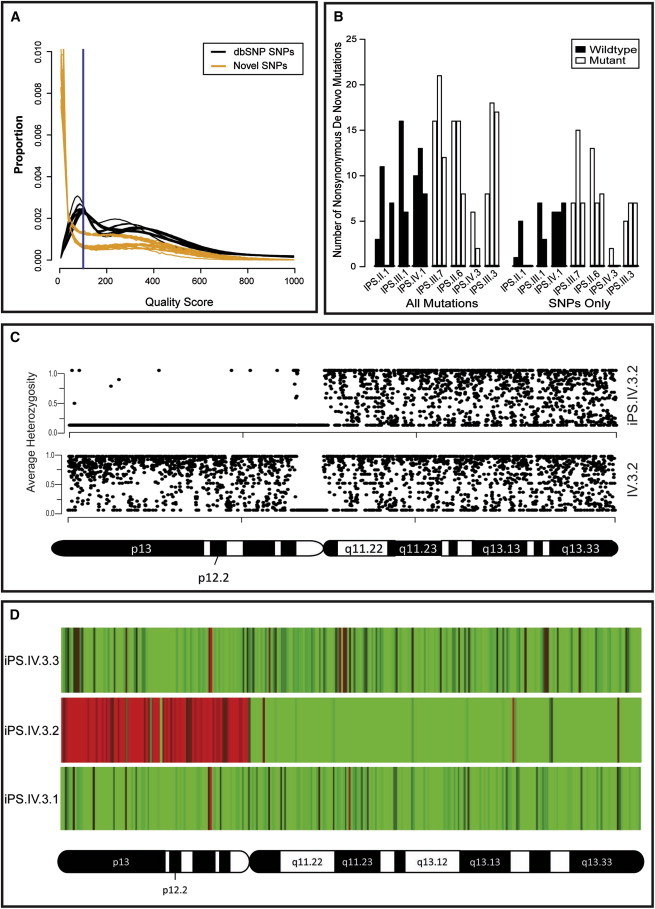
Whole-Genome Sequence Analysis of iPSC Lines
(A) Distribution of quality scores for genome-wide SNPs annotated in the dbSNP database (black) compared with de novo SNPs (yellow). The y axis “proportion” is the frequency of all identified variants (numerical distribution). Each line represents a single genome’s distribution (iPSC, fibroblast, or lymphoblast line). De novo variants are generally called with low quality. A quality score threshold of 100 (blue line) was used to exclude potential false-positive sequencing errors called at low quality.
(B) Frequency of de novo nonsynonymous mutations in iPSC lines with WT and mutant BRCA1. No significant difference in the frequency of de novo nonsynonymous mutations was observed between WT (n = 9) and mutant (n = 11) BRCA1 iPSC lines. The iPS.IV.3.2 outlier was excluded from this analysis. “All” mutations include SNPs and indels (left-hand side) and “SNPs only” (right-hand side) are displayed as bars that represent the numbers of de novo variants identified per cell line. We calculated p values to detect differences in mutation frequency between mutant and WT using Student’s unpaired t test. No significant differences were identified (p < 0.08 and p < 0.06 for “All” and “SNPs only,” respectively).
(C) De novo LOH of chromosome 20p in iPS.IV.3.2 (upper panel) as determined from the average heterozygosity of SNPs using a 20 KB segmented window. No LOH was detected in the matched fibroblast sample (lower panel).
(D) Copy-number variation in chromosome 20p of iPS.IV.3.2 was confirmed by transcriptional profiling of genes on this chromosome. Heatmaps show the fold change in expression in iPS.IV.3.1, iPS.IV.3.2, and iPS.IV.3.3 versus the average expression level in the other 21 iPSC lines. Red, <0.5-fold; green, >2.0-fold.
See also Figure S5, Table S3, and Tables S4–S6.
Nonsynonymous sequence variants identified by WGS of each iPSC line were analyzed to identify high-confidence de novo mutations (Table S4). To distinguish de novo nonsynonymous coding mutations from those inherited from small populations of parental fibroblasts, we excluded iPSC line mutations present in the matched fibroblast and/or lymphoblast sequences. This effectively excluded 98.6%–99.5% of nonsynonymous variants. Because the iPSCs in this study were generated from related individuals, we further refined our analysis by excluding mutations present in iPSCs, fibroblast, and/or lymphoblast sequences of other related individuals. This additional layer of filtering allows for improved specificity in determining whether a variant is a true or false positive call (Gore et al., 2011; Ji et al., 2012; Ruiz et al., 2013). It also reduces the chance of mistakenly categorizing a false-negative variant in the parental fibroblasts as de novo in the iPSCs. Because de novo mutations are not likely to appear in public databases such as the 1000 Genomes Project and the NHLBI Exome Variant Server, we removed all putative de novo mutations that appeared in these databases. Finally, because de novo mutations are unlikely to occur in more than one iPSC line (unless of course they are selected for biological reasons), we compared de novo mutations between iPSC lines and excluded mutations present in more than one cell line. As expected, we observed a decrease in the median quality score of variants throughout out analysis (Figure S4). Sequence analysis identified on average 10.7 nonsynonymous de novo mutations per iPSC line, ranging from no mutations to 21 mutations (Table S5), not including the iPSC line iPS.IV.3.2, which had a uniquely ∼12-fold higher number of de novo nonsynonymous mutations. Pathway analysis failed to identify any specific enrichment for de novo nonsynonymous mutations regardless of BRCA1 mutation status (data not shown), suggesting a random distribution of de novo mutations throughout the genome. Consistent with this, the frequency of de novo nonsynonymous mutations was significantly correlated with the frequency of genome-wide de novo mutations for both SNPs and insertion/deletions (r = 0.79, p = 0.00003787) and SNPs alone (r = 0.82; p = 0.0000164).
Since heterozygosity for BRCA1 mutations has been reported to result in genomic instability (Konishi et al., 2011), we expected to observe an increased frequency of de novo mutations in the BRCA1 mutant iPSCs compared with wild-type iPSCs. We compared the number of nonsynonymous de novo mutations in BRCA1 wild-type (n = 9) versus mutant (n = 11) iPSC lines to determine whether iPSC lines heterozygous for the BRCA1 5382insC mutation had an increased frequency of mutations. No statistically significant difference was observed in the number of de novo nonsynonymous SNPs and insertions/deletions (p = 0.08053) or SNPs alone (p = 0.06208; Figure 5B; Table S5). Likewise, the number of genome-wide de novo SNPs and indels or SNPs alone was not significantly different between the BRCA1 wild-type and mutant iPSC lines (Table S6). From these data, we conclude that although de novo mutations do occur during the reprogramming of fibroblasts into iPSCs with mRNA transfection technology (Warren et al., 2010), BRCA1 haploinsufficiency does not significantly increase mutation frequency in coding or noncoding regions of the iPSC genome.
One iPSC line (iPS.IV.3.2) displayed all of the normal morphological characteristics and differentiation capabilities assayed in our screen for normal iPSC lines, but acquired ∼12 times as many de novo mutations as all other iPSC lines (Tables S5 and S6). Although the cause of this genomic instability is not known, a de novo nonsense mutation in PALB2 (Q1004X) was identified by WGS and confirmed by Sanger sequencing. PALB2 binds to the coiled-coil domain of BRCA1 and collaborates with BRCA1 in homologous recombination DNA repair (Sy et al., 2009). Additionally, germline PALB2 mutations have been implicated in familial pancreatic cancer syndromes (Jones et al., 2009). It remains possible that mutations in both BRCA1 and PALB2 lead to increased genome instability. In addition to an increased frequency of de novo mutations, iPS.IV.3.2 had de novo structural abnormalities. WGS coverage analysis suggested copy-number variation of chromosome 20, including loss and gain of copy number of the entire short (p-arm) and long (q-arm) arms, respectively. LOH analysis confirmed de novo LOH for chromosome 20p (Figure 5C). Consistent with this, expression analysis showed expected changes in gene expression based on the copy-number variations of genes on the p-arm of chromosome 20 compared with other iPSC lines from patient IV.3 (Figure 5D).
Discussion
We report the generation of a series of iPSC lines from individuals with the BRCA1 5382insC mutation, which is a well-known predictor of high risk for breast and ovarian cancer (Futreal et al., 1994). Generation of iPSCs from individuals with BRCA1 mutations provides an opportunity to examine why cancer develops more frequently in these patients. In this study, it was easier to reprogram the mutant fibroblasts than the fibroblasts from relatives without the BRCA1 mutation. Determining whether this difference is due to the mutation itself or simply to line-to-line variations due to other characteristics (e.g., growth characteristics and handling) will require the generation of iPSCs from additional families and/or heterozygous mice with BRCA1 mutations. Our data contrast with those obtained by González et al. (2013) from mouse embryonic fibroblasts (MEFs), in which homozygous mutations of Brca1 led to reprogramming defects. Those authors did not include MEFs from heterozygous Brca1 mutant embryos, and the human BRCA1 mutations we used are different from the mouse Brca1 mutations used in their study. Finally, the parental fibroblasts in the mouse experiments were embryonic, whereas our fibroblasts were adult. The reprogramming experiments in mice with the BRCA1 5382insC mutation reported here, and TALEN-mediated targeting of the remaining human wild-type BRCA1 allele in the heterozygous iPSC or fibroblast lines generated in this study will begin to address these differences.
We observed that mutant and wild-type BRCA1 alleles were expressed at equivalent levels in fibroblasts and their derivative iPSCs and teratomas. There was also a specific upregulation of PKC-theta in the BRCA1 5382insC iPSCs compared with the wild-type iPSCs. A functional relationship between BRCA1 and PKC-theta levels may involve the known interaction of BRCA1 with the HDAC2 complex (Chang et al., 2011) or the role of BRCA1 as a transcription factor (Haile and Parvin, 1999; Horwitz et al., 2006; Schlegel et al., 2000).
A related finding in this report is that PKC-theta is overexpressed in some breast tumors. PKC-theta has been found to be a reliable marker of GISTs (Blay et al., 2004; Motegi et al., 2005; Ou et al., 2008), and prior reports have suggested that PKC activity, although not specifically PKC-theta activity, is upregulated in a subset of breast cancers (Gordge et al., 1996; O’Brian et al., 1989). We found PKC-theta to be upregulated in a fraction of breast tumors that are frequently hormone-receptor negative, a characteristic of BRCA1 mutant tumors. Because of the tumorigenic potential of PKC-theta, these results suggest that lower levels of PKC-theta in the presence of wild-type BRCA1 may be a mechanism for the tumor-suppressor function of BRCA1. In fact, Belguise et al. determined that PKC-theta is elevated in ER-negative human breast cancer cell lines (Belguise et al., 2012) and NF-kappaB-induced mouse breast tumors (Belguise and Sonenshein, 2007). They showed that PKC-theta inhibits ER expression. The MDA-436 BRCA1 mutant cell line, which expresses PKC-theta at levels higher than any of the other ER-negative breast cancer lines tested in their report, was the only BRCA1 mutant cell line they analyzed (Belguise et al., 2012). However, all of the ER-negative lines that were found to have high PKC-theta have been reported to be haploinsufficient for BRCA1 (Elstrodt et al., 2006). Upregulation of PKC-theta in our BRCA1 mutant iPSCs may be direct or indirect. If BRCA1 is directly upstream of PKC-theta, this would explain why BRCA1 mutant breast cancers are frequently ER negative (Hosey et al., 2007).
Although our work with BRCA1 mutant iPSCs led to our investigation of PKC-theta upregulation in human breast tumors, future studies will be necessary to validate whether PKC-theta can be used as a biomarker or therapeutic target in BRCA1 mutant tumors. Because the frequency of BRCA1 mutations in patients with breast cancer is only 5%–10%, but we found PKC-theta to be elevated in greater than half of the breast tumors in this study, the PKC-theta upregulation must occur in some tumors without BRCA1 mutations. PKC-theta elevation does support the consideration of this protein as a new drug target, with potential applications in patients with BRCA1 mutations (Figure 4E; Table S1).
Through our use of WGS, we increased the depth of our characterization of iPSCs to include not just cellular but also genetic changes that occur during the reprogramming process in BRCA1 mutant cells. It has been reported that reprogramming of differentiated cells to a pluripotent state results in an estimated 6 protein-coding point mutations per exome (Gore et al., 2011). By comparing the WGS of iPSCs generated in this study with not only their fibroblast progenitors but also the fibroblasts of related individuals, we increased the ability to remove mutations that are not de novo but instead are inherited from the fibroblast progenitors. To our surprise, the WGS approach identified only slightly higher numbers of de novo nonsynonymous mutations than Gore et al., although the small difference can be attributed to the difficulty of calling high-confidence insertion/deletion mutations using hybridization capture/sequencing methods (Gore et al., 2011). If we consider only SNP mutations, our results (average 6.7 nonsynonymous de novo SNPs per iPSC line) are consistent with previous reports (Gore et al., 2011). To our further surprise, through this analysis we did not find a statistically significant difference in the number of de novo nonsynonymous mutations in BRCA1 wild-type versus mutant iPSC lines. This contrasts with the prior report that the human BRCA1 heterozygous state is genetically unstable (Konishi et al., 2011). It is intriguing to speculate about why our result differs from theirs. Konishi et al. analyzed genome stability in breast epithelial cells, which are known to be susceptible to BRCA1 mutant tumorigenesis. Because our genome analyses were conducted in stem cells, it will be important to analyze the genomes of their derivative epithelial cells. One exception to the surprising lack of genome instability in BRCA1 mutant iPSC lines was the mutant iPSC line iPS.IV.3.2, which harbored >10-fold more de novo mutations than the other iPSC lines. Although this resulted in significant differences in the gene-expression profiles, we could not readily identify a functional consequence of this genomic instability using standard iPSC characterization techniques. This indicates that WGS of iPSC lines prior to biological study is warranted.
In conclusion, we have generated and characterized patient-derived iPSC lines with a BRCA1 mutation and identified a correlation between BRCA1 mutations and PKC-theta expression. Similar analyses of other mutant iPSC lines may lead to the discovery of other molecular consequences that result from specific mutations associated with BRCA1. These data should encourage others to generate iPSC lines from families with mutations that confer a high cancer risk.
Experimental Procedures
Generation and Characterization of Human iPSCs
Primary fibroblasts were established from skin biopsies taken from wild-type and BRCA1 5382insC heterozygous mutant family members shown in Figure 1A and Table 1 after informed consent and with institutional review board approval. Skin-punch (forearm) biopsies were cultured in six-well plates at 37°C in 5% CO2 in 1 ml Dulbecco’s modified Eagle’s medium (DMEM) with 10% fetal bovine serum, penicillin, and streptomycin until fibroblasts migrated out from the skin explants. The iPSCs were generated by nonintegrative mRNA-based reprogramming using a cocktail of mRNAs (and in some cases miRNAs) for OCT4, SOX2, KLF4, LIN28, and c-MYC as previously described (Anokye-Danso et al., 2011; Miyoshi et al., 2011; Warren et al., 2010). All 24 cell lines are available for research purposes.
In Vitro and In Vivo Differentiation into Teratomas
iPSCs were subjected to directed differentiation in vitro as previously described (Chambers et al., 2009; D’Amour et al., 2005, 2006). For the teratoma formation assays, iPSCs (approximately 1–2 × 10⁶ cells) were injected into the kidney capsules of immunodeficient NOD/SCID mice. Teratomas were harvested 10–16 weeks later. A small portion from each teratoma was extracted for RNA analysis and the rest was fixed in PBS containing 4% paraformaldehyde for histology.
mRNA Expression Profiling in Fibroblasts and iPSCs
For gene-expression analysis in primary fibroblasts and iPSC lines, labeled complementary RNA was hybridized to an HT-12v4 BeadChip (Illumina). Data analysis was performed via fold-change analysis of relative signal intensities followed by Student’s paired t test. A p value < 0.05 was considered significant.
RNA Isolation and qPCR Analysis of Gene Expression
RNA was purified with Trizol (Invitrogen) and treated with DNAase (QIAGEN) to remove genomic DNA contamination. One microgram of total RNA was used for the reverse transcriptase reaction using Script III (Invitrogen) and random hexamer primers according to manufacturer’s instructions. qPCR was performed using the StepOnePlus Real-Time PCR system (Applied Biosystems) with the Taqman gene-expression master mix. Mismatched primer sequences for BRCA1 gene analysis are described in Figure S1. Standard Taqman primers for PRKCQ were purchased from Invitrogen.
Immunohistochemistry
Tissue microarrays (IMH-364 and IMH-371) of breast cancers and normal adjacent tissues were purchased from Imgenex and subjected to staining with anti-PKC-theta antibody (mAb 27; BD Bioscience) as previously described (Motegi et al., 2005). Scoring was performed by two scorers (D.R. and T.S.R.) using intensity scores of 1–3 (1, weak staining; 2, intermediate staining; 3, strong staining).
Western Blot Analysis
The iPSCs were homogenized in 1× RIPA buffer (Cell Signaling Technology) containing 1 mM phenylmethylsulfonyl fluoride, centrifuged at 10,000 rpm for 15 min at 4°C, and protein quantitated (DC assay; BioRad). Eighty micrograms of total protein was resolved on SDS-PAGE, transferred to nitrocellulose, and blotted for PKC-theta (mAb 27; BD Biosciences), α-tubulin, anti-HIP1 4B10 monoclonal, and BRCA1 monoclonal (Abcam).
WGS and De Novo Mutation Identification
WGS using the combinatorial probe-anchor ligation method was performed by Complete Genomics as previously described (Drmanac et al., 2010). WGS of all iPSC lines, fibroblasts, and lymphoblasts generated sufficient coverage for variant calling and copy-number analysis, both performed by Complete Genomics. QC was performed by excluding iPS variants if (1) the variant position was “no-called” in two or more samples (to remove genomic regions that would be difficult to assemble using short-read technology) or (2) the variant quality score was <100. QC was confirmed by measuring concordance between matched fibroblast and lymphoblast samples (>98.45) and direct Sanger sequencing of randomly selected mutations (85% confirmed). Nonsynonymous iPSC variants passing the QC filters were analyzed to identify de novo mutations by excluding (1) variants in the fibroblast or lymphoblast of sample-matched or related family members, (2) variants annotated in the Exome Variant Server containing ∼6,500 exomes or the 1000 Genomes database, or (3) variants present in any of 54 samples sequenced by Complete Genomics or whole-exome sequenced using the Illumina platform (Table S3). Finally, similarly to previous reports (Gore et al., 2011), only variants present in single iPSC lines were considered de novo.
LOH analysis of SNPs passing the QC filters was performed on iPS.IV.3.2 and the matched fibroblast (Fb.IV.3). Average heterozygosity was calculated using a 20 KB segmented window and plotted along the entire chromosome 20.
Confirmation of De Novo Mutations by Sanger Sequencing
For each iPSC line, a subset of the putative de novo mutations was selected for confirmation by Sanger sequencing. DNA was extracted from iPSC and fibroblast cell lines by standard procedures. Primers were designed using Primer Express 3.0 software to amplify the genomic region in which each mutation was located. The cycling conditions were as follows: 4 min at 94°C, 40 cycles of 1 min at 94°C, 30 s at the appropriate annealing temperature for each primer (49–54°C), 1 min at 72°C, and 72°C for 5 min. PCR products were resolved on a 1%–2% agarose gel. PCR products were purified using the QiaQuick Gel Extraction Kit (QIAGEN) and sequenced.
Acknowledgments
We are grateful to members of the anonymous family for their generous participation as research subjects and to Ms. Katie Wood and Drs. Victoria Mgbemena, Sean Morrison, Guangwen Wang, and Anj Dlugosz for intellectual and technical contributions. This work was funded in part by the Burroughs Wellcome Fund (Clinical Scientist Award to T.S.R.) and the National Cancer Institute (R01 CA82363-03 and R01 CA098730-01 to T.S.R.). T.S.R. holds the Jeanne Ann Plitt Professorship in Breast Cancer Research and the H. Ben and Isabelle T. Decherd Chair in Internal Medicine at UT Southwestern Medical Center.
Footnotes
This is an open-access article distributed under the terms of the Creative Commons Attribution-NonCommercial-No Derivative Works License, which permits non-commercial use, distribution, and reproduction in any medium, provided the original author and source are credited.
Supplemental Information
References
- Anokye-Danso F., Trivedi C.M., Juhr D., Gupta M., Cui Z., Tian Y., Zhang Y., Yang W., Gruber P.J., Epstein J.A., Morrisey E.E. Highly efficient miRNA-mediated reprogramming of mouse and human somatic cells to pluripotency. Cell Stem Cell. 2011;8:376–388. doi: 10.1016/j.stem.2011.03.001. [DOI] [PMC free article] [PubMed] [Google Scholar]
- Baer R., Ludwig T. The BRCA1/BARD1 heterodimer, a tumor suppressor complex with ubiquitin E3 ligase activity. Curr. Opin. Genet. Dev. 2002;12:86–91. doi: 10.1016/s0959-437x(01)00269-6. [DOI] [PubMed] [Google Scholar]
- Belguise K., Sonenshein G.E. PKCtheta promotes c-Rel-driven mammary tumorigenesis in mice and humans by repressing estrogen receptor alpha synthesis. J. Clin. Invest. 2007;117:4009–4021. doi: 10.1172/JCI32424. [DOI] [PMC free article] [PubMed] [Google Scholar]
- Belguise K., Milord S., Galtier F., Moquet-Torcy G., Piechaczyk M., Chalbos D. The PKCθ pathway participates in the aberrant accumulation of Fra-1 protein in invasive ER-negative breast cancer cells. Oncogene. 2012;31:4889–4897. doi: 10.1038/onc.2011.659. [DOI] [PMC free article] [PubMed] [Google Scholar]
- Blay P., Astudillo A., Buesa J.M., Campo E., Abad M., García-García J., Miquel R., Marco V., Sierra M., Losa R. Protein kinase C theta is highly expressed in gastrointestinal stromal tumors but not in other mesenchymal neoplasias. Clin. Cancer Res. 2004;10:4089–4095. doi: 10.1158/1078-0432.CCR-04-0630. [DOI] [PubMed] [Google Scholar]
- Chambers S.M., Fasano C.A., Papapetrou E.P., Tomishima M., Sadelain M., Studer L. Highly efficient neural conversion of human ES and iPS cells by dual inhibition of SMAD signaling. Nat. Biotechnol. 2009;27:275–280. doi: 10.1038/nbt.1529. [DOI] [PMC free article] [PubMed] [Google Scholar]
- Chang S., Wang R.H., Akagi K., Kim K.A., Martin B.K., Cavallone L., Haines D.C., Basik M., Mai P., Poggi E., Kathleen Cuningham Foundation Consortium for Research into Familial Breast Cancer (kConFab) Tumor suppressor BRCA1 epigenetically controls oncogenic microRNA-155. Nat. Med. 2011;17:1275–1282. doi: 10.1038/nm.2459. [DOI] [PMC free article] [PubMed] [Google Scholar]
- D’Amour K.A., Agulnick A.D., Eliazer S., Kelly O.G., Kroon E., Baetge E.E. Efficient differentiation of human embryonic stem cells to definitive endoderm. Nat. Biotechnol. 2005;23:1534–1541. doi: 10.1038/nbt1163. [DOI] [PubMed] [Google Scholar]
- D’Amour K.A., Bang A.G., Eliazer S., Kelly O.G., Agulnick A.D., Smart N.G., Moorman M.A., Kroon E., Carpenter M.K., Baetge E.E. Production of pancreatic hormone-expressing endocrine cells from human embryonic stem cells. Nat. Biotechnol. 2006;24:1392–1401. doi: 10.1038/nbt1259. [DOI] [PubMed] [Google Scholar]
- Drmanac R., Sparks A.B., Callow M.J., Halpern A.L., Burns N.L., Kermani B.G., Carnevali P., Nazarenko I., Nilsen G.B., Yeung G. Human genome sequencing using unchained base reads on self-assembling DNA nanoarrays. Science. 2010;327:78–81. doi: 10.1126/science.1181498. [DOI] [PubMed] [Google Scholar]
- Drost R.M., Jonkers J. Preclinical mouse models for BRCA1-associated breast cancer. Br. J. Cancer. 2009;101:1651–1657. doi: 10.1038/sj.bjc.6605350. [DOI] [PMC free article] [PubMed] [Google Scholar]
- Drost R., Bouwman P., Rottenberg S., Boon U., Schut E., Klarenbeek S., Klijn C., van der Heijden I., van der Gulden H., Wientjens E. BRCA1 RING function is essential for tumor suppression but dispensable for therapy resistance. Cancer Cell. 2011;20:797–809. doi: 10.1016/j.ccr.2011.11.014. [DOI] [PubMed] [Google Scholar]
- Elstrodt F., Hollestelle A., Nagel J.H., Gorin M., Wasielewski M., van den Ouweland A., Merajver S.D., Ethier S.P., Schutte M. BRCA1 mutation analysis of 41 human breast cancer cell lines reveals three new deleterious mutants. Cancer Res. 2006;66:41–45. doi: 10.1158/0008-5472.CAN-05-2853. [DOI] [PubMed] [Google Scholar]
- Evers B., Jonkers J. Mouse models of BRCA1 and BRCA2 deficiency: past lessons, current understanding and future prospects. Oncogene. 2006;25:5885–5897. doi: 10.1038/sj.onc.1209871. [DOI] [PubMed] [Google Scholar]
- Futreal P.A., Liu Q., Shattuck-Eidens D., Cochran C., Harshman K., Tavtigian S., Bennett L.M., Haugen-Strano A., Swensen J., Miki Y. BRCA1 mutations in primary breast and ovarian carcinomas. Science. 1994;266:120–122. doi: 10.1126/science.7939630. [DOI] [PubMed] [Google Scholar]
- González F., Georgieva D., Vanoli F., Shi Z.D., Stadtfeld M., Ludwig T., Jasin M., Huangfu D. Homologous recombination DNA repair genes play a critical role in reprogramming to a pluripotent state. Cell Rep. 2013;3:651–660. doi: 10.1016/j.celrep.2013.02.005. [DOI] [PMC free article] [PubMed] [Google Scholar]
- Gordge P.C., Hulme M.J., Clegg R.A., Miller W.R. Elevation of protein kinase A and protein kinase C activities in malignant as compared with normal human breast tissue. Eur. J. Cancer. 1996;32A:2120–2126. doi: 10.1016/s0959-8049(96)00255-9. [DOI] [PubMed] [Google Scholar]
- Gore A., Li Z., Fung H.L., Young J.E., Agarwal S., Antosiewicz-Bourget J., Canto I., Giorgetti A., Israel M.A., Kiskinis E. Somatic coding mutations in human induced pluripotent stem cells. Nature. 2011;471:63–67. doi: 10.1038/nature09805. [DOI] [PMC free article] [PubMed] [Google Scholar]
- Griner E.M., Kazanietz M.G. Protein kinase C and other diacylglycerol effectors in cancer. Nat. Rev. Cancer. 2007;7:281–294. doi: 10.1038/nrc2110. [DOI] [PubMed] [Google Scholar]
- Haile D.T., Parvin J.D. Activation of transcription in vitro by the BRCA1 carboxyl-terminal domain. J. Biol. Chem. 1999;274:2113–2117. doi: 10.1074/jbc.274.4.2113. [DOI] [PubMed] [Google Scholar]
- Hong H., Takahashi K., Ichisaka T., Aoi T., Kanagawa O., Nakagawa M., Okita K., Yamanaka S. Suppression of induced pluripotent stem cell generation by the p53-p21 pathway. Nature. 2009;460:1132–1135. doi: 10.1038/nature08235. [DOI] [PMC free article] [PubMed] [Google Scholar]
- Horwitz A.A., Sankaran S., Parvin J.D. Direct stimulation of transcription initiation by BRCA1 requires both its amino and carboxyl termini. J. Biol. Chem. 2006;281:8317–8320. doi: 10.1074/jbc.C500475200. [DOI] [PubMed] [Google Scholar]
- Hosey A.M., Gorski J.J., Murray M.M., Quinn J.E., Chung W.Y., Stewart G.E., James C.R., Farragher S.M., Mulligan J.M., Scott A.N. Molecular basis for estrogen receptor alpha deficiency in BRCA1-linked breast cancer. J. Natl. Cancer Inst. 2007;99:1683–1694. doi: 10.1093/jnci/djm207. [DOI] [PMC free article] [PubMed] [Google Scholar]
- Isakov N., Altman A. PKC-theta-mediated signal delivery from the TCR/CD28 surface receptors. Front. Immunol. 2012;3:273. doi: 10.3389/fimmu.2012.00273. [DOI] [PMC free article] [PubMed] [Google Scholar]
- Ji J., Ng S.H., Sharma V., Neculai D., Hussein S., Sam M., Trinh Q., Church G.M., McPherson J.D., Nagy A., Batada N.N. Elevated coding mutation rate during the reprogramming of human somatic cells into induced pluripotent stem cells. Stem Cells. 2012;30:435–440. doi: 10.1002/stem.1011. [DOI] [PubMed] [Google Scholar]
- Jones S., Hruban R.H., Kamiyama M., Borges M., Zhang X., Parsons D.W., Lin J.C., Palmisano E., Brune K., Jaffee E.M. Exomic sequencing identifies PALB2 as a pancreatic cancer susceptibility gene. Science. 2009;324:217. doi: 10.1126/science.1171202. [DOI] [PMC free article] [PubMed] [Google Scholar]
- Kleiman F.E., Wu-Baer F., Fonseca D., Kaneko S., Baer R., Manley J.L. BRCA1/BARD1 inhibition of mRNA 3′ processing involves targeted degradation of RNA polymerase II. Genes Dev. 2005;19:1227–1237. doi: 10.1101/gad.1309505. [DOI] [PMC free article] [PubMed] [Google Scholar]
- Konishi H., Mohseni M., Tamaki A., Garay J.P., Croessmann S., Karnan S., Ota A., Wong H.Y., Konishi Y., Karakas B. Mutation of a single allele of the cancer susceptibility gene BRCA1 leads to genomic instability in human breast epithelial cells. Proc. Natl. Acad. Sci. USA. 2011;108:17773–17778. doi: 10.1073/pnas.1110969108. [DOI] [PMC free article] [PubMed] [Google Scholar]
- Lancaster J.M., Wooster R., Mangion J., Phelan C.M., Cochran C., Gumbs C., Seal S., Barfoot R., Collins N., Bignell G. BRCA2 mutations in primary breast and ovarian cancers. Nat. Genet. 1996;13:238–240. doi: 10.1038/ng0696-238. [DOI] [PubMed] [Google Scholar]
- Lim E., Vaillant F., Wu D., Forrest N.C., Pal B., Hart A.H., Asselin-Labat M.L., Gyorki D.E., Ward T., Partanen A., kConFab Aberrant luminal progenitors as the candidate target population for basal tumor development in BRCA1 mutation carriers. Nat. Med. 2009;15:907–913. doi: 10.1038/nm.2000. [DOI] [PubMed] [Google Scholar]
- McPherson J.P., Lemmers B., Hirao A., Hakem A., Abraham J., Migon E., Matysiak-Zablocki E., Tamblyn L., Sanchez-Sweatman O., Khokha R. Collaboration of Brca1 and Chk2 in tumorigenesis. Genes Dev. 2004;18:1144–1153. doi: 10.1101/gad.1192704. [DOI] [PMC free article] [PubMed] [Google Scholar]
- Miki Y., Swensen J., Shattuck-Eidens D., Futreal P.A., Harshman K., Tavtigian S., Liu Q., Cochran C., Bennett L.M., Ding W. A strong candidate for the breast and ovarian cancer susceptibility gene BRCA1. Science. 1994;266:66–71. doi: 10.1126/science.7545954. [DOI] [PubMed] [Google Scholar]
- Miyoshi N., Ishii H., Nagano H., Haraguchi N., Dewi D.L., Kano Y., Nishikawa S., Tanemura M., Mimori K., Tanaka F. Reprogramming of mouse and human cells to pluripotency using mature microRNAs. Cell Stem Cell. 2011;8:633–638. doi: 10.1016/j.stem.2011.05.001. [DOI] [PubMed] [Google Scholar]
- Momcilovic O., Knobloch L., Fornsaglio J., Varum S., Easley C., Schatten G. DNA damage responses in human induced pluripotent stem cells and embryonic stem cells. PLoS ONE. 2010;5:e13410. doi: 10.1371/journal.pone.0013410. [DOI] [PMC free article] [PubMed] [Google Scholar]
- Motegi A., Sakurai S., Nakayama H., Sano T., Oyama T., Nakajima T. PKC theta, a novel immunohistochemical marker for gastrointestinal stromal tumors (GIST), especially useful for identifying KIT-negative tumors. Pathol. Int. 2005;55:106–112. doi: 10.1111/j.1440-1827.2005.01806.x. [DOI] [PubMed] [Google Scholar]
- O’Brian C., Vogel V.G., Singletary S.E., Ward N.E. Elevated protein kinase C expression in human breast tumor biopsies relative to normal breast tissue. Cancer Res. 1989;49:3215–3217. [PubMed] [Google Scholar]
- Ou W.B., Zhu M.J., Demetri G.D., Fletcher C.D., Fletcher J.A. Protein kinase C-theta regulates KIT expression and proliferation in gastrointestinal stromal tumors. Oncogene. 2008;27:5624–5634. doi: 10.1038/onc.2008.177. [DOI] [PMC free article] [PubMed] [Google Scholar]
- Petrucelli N., Daly M.B., Feldman G.L. Hereditary breast and ovarian cancer due to mutations in BRCA1 and BRCA2. Genet. Med. 2010;12:245–259. doi: 10.1097/GIM.0b013e3181d38f2f. [DOI] [PubMed] [Google Scholar]
- Riggs J.W., Barrilleaux B., Varlakhanova N., Bush K., Chan V., Knoepfler P. Induced pluripotency and oncogenic transformation are related processes. Stem Cells Dev. 2013;22:37–50. doi: 10.1089/scd.2012.0375. [DOI] [PMC free article] [PubMed] [Google Scholar]
- Risch H.A., McLaughlin J.R., Cole D.E., Rosen B., Bradley L., Fan I., Tang J., Li S., Zhang S., Shaw P.A., Narod S.A. Population BRCA1 and BRCA2 mutation frequencies and cancer penetrances: a kin-cohort study in Ontario, Canada. J. Natl. Cancer Inst. 2006;98:1694–1706. doi: 10.1093/jnci/djj465. [DOI] [PubMed] [Google Scholar]
- Ross T.S. Grace Rock’s consent. Endocr. Relat. Cancer. 2012;19:C29–C31. doi: 10.1530/ERC-12-0186. [DOI] [PubMed] [Google Scholar]
- Ruiz S., Gore A., Li Z., Panopoulos A.D., Montserrat N., Fung H.L., Giorgetti A., Bilic J., Batchelder E.M., Zaehres H. Analysis of protein-coding mutations in hiPSCs and their possible role during somatic cell reprogramming. Nat. Commun. 2013;4:1382. doi: 10.1038/ncomms2381. [DOI] [PMC free article] [PubMed] [Google Scholar]
- Schlegel B.P., Green V.J., Ladias J.A., Parvin J.D. BRCA1 interaction with RNA polymerase II reveals a role for hRPB2 and hRPB10alpha in activated transcription. Proc. Natl. Acad. Sci. USA. 2000;97:3148–3153. doi: 10.1073/pnas.070452397. [DOI] [PMC free article] [PubMed] [Google Scholar]
- Shakya R., Reid L.J., Reczek C.R., Cole F., Egli D., Lin C.S., deRooij D.G., Hirsch S., Ravi K., Hicks J.B. BRCA1 tumor suppression depends on BRCT phosphoprotein binding, but not its E3 ligase activity. Science. 2011;334:525–528. doi: 10.1126/science.1209909. [DOI] [PMC free article] [PubMed] [Google Scholar]
- Sy S.M., Huen M.S., Chen J. PALB2 is an integral component of the BRCA complex required for homologous recombination repair. Proc. Natl. Acad. Sci. USA. 2009;106:7155–7160. doi: 10.1073/pnas.0811159106. [DOI] [PMC free article] [PubMed] [Google Scholar]
- Takahashi K., Tanabe K., Ohnuki M., Narita M., Ichisaka T., Tomoda K., Yamanaka S. Induction of pluripotent stem cells from adult human fibroblasts by defined factors. Cell. 2007;131:861–872. doi: 10.1016/j.cell.2007.11.019. [DOI] [PubMed] [Google Scholar]
- Turner N., Tutt A., Ashworth A. Hallmarks of ‘BRCAness’ in sporadic cancers. Nat. Rev. Cancer. 2004;4:814–819. doi: 10.1038/nrc1457. [DOI] [PubMed] [Google Scholar]
- Warren L., Manos P.D., Ahfeldt T., Loh Y.H., Li H., Lau F., Ebina W., Mandal P.K., Smith Z.D., Meissner A. Highly efficient reprogramming to pluripotency and directed differentiation of human cells with synthetic modified mRNA. Cell Stem Cell. 2010;7:618–630. doi: 10.1016/j.stem.2010.08.012. [DOI] [PMC free article] [PubMed] [Google Scholar]
- Wong N.A., Shelley-Fraser G. Specificity of DOG1 (K9 clone) and protein kinase C theta (clone 27) as immunohistochemical markers of gastrointestinal stromal tumour. Histopathology. 2010;57:250–258. doi: 10.1111/j.1365-2559.2010.03622.x. [DOI] [PubMed] [Google Scholar]
Associated Data
This section collects any data citations, data availability statements, or supplementary materials included in this article.