Abstract
With stroke currently the second-leading cause of death globally, and 87% of all strokes classified as ischemic, the development of a fast, accessible, cost-effective approach for imaging occlusive stroke could have a significant impact on healthcare outcomes and costs. While clinical examination and standard CT alone do not provide adequate information for understanding the complex temporal events that occur during an ischemic stroke, ultrasound imaging is well-suited to the task of examining blood flow dynamics in real-time and may allow for localization of a clot. A prototype bilateral 3D ultrasound imaging system utilizing two matrix array probes on either side of the head allows for correction of skull-induced aberration throughout two entire phased array imaging volumes. We investigated the feasibility of applying this custom correction technique in 5 healthy volunteers with Definity® microbubble contrast enhancement. Subjects were scanned simultaneously via both temporal acoustic windows in 3D color flow mode. The number of color flow voxels above a common threshold increased due to aberration correction in 5/5 subjects, with a mean increase of 33.9%. The percentage of large arteries visualized in 3D color Doppler imaging increased from 46% without aberration correction to 60% with aberration correction.
Keywords: transcranial, phase aberration, 3D ultrasound, contrast-enhanced
Introduction
Stroke and cerebrovascular disease represent the second-leading cause of death globally (World Health Organization 2011) and comprise 17% of overall national health spending in the United States (Heidenreich et al. 2011). Approximately 87% of strokes are ischemic (Roger et al. 2011), in which patients’ functional outcomes may be improved and recovery times reduced by IV administration of a thrombolytic agent such as recombinant tissue plasminogen activator (tPA) (Hacke et al. 1995).
Ischemic strokes may be treated with thrombolytic agents only within the first 4.5 hours following symptom onset, with earlier times associated with more favorable outcomes (Hacke et al. 2008; Davis and Donnan 2009). While computed tomography (CT) scans are commonly used to exclude patients with hemorrhages from thrombolytic treatment, clinical examination and standard CT alone do not provide adequate information for understanding the complex temporal events that occur during an ischemic stroke (Sims et al. 2005). Ultrasound imaging is well-suited to the task of examining blood flow dynamics in real-time and may allow for localization of the ischemic region in a large artery stroke (Kern et al. 2011).
Real-time 2D ultrasound imaging has been demonstrated as a portable technology for diagnosing stroke in the field (Holscher et al. 2008; Bowman 2010; Hoyer et al. 2010; Chenaitia et al. 2011; Wilson et al. 2011; Holscher 2012; Schlachetzki et al. 2012). In a clinical setting, investigators have worked to standardize scanning procedures for transcranial ultrasound with color flow (Nedelmann et al. 2009). 3D ultrasound has been cited as a potentially faster and clinically acceptable alternative to X-ray for examining blood flow in intracranial collateral arteries (Wessels et al. 2004). Ultrasound may also have value as a monitoring tool to avoid repeated CT scans, each of which requires transportation of a critically ill patient, exposure to ionizing radiation, and increased cost relative to ultrasound (Alexandrov et al. 2004; Becker et al. 2012).
The frame rates and spatial sampling necessary for real-time 3D ultrasound imaging are enabled by the use of a matrix array probe and parallel receive processing (Smith et al. 1991; von Ramm et al. 1991). This approach carries inherent reductions in system performance relative to 2D ultrasound: (1) Sensitivity is reduced due to electrical impedance mismatch between the element of a 2D array and the cable it drives, and (2) Spatial resolution and sensitivity are reduced due to weak focusing of a transmit beam from which multiple receive beams are formed simultaneously.
In addition to these technical challenges associated with 3D ultrasound imaging, the effects of the skull also limit transcranial ultrasound imaging. Aaslid first reported the presence of a region of the human temporal bone having decreased attenuation (Aaslid et al. 1982). Within this acoustic window, attenuation of sound waves in the skull is approximately 2.8 dB/cm/MHz (White and Stevenson 1978), while outside the window it may vary from 30 to 70 dB/cm/MHz (White and Stevenson 1978). In addition, recent studies have examined other deleterious effects of ultrasound propagation through the skull including mode conversion and total internal reflection (Clement et al. 2004; White et al. 2006; Maciak et al. 2009; Vignon et al. 2010), nonlinear propagation (Pinton et al. 2011), and refraction (Smith et al. 1986). Researchers have also presented promising results using microbubble-based parametric imaging approaches to localize regions of abnormal perfusion (Seidel et al. 2000; Holscher et al. 2005; Meyer-Wiethe et al. 2009; Kern et al. 2011).
Phase aberration correction
Perhaps the most commonly addressed skull-induced effect is aberration, which reduces spatial and contrast resolution due to a mismatch between the velocity of a longitudinal wave in the spatially inhomogeneous skull (cS ≈ 2327–2650 m/s) (Fry and Barger 1978; Pichardo et al. 2011) and the soft tissue velocity assumed by the scanner in beamforming (cB =1540 m/s). In the nearfield phase screen model (Fig. 1), the wavefront aberration in the skull is modeled as a set of time delay adjustments at each element:
| (1) |
where Δz is the thickness variation in x and y and Δt is the resulting arrival time variation.
Figure 1.
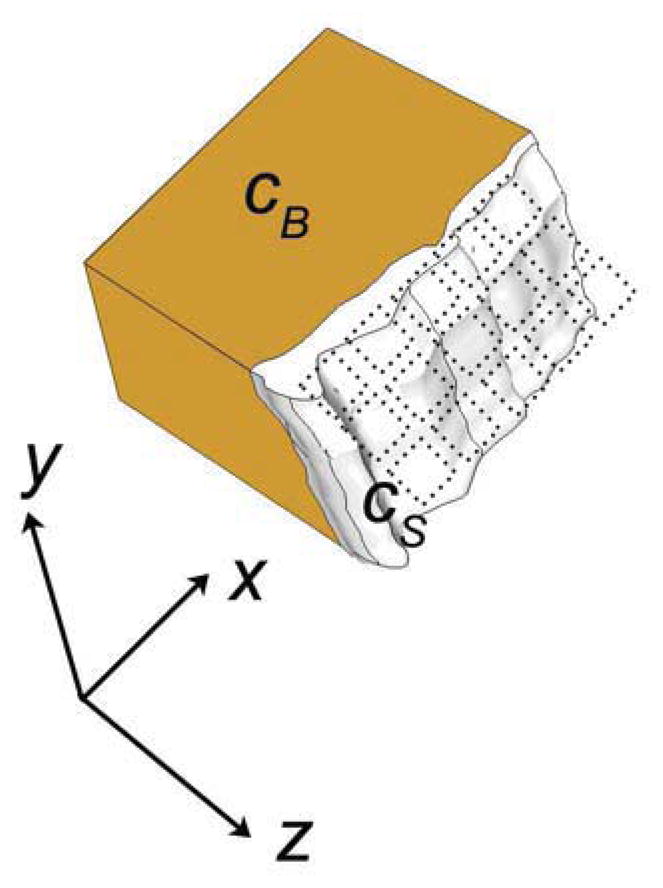
A sound wave exiting the skull propagates through the brain with speed cB and through the skull with speed cS. Upon exiting the skull, the wavefront is incident on the elements of a matrix array (dotted outlines). The delays at each element Δt (x,y) are a function of the spatial variation of the skull’s thickness, Δz (x,y).
If the spatial variations of the skull can be measured using either backscattered echoes or a transmitted beacon wave, then the scanner’s transmit and receive time delays might be corrected by adding a −Δ t to cancel the appropriate Δt at each (x, y) position in Equation 1. This tightens the focus which had been broadened by propagation through the skull. Miller-Jones measured arrival time using a contralateral active source as a coherent, high SNR correction beacon (Miller-Jones 1980), an approach which Vignon et al. combined with inverse filtering to compensate for the various frequency-dependent effects of the skull and allow for the formation of a tight focus within the skull without the presence of a beacon inside the skull (Aubry et al. 2001; Tanter et al. 2001; Vignon et al. 2006). Our own group has demonstrated 3D correction of in vivo aberration on a two-dimensional (2D) array using a multi-lag cross-correlation technique (Ivancevich et al. 2008; Ivancevich 2009). All of these adaptive imaging techniques suffer from limited spatial stability of the aberrator, in which correcting for a single aberrator only restores spatial resolution and contrast over a small subregion of the image, known as the isoplanatic patch (Dahl et al. 2005; Vignon et al. 2008).
Aberration correction techniques have been established in other fields including astronomy (Muller and Buffington 1974), electromagnetics (Steinberg 1981), and seismology (Taner et al. 1974) which have informed aberration correction in medical ultrasound. Approaches in astronomy, ultrasound, and microscopy have used beacon signals similar to the current method (Flax and O’Donnell 1988; Andersen et al. 1997; Haworth et al. 2008; Azucena et al. 2010). However, the current technique is unique from techniques in other modalities in its use of reciprocity between two independent 3D scans. One proposed solution for the isoplanatic patch in other fields is the use of multiconjugate adaptive optics, in which multiple deformable mirrors are used to characterize multiple aberrating layers where the number of deformable mirrors is equal to the number of thin aberrating layers (Johnston and Welsh 1994). This approach has been implemented to correct lens aberrations in optical imaging of the human retina (Bedggood et al. 2006; Dubinin et al. 2008), and atmospheric aberrations in the case of large ground-based telescopes (Beckers 1988; Marchetti et al. 2007). Such an approach is physically similar to the matrix representation of aberration developed in spatiotemporal inverse filtering techniques (Aubry et al. 2001; Tanter et al. 2001), in which the entire propagation operator must be acquired, with each row of this matrix corresponding to a different layer of distortion.
Despite the sensitivity challenges posed by 3D ultrasound and the presence of the skull, our group has reported moderate success in 3D transcranial imaging studies. While we have demonstrated the ability to image blood flow transcranially in 3D in some individuals (Lindsey et al. 2011; Lindsey and Smith 2013), we require microbubble contrast agent to achieve sensitivity levels that are diagnostically useful in a general population.
Recently, our group demonstrated a technique for phase aberration correction utilizing two 2D arrays placed over opposing temporal acoustic windows capable of correcting multiple isoplanatic patches in a 3D phased array scan (Lindsey and Smith 2013). The presence of two arrays allows us to sequentially transmit multiple steered wavefronts and receive them on the opposite side of the head after they have traveled unique propagation paths through the aberrating media (Fig. 2). These measurements are then used to apply unique delay update maps to different sub-regions of a 3D phased array scan, correcting multiple isoplanatic patches and extending the benefits of phase aberration correction to an entire volume (Fig. 3). This technique builds on the investigations of Waag and colleagues into propagation path-dependence of aberration, in which measurements made using multiple sets of transmit-receive aperture pairs are used to correct for path-dependent effects which cause the nearfield phase screen model to break down (Waag and Astheimer 2005; Astheimer et al. 2006; Tillett et al. 2010).
Figure 2.
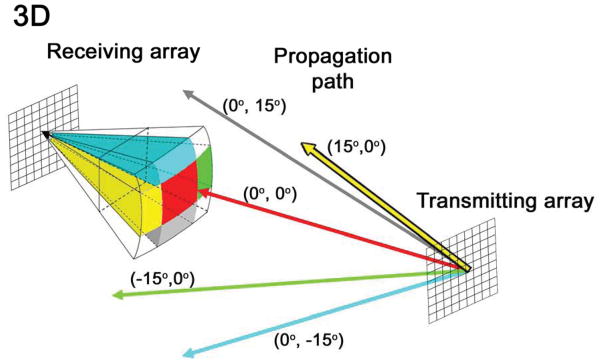
In the multi-isoplanatic patch phase aberration correction technique, unfocused waves are steered off-axis to investigate several unique propagation paths through the nearfield skull aberrator, indicated by differently colored rays. Each color corresponds to a subset of image lines within a 3D volume. In this work, five isoplanatic patches are estimated and corrected. The central update regions (red) is 32° × 32°; outer regions are 16° × 32° or 32° × 16°.
Figure 3.
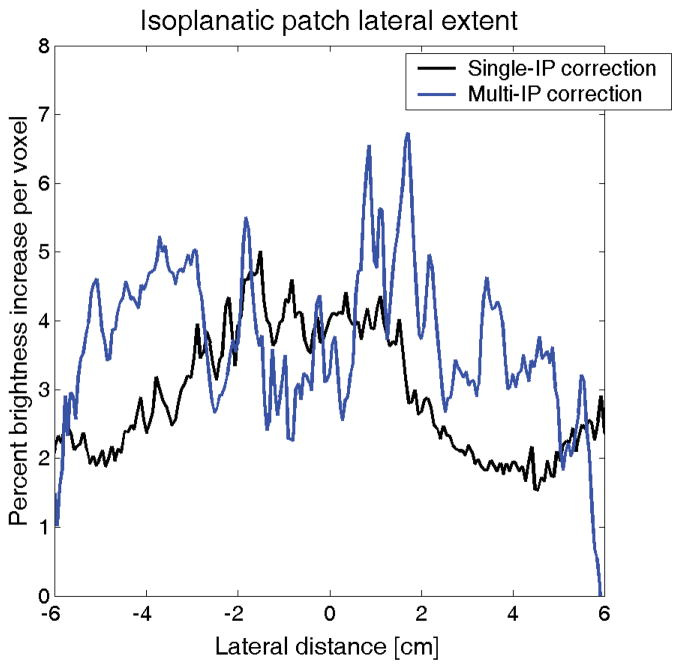
Percent brightness increase with lateral distance in transcranial aberration correction in a single human subject for a traditional phase aberration correction (black) and a multiple isoplanatic patch correction (blue). While the brightness improvement decreases laterally when a single isoplanatic patch is assumed, brightness gains are maintained when multiple corrections are performed as described in Fig. 2.
In this article, we present the first results of the human application of this phase aberration correction technique in a pilot study of five healthy volunteers with microbubble contrast enhancement.
Materials and Methods
Scanning system
The study was performed using the Volumetrics Model 1 scanner (Volumetrics Medical Imaging, Durham, NC), a real-time 3-D ultrasound system with 16:1 parallel receive processing (Smith et al. 1991; von Ramm et al. 1991). This system has 256 transmit channels and 256 shared transmit/receive channels. A 2-D phased array transducer on this system typically transmits 256 broadened beams in succession. For each transmit beam, 16 receive beams are formed from echoes arranged in a 4 × 4 pattern centered on the transmit beam. The transmit beam spacing is 4° in a typical 64° × 64° scan, enabling frame rates of up to 30 volumes/sec.
To enable simultaneous real-time 3D imaging with two 2D arrays, the scanner’s channels and its 4096 image lines were split equally between two matrix arrays, enabling simultaneous acquisition of two 64° × 64° pyramidal volumes (Smith et al. 2009; Lindsey et al. 2011). Each matrix array has 128 transmit elements and 128 shared transmit/receive elements. For each transmit beam, 16 receive beams are formed from one of the two transducers. However, transmit beam separation has now doubled in the elevation direction, so transmit beams in each 64° × 64° volume are spaced at 4° in azimuth and 8° in elevation.
During in vivo scanning, four slices from the two probes are displayed simultaneously in real-time: one azimuth and one elevation slice from each transducer, corresponding to coronal and transverse planes in transtemporal imaging (Fig. 4A). The operator uses a trackball control to select any four slices in either volume for display. All experiments were performed using commercial (Volumetrics) sparse 2D arrays having inter-element separation of 0.35 × 0.35 mm and remapped by a custom printed circuit board to allow for dual simultaneous 3D imaging (Lindsey et al. 2009). Each sparse matrix array has 128 elements with an aperture diameter of 6.6 mm, producing a -6 dB pulse-echo beamwidth of 5.5 mm at a depth of 70 mm (Smith et al. 2009); studies were performed with 3D echo at 2.5 MHz and 3D color Doppler at 1.8 MHz to maximize sensitivity for the system and transducer.
Figure 4.
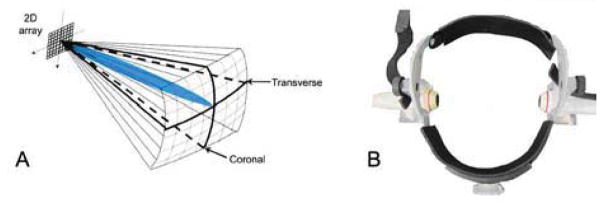
(A) Typical volume interrogated during a transtemporal examination. Two such volumes are acquired simultaneously and are then registered and fused offline into a single visualization. (B) Head frame used to position two arrays over bilateral temporal bone windows.
Human scanning protocol
Five healthy volunteers were scanned after providing informed consent according to a protocol approved by the Duke University Institutional Review Board. The two matrix array probes were placed in a head frame (Fig. 4B) (Mark III, Spencer Technologies, Seattle, WA) allowing an experienced sonographer (H.N.) to manipulate them and locate the subject’s acoustic window. Once the desired field of view was attained, the probes were locked in place using custom attachments on the head frame. The subject was instructed to remain still for the duration of the study.
For each probe, five sequential pitch-catch measurements were made using transmitted beacons waves steered in five different directions: (0°, −15°), (0°, 0°), (0°, 15°), (15°, 0°), and (15, 0°). Update region (isoplanatic patch) size was assumed to be 32° in both azimuth and elevation, in line with published values for the skull isoplanatic patch (Vignon et al. 2008; Ivancevich et al. 2009). This assumption yields 5 update regions: a central 32° × 32° patch and four side patches measuring either 32° × 16° or 16° × 32° (Fig. 2). This aberration correction approach has been previously described in greater detail (Lindsey and Smith 2013).
Briefly, single channel radiofrequency (RF) data were acquired using a digitizing board (25 MHz, PDA14, Signatec, Corona, CA) on a PC (Dell, Round Rock, TX). These signals were filtered axially (FIR bandpass filter, 60% BW) and laterally (Dahl and Feehan 2008) (FIR lowpass, cutoff at 75% of spatial Nyquist), before removal of the steering component. Phase aberrations were estimated using a multi-lag least squares estimation technique (Liu and Waag 1994; Gauss et al. 2001). This estimation algorithm is performed by computing the normalized cross correlation between all element signals within a specified spatial lag (3 mm), and the resulting overdetermined system was approximately solved using linear least squares, yielding 5 delay update maps, or versions of Δt(x,y), for each probe. These maps were passed back to the scanner via Ethernet connection, and transmit and receive delays were updated for all scanning modes. The entire computation and delay update process required approximately 3 minutes. While a faster implementation could further improve this technique by minimizing effects of physiological and patient motion, we have successfully demonstrated correction (Lindsey and Smith 2013) due to the fact that the transducer was stationary relative to the aberrator and that the correction source was a coherent, spatially stationary signal rather than a diffuse source or moving scatterers. After the human study, the delay maps from each subject were analyzed to determine the root mean square amplitude and the full-width at half-maximum of the autocorrelation of each measured aberrator, measurements of aberration strength and spatial frequency content, respectively.
Once delays were updated, the subject was given a bolus injection intravenously of 10 μL/kg of activated Definity® (Lantheus Medical Imaging, North Billerica, MA) followed by a 10 mL saline flush according to the Definity® prescribing information. Aberration corrected images were acquired in color flow mode. After the flow enhancement due to Definity® had dissipated, the scanner’s delays were returned to their default values (i.e. aberration correction was removed). A second bolus injection was administered per prescribing information and control images were acquired. During microbubble enhancement, four corrected and four control acquisitions were saved. Each acquisition consisted of approximately 10–12 volumes in time at a frame rate of approximately 3 volumes/sec. 3D Doppler settings included a 4-cycle pulse and an ensemble length of 7. The Doppler pulse sequence followed that of Jensen (Jensen 1996), in which echo and Doppler pulses are interleaved. The VMI on-screen display showed an MI of 1.2 and a TI of 0.1. Because on-screen values assume 0.3 dB/cm/MHz (AIUM/NEMA 1998) and actual attenuation is expected to be approximately 3 dB/cm/MHz for 3 mm of bone inside the window and 1 dB/cm/MHz for 7 cm of brain tissue, maximum in vivo attenuated peak pressures are expected to be approximately 3 times lower than indicated, ensuring subject safety for this study while also providing potential room for increasing MI in future studies. The real-time video display from the entire study—in which two orthogonal slices from each transducer are displayed simultaneously—was also recorded to a digital video recorder disc for later review.
For quantitative comparison, the magnitude of the 3D color Doppler data of the control scans was analyzed offline (Matlab, The Mathworks, Natick, MA) by manually selecting a threshold for 3D rendering which produced optimal display of signal and rejection of noise. This is analogous to adjusting the Doppler reject on the scanner. This same threshold was then applied to the corrected volumes and the change in the number of voxels above this threshold was recorded. This increase in Doppler magnitude is indicative of improvement in sensitivity due to aberration correction because when aberration is corrected in each isoplanatic patch, the radiofrequency echo data is summed coherently, increasing echo SNR and producing a corresponding increase in the correlation coefficient (the Doppler magnitude) between beamformed echo acquisitions at successive pulse repetition intervals.
Mean variance of the Doppler data between the corrected and control cases were also compared. Variance is expected to decrease with correction as coherent signals overcome random noise (Ivancevich et al. 2008).
In order to display 3D data, simultaneously acquired volumes were averaged in time and registered and fused into a single 3D visualization as described previously (Lindsey et al. 2011; Lindsey et al. 2013). Video recordings of the real-time display were reviewed by an author experienced (B.L.) in viewing this type of bilateral 3D scan and the detection of the following major vessels for each subject was evaluated: left and right middle cerebral arteries, left and right internal carotid arteries, anterior cerebral artery, left and right posterior cerebral arteries.
Results
Anatomic accuracy of the vessels appears to be accurate and is not greatly affected by aberration correction. A summary of 3D color Doppler data characteristics with and without aberration correction is presented in Table 1. The number of Doppler voxels above a common threshold increased in all five subjects as a result of correcting aberration with a mean increase of 33.9 ± 40.6 %. The same rendering threshold was used for the aberrated (control) and corrected cases within each subject to allow direct comparison. However, the variance of the Doppler data decreased as a result of aberration correction in only two of five subjects. This will be examined in greater detail in the Discussion section.
Table 1.
Percent changes in Doppler magnitude and variance due to aberration correction in five healthy volunteers.
| Subject 1 | Subject 2 | Subject 3 | Subject 4 (window failure) | Subject 5 | |
|---|---|---|---|---|---|
| Percent increase in Doppler voxels above common threshold | 105.4% | 23.6% | 16.6% | 19.6% | 4.29% |
| Percent decrease in Doppler variance | −18.4% | 10.9% | −0.353% | −0.652% | 8.386% |
One subject exhibited a window failure, present in 8–29% of the population (Hashimoto et al. 1992; Seidel et al. 1995; Baumgartner et al. 1997; Marinoni et al. 1997; Postert et al. 1997; Gahn et al. 2000; Krejza et al. 2007; Lindsey et al. 2013). In this subject, no landmarks were visible on the B-mode echo image and only noise was visible with microbubble contrast enhancement but without aberration correction (Fig. 5A). With aberration correction, blood flow in a single middle cerebral artery was visualized (Fig. 5B).
Figure 5.
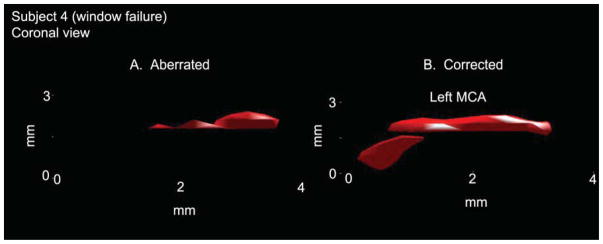
In a single subject with window failure, aberration correction allowed identification of the left middle cerebral artery and visualization of flow in the proximal portion of this vessel (B). Without correction (A) it was not possible to distinguish between vessel and noise.
In evaluating the detectability of the major cerebral arteries (Table 2), contrast enhancement without aberration correction allowed visualization of 16 of 35 possible major arteries (45.7%). Contrast enhancement with aberration correction allowed visualization of 21 of 35 possible major arteries (60.0%). Ability to image blood flow in large cerebral arteries is an important indicator for any imaging system for use in stroke given that 68% of ischemic strokes affect the anterior circulation—arteries supplied by the left and right internal carotid arteries—with 96% of these occlusions occurring in the middle cerebral arteries (Bogousslavsky et al. 1988).
Table 2.
Detection rates of major cerebral arteries in five healthy volunteers.
| Without aberration correction | With aberration correction | |
|---|---|---|
| Left ICA | 2/5 | 4/5 |
| Right ICA | 3/5 | 4/5 |
| Left MCA | 3/5 | 5/5 |
| Right MCA | 4/5 | 4/5 |
| ACA | 2/5 | 2/5 |
| Left PCA | 1/5 | 1/5 |
| Right PCA | 1/5 | 1/5 |
| Echo landmarks | 4/5 | 4/5 |
ICA = internal carotid artery, MCA = middle cerebral artery, ACA = anterior cerebral artery, PCA = posterior cerebral artery.
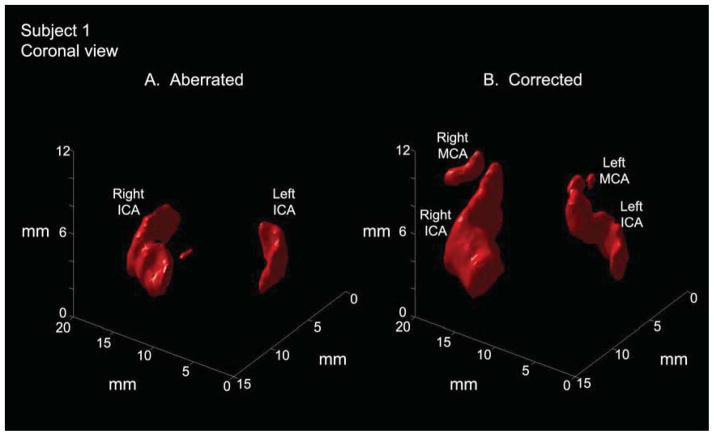
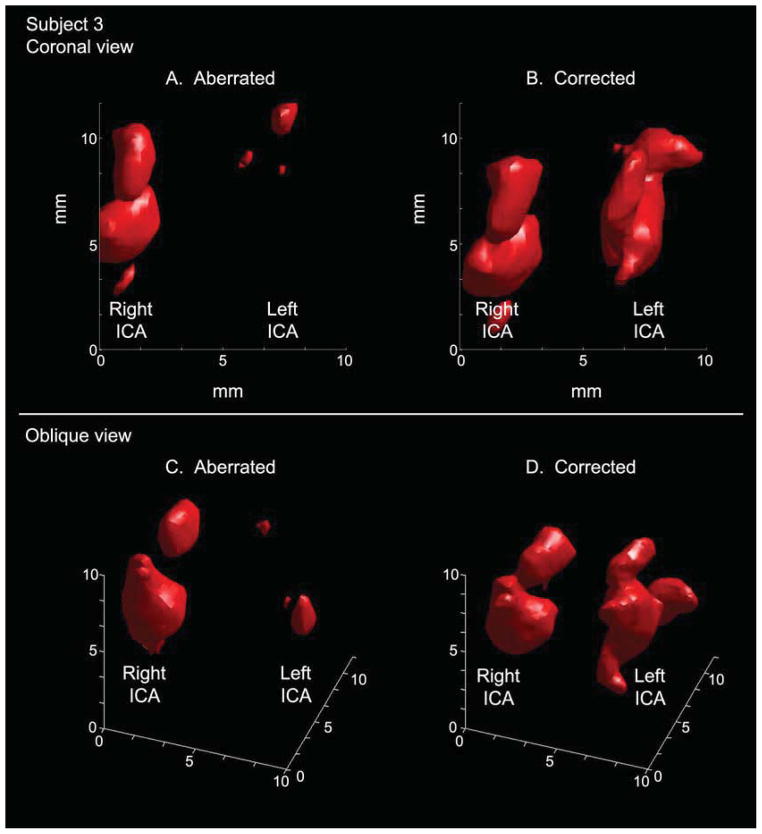
Results for two subjects in which aberration correction improved visualization are shown in Figs. 6 and 7. In Fig. 6, aberration correction enables visualization of both proximal middle cerebral arteries, which had not been possible without correction, and reveals the S-shaped structure of the carotid siphon in three dimensions. In Fig. 7, aberration correction in a different subject illuminates the left internal carotid artery and produces more continuous flow in the right internal carotid artery. These improvements will be discussed further in the Discussion section.
Figure 6.
In an anterior-posterior view of a single subject (subject 1), aberration correction enables visualization of proximal MCAs bilaterally where these vessels could not be visualized before correction. Correction also brings out the S-shaped curve of the carotid siphon (segments C2–C3) portion of the internal carotid artery. (MCA=middle cerebral artery, ICA=internal carotid artery)
Figure 7.
Visualization of the left internal carotid artery is greatly improved in the aberration corrected case (B) relative to the aberrated case (A) in an anterior-posterior view in single subject (Subject 3). In oblique views of the same data, the vessel morphology is visible in the corrected rendering (D). The S-shaped carotid siphon is particularly visible on the left side.
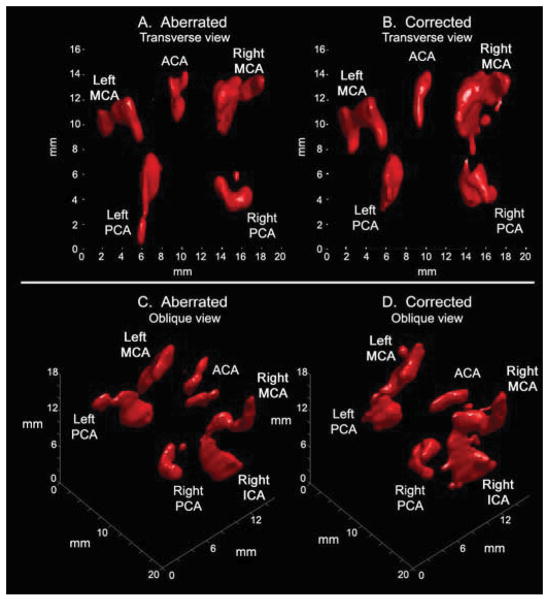
Finally, in Fig. 8, a fourth subject shows visualization of the entire Circle of Willis both before and after correction. While in this subject all major arteries were visible without aberration correction, correction improves continuity of flow imaging by raising the SNR for Doppler imaging as described in the Methods section. In particular, in comparing Figs. 8C and 8D, correction can be seen to remove a registration error involving the anterior cerebral artery and to improve imaging of continuous flow in both middle cerebral arteries and one posterior cerebral artery.
Figure 8.
Offline 3D renderings in a single subject (subject 5). (A) Aberrated and (B) corrected renderings show similar vascular anatomy in transverse views, enabling visualization of the Circle of Willis. Rotating the same data sets produces the oblique views of (C) and (D). A registration error is visible in the ACA in (C). Additionally, the corrected rendering in (D) shows improved visualization of the right posterior cerebral, right middle cerebral, and left middle cerebral arteries relative to (C).
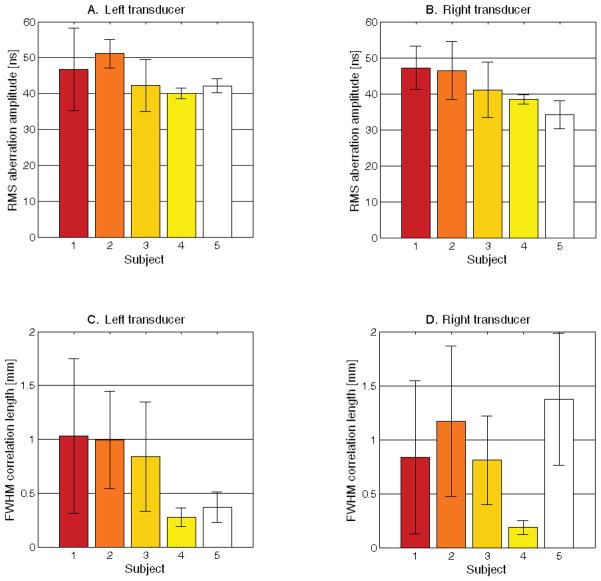
In Figure 9, characteristics of the measured aberrators are presented for all 5 subjects. For each subject, five unique propagation paths through the aberrating skull (i.e. five isoplanatic patches) were measured on each side of the head. The strength of an aberrator is commonly expressed as the root mean square (RMS) amplitude of the aberration map, while the spatial frequency content of an aberrator is expressed as the full-width at half-maximum (FWHM) of the autocorrelation of the aberration map. In Fig. 9A and 9B, the measured mean and standard deviation of the RMS aberration amplitude from 5 isoplanatic patch measurements are shown for the left and right sides of the head for each subject. A larger standard deviation indicates a greater variation in aberrator strength among different isoplanatic patches within a single subject. Measured FWHM correlation lengths are also shown for the left and right sides of the head for each subject (C and D). A larger standard deviation indicates greater variation in the maximum spatial frequency content among different isoplanatic patches within a single subject.
Figure 9.
Measured RMS bilateral aberration strengths for each subject (A and B) displaying the mean and standard deviation from 5 isoplanatic patch measurements. A larger standard deviation indicates a larger variation in aberrator strength among different isoplanatic patches within a single subject. Measured FWHM correlation lengths are also shown for each subject (C and D). A larger standard deviation indicates greater variation in the maximum spatial frequency content among different isoplanatic patches within a single subject.
Discussion
As stated in the Results section, the aberration correction technique employed resulted in a mean increase in the number of Doppler voxels above the display threshold of 33.9%. Results in an initial human study with two subjects did not use microbubble contrast agent and produced a mean increase in color flow voxels of 92%. The current study with contrast agent produced a Doppler signal with higher pre-correction SNR, providing a more accurate evaluation of the presented aberration correction technique. While all 5 subjects showed an increase in voxels due to correcting aberration, the variance of the increase in Doppler voxels was large due to the small number of subjects scanned and the fact that in one subject, the improvement was substantial (Subject 1, Fig. 6). In the presented results, the mean variance does not decrease in many cases, which could indicate that either the aberration correction failed or that this metric is unsuitable for measuring improvements due to aberration correction in in vivo Doppler data. This metric was used because it has been previously used (Ivancevich et al. 2006; Ivancevich et al. 2008; Lindsey and Smith 2013) and because there is not a standard metric for evaluating the effect of aberration correction on Doppler data. Combining this and the previous study (Lindsey and Smith 2013), variance decreased in 4 of 7 subjects. Presented images suggest that aberration correction in fact improved image quality, so it is possible that correcting aberration may not always yield a decrease in Doppler variance due to either increasing amplitude of vessel wall echoes or an increased sensitivity to complex flow dynamics after correction. The effect of aberration correction on Doppler variance requires further study.
Though microbubble contrast agent was used in this work, we would prefer to image without the use of contrast agents to ease logistic requirements of scanning in the field. However, previous studies investigating the safety of contrast-enhanced diagnostic transcranial ultrasound imaging have found no indication of tissue damage or blood brain barrier disruption for pressures up to 2.69 MPa (Schlachetzki et al. 2002).
While the magnitude of the Doppler data—used clinically in power Doppler and to weight or threshold color Doppler velocity data—showed the expected improvement due to aberration correction, the variance of the Doppler data decreased in only 2 of 5 subjects. Although variance was expected to decrease throughout the entire volume, it should be noted that within a single isoplanatic patch, correction quality is non-uniform and is expected to decrease moving from the center to the edge of an isoplanatic patch in the same way that improvement due to correction diminished with lateral distance when only a single patch was assumed throughout an entire 3D volume (Fig. 3). Doppler variance is also expected to vary temporally throughout the cardiac cycle. From a scanning system perspective, the ability to measure these spatial and temporal dependencies of the variance of the Doppler data is limited spatially by line separation and range gates and temporally by ensemble lengths. These factors cause ultrasound color flow data to be coarsely sampled relative to B-mode data, making color flow statistics more susceptible to and less able to measure variations at high spatial or temporal frequencies. Perhaps relatively low frame rates contribute to overall high variances in this particular imaging system. Further investigation with larger numbers of both inter- and intra-subject acquisitions could better elucidate this issue.
A scanner with higher parallelization (greater than 16:1) may also address these frame rate considerations. A more modern scanning system could also improve image quality and increase spatial sampling of aberrators, as some modern 3D scanners have as many as 9000 active elements, while the scanner used in this study had only 256 receive channels. While access to channel data would still be required—a difficult proposition given partial beamforming in probe handles (Savord and Solomon 2003; Cochrane et al. 2010)—such a scanner would also allow computation to be performed online and much more quickly.
In examining the aberration characteristics shown in Fig. 9, we contribute to the small number of existing in vivo measurements of aberrator characteristics (Vignon et al. 2008; Ivancevich 2009; Lindsey and Smith 2013). The RMS aberrator amplitudes presented here are within 35 to 60 ns, in close agreement with previously published values. The low mean FWHM correlation length for Subject 4, the subject exhibiting window failure, may be explained by the fact that in the lower SNR case associated with a poor acoustic window, uncorrelated noise produces a rapid decline in the autocorrelation of the aberration map. The relatively large error bars in Fig. 9C and 9D suggest that the measurement of five different propagation paths through the skull yields measurements of aberrators with different spatial frequency content, further suggesting that unique aberrators (i.e. different isoplanatic patches) are being measured, which is the goal in this technique.
In comparing Table 1 and Figure 9, RMS aberration amplitude is consistent across all 5 subjects, so there is not a strong relationship between the strength of the aberrator and the improvement due to correction in the subjects scanned. However, aberration correction yielded the smallest improvement in subject 5, the subject exhibiting the smallest RMS delay and the greatest discrepancy in FWHM correlation length between the two sides of the head. The presence of a high spatial frequency aberrator adjacent to the left transducer may have been difficult to overcome, especially given that the correction beacon for this side had to pass through the widely-varying FWHM correlation lengths measured on the right side in this subject.
Another important effect of ultrasound propagation through the skull is amplitude distortion. While previous studies have demonstrated the benefit of correcting both amplitude and phase as a function of frequency (Wu and Fink 1991; Aubry et al. 2001; Clement and Hynynen 2002; White et al. 2005), we do not have a means of implementing amplitude correction because the scanning system used cannot transmit arbitrary waveforms on a per channel basis.
Aberration correction increased the ability to detect blood flow in the major cerebral arteries in 60% of cases after correction, compared with 46% of cases without correction. Given that color flow imaging is an inherently low SNR technique which is further limited by the skull and 3D ultrasound as discussed in the Introduction, this improvement is helpful towards achieving the end goal of developing a 3D ultrasound imaging system sensitive enough to distinguish normal and abnormal flow in all individuals. The results in this study suggest that the most clinically helpful effect of this aberration correction technique lies in its ability to fill in vessels with missing segments (Figs. 5, 6, 7), though some dropout remains. While the presence of this dropout of the Doppler signal in some of the presented images indicates that this goal has not yet been achieved, the aberration correction improvement presented here (~2–3 dB) might be combined with our earlier efforts at improving sensitivity by reducing cable lengths (~7 dB) (Lindsey et al. 2011) and reducing transducer frequency (~3–8 dB, patient-dependent) (Lindsey et al. 2013).
It should also be noted that the primary advantage of this aberration correction technique is that multiple isoplanatic patches are corrected, signifying structures are not lost at the edges of the volume as in other adaptive imaging techniques. This effect was observed in this study. For example, in Fig. 8, the Circle of Willis, despite its large spatial extent, remains entirely visible with aberration correction.
Although all data presented in this article has been Doppler magnitude (i.e. power Doppler) as we examined the question of sensitivity, quantitative measurement of cerebral blood flow velocities is most clinically useful. This measurement is most commonly performed using pulsed spectral Doppler, to which this aberration correction technique is directly applicable and should produce similar improvements. In general, the primary challenge with performing a 3D spectral Doppler exam lies in positioning a small Doppler gate within a large 3D volume either using only B-mode anatomy or a frame rate-reducing triplex mode.
If a non-invasive, real-time three-dimensional ultrasound-based technology could through imaging and blood flow velocity measurements both confirm the presence of an occlusion and rule out hemorrhage, physicians would possess all the information required to confidently form a treatment plan, including making an informed tPA decision. Given the time-sensitive nature of stroke and the corresponding urgency of this decision, the low cost and high portability of ultrasound systems allow them to potentially be used in the field or ambulance, decreasing time to tPA decision (Holscher et al. 2008; Bowman 2010; Schlachetzki et al. 2012). While either a color Doppler approach such as presented here or a perfusion imaging approach as discussed in the Introduction may detect the presence of a clot, recent progress at detecting hemorrhage with ultrasound is encouraging for solving the second and equally important part of this problem (Kukulska-Pawluczuk et al.; Kern et al. 2008; Meyer-Wiethe et al. 2009).
In summary, we have assessed the feasibility of a phase aberration correction technique for bilateral 3D transcranial ultrasound in a study of healthy volunteers using microbubble contrast agent. Aberration correction produced an increase in Doppler voxels of 33.9% and enabled detection of blood flow in 60% of arteries after correction as compared with 46% of arteries before correction. We hope that when combined with recent developments in portable ultrasound, microbubble-based imaging techniques, and transducers, 3D ultrasound might improve in quality and gain clinical acceptance for use in stroke diagnosis.
Acknowledgments
The authors thank Vivek Patel, Albert Chen, and Marko Jakovljevic for assistance moving the scanner, and Sankalp Gokhale for administering IVs. This research was supported by grants R01 HL089507 and T32EB001040 from the National Institutes of Health.
Footnotes
Publisher's Disclaimer: This is a PDF file of an unedited manuscript that has been accepted for publication. As a service to our customers we are providing this early version of the manuscript. The manuscript will undergo copyediting, typesetting, and review of the resulting proof before it is published in its final citable form. Please note that during the production process errors may be discovered which could affect the content, and all legal disclaimers that apply to the journal pertain.
References
- Aaslid R, Markwalder TM, Nornes H. Noninvasive transcranial Doppler ultrasound recording of flow velocity in basal cerebral arteries. J Neurosurg. 1982;57:769–74. doi: 10.3171/jns.1982.57.6.0769. [DOI] [PubMed] [Google Scholar]
- AIUM/NEMA. Standard for real-time display of thermal and mechanical acoustic indices on diagnostic ultrasound equipment. Laurel, MD: AIUM; 1998. [Google Scholar]
- Alexandrov AV, Wojner AW, Grotta JC. CLOTBUST: design of a randomized trial of ultrasound-enhanced thrombolysis for acute ischemic stroke. J Neuroimaging. 2004;14:108–12. [PubMed] [Google Scholar]
- Andersen G, Munch J, Veitch P. Compact, holographic correction of aberrated telescopes. Applied Optics. 1997;36:1427–32. doi: 10.1364/ao.36.001427. [DOI] [PubMed] [Google Scholar]
- Astheimer JP, Pilkington WC, Waag RC. Reduction of variance in spectral estimates for correction of ultrasonic aberration. IEEE Trans Ultrason Ferroelectr Freq Control. 2006;53:79–89. doi: 10.1109/tuffc.2006.1588393. [DOI] [PubMed] [Google Scholar]
- Aubry JF, Tanter M, Gerber J, Thomas JL, Fink M. Optimal focusing by spatio-temporal inverse filter. II. Experiments. Application to focusing through absorbing and reverberating media. J Acoust Soc Am. 2001;110:48–58. doi: 10.1121/1.1377052. [DOI] [PubMed] [Google Scholar]
- Azucena O, Crest J, Cao J, Sullivan W, Kner P, Gavel D, Dillon D, Olivier S, Kubby J. Wavefront aberration measurements and corrections through thick tissue using fluorescent microsphere reference beacons. Opt Express. 2010;18:17521–2. doi: 10.1364/OE.18.017521. [DOI] [PMC free article] [PubMed] [Google Scholar]
- Baumgartner RW, Arnold M, Gonner F, Staikow I, Herrmann C, Rivoir A, Muri RM. Contrast-enhanced transcranial color-coded duplex sonography in ischemic cerebrovascular disease. Stroke. 1997;28:2473–8. doi: 10.1161/01.str.28.12.2473. [DOI] [PubMed] [Google Scholar]
- Becker A, Kuhnt D, Bakowsky U, Nimsky C. Contrast-enhanced ultrasound ventriculography. Neurosurgery. 2012;71:ons296–301. doi: 10.1227/NEU.0b013e31826a8a97. discussion ons. [DOI] [PubMed] [Google Scholar]
- Bedggood PA, Ashman R, Smith G, Metha AB. Multiconjugate adaptive optics applied to an anatomically accurate human eye model. Opt Express. 2006;14:8019–30. doi: 10.1364/oe.14.008019. [DOI] [PubMed] [Google Scholar]
- Bogousslavsky J, Van Melle G, Regli F. The Lausanne Stroke Registry: analysis of 1,000 consecutive patients with first stroke. Stroke. 1988;19:1083–92. doi: 10.1161/01.str.19.9.1083. [DOI] [PubMed] [Google Scholar]
- Bowman J. Ultrasound Applications in EMS. Journal of Emergency Medical Services. 2010;35:36–47. doi: 10.1016/S0197-2510(10)70229-1. [DOI] [PubMed] [Google Scholar]
- Chenaitia H, Squarcioni C, Marie BP, Emgan Q, Tomislav P. Transcranial sonography in prehospital setting. Am J Emerg Med. 2011;29:1231–3. doi: 10.1016/j.ajem.2011.06.025. [DOI] [PubMed] [Google Scholar]
- Clement GT, Hynynen K. A non-invasive method for focusing ultrasound through the human skull. Phys Med Biol. 2002;47:1219–36. doi: 10.1088/0031-9155/47/8/301. [DOI] [PubMed] [Google Scholar]
- Clement GT, White PJ, Hynynen K. Enhanced ultrasound transmission through the human skull using shear mode conversion. J Acoust Soc Am. 2004;115:1356–64. doi: 10.1121/1.1645610. [DOI] [PubMed] [Google Scholar]
- Dahl JJ, Feehan TJ. Direction of arrival filters for improved aberration estimation. Ultrason Imaging. 2008;30:1–20. doi: 10.1177/016173460803000103. [DOI] [PubMed] [Google Scholar]
- Dahl JJ, Soo MS, Trahey GE. Spatial and temporal aberrator stability for real-time adaptive imaging. IEEE Trans Ultrason Ferroelectr Freq Control. 2005;52:1504–17. doi: 10.1109/tuffc.2005.1516023. [DOI] [PubMed] [Google Scholar]
- Davis SM, Donnan GA. 4. 5 hours: the new time window for tissue plasminogen activator in stroke. Stroke. 2009;40:2266–7. doi: 10.1161/STROKEAHA.108.544171. [DOI] [PubMed] [Google Scholar]
- Flax S, O’Donnell M. Phase-aberration correction using signals from point reflectors and diffuse scatterers: Basic principles. IEEE Trans Ultrason Ferroelect Freq Control. 1988;35:758–67. doi: 10.1109/58.9333. [DOI] [PubMed] [Google Scholar]
- Fry FJ, Barger JE. Acoustic properties of the human skull. J Acoust Soc Am. 1978;63:1576–90. doi: 10.1121/1.381852. [DOI] [PubMed] [Google Scholar]
- Gahn G, Gerber J, Hallmeyer S, Hahn G, Ackerman RH, Reichmann H, von Kummer R. Contrast-enhanced transcranial color-coded duplexsonography in stroke patients with limited bone windows. AJNR Am J Neuroradiol. 2000;21:509–14. [PMC free article] [PubMed] [Google Scholar]
- Hacke W, Kaste M, Bluhmki E, Brozman M, Davalos A, Guidetti D, Larrue V, Lees KR, Medeghri Z, Machnig T, Schneider D, von Kummer R, Wahlgren N, Toni D. Thrombolysis with alteplase 3 to 4. 5 hours after acute ischemic stroke. N Engl J Med. 2008;359:1317–29. doi: 10.1056/NEJMoa0804656. [DOI] [PubMed] [Google Scholar]
- Hacke W, Kaste M, Fieschi C, Toni D, Lesaffre E, von Kummer R, Boysen G, Bluhmki E, Hoxter G, Mahagne MH, et al. Intravenous thrombolysis with recombinant tissue plasminogen activator for acute hemispheric stroke. The European Cooperative Acute Stroke Study (ECASS) JAMA. 1995;274:1017–25. [PubMed] [Google Scholar]
- Hashimoto H, Etani H, Naka M, Kinoshita N, Nukada T. Assessment of the rate of successful transcranial Doppler recording through the temporal windows in Japanese with special reference to aging and sex. Nippon Ronen Igakkai Zasshi. 1992;29:119–22. doi: 10.3143/geriatrics.29.119. [DOI] [PubMed] [Google Scholar]
- Haworth KJ, Fowlkes JB, Carson PL, Kripfgans OD. Towards aberration correction of transcranial ultrasound using acoustic droplet vaporization. Ultrasound Med Biol. 2008;34:435–45. doi: 10.1016/j.ultrasmedbio.2007.08.004. [DOI] [PMC free article] [PubMed] [Google Scholar]
- Heidenreich PA, Trogdon JG, Khavjou OA, Butler J, Dracup K, Ezekowitz MD, Finkelstein EA, Hong Y, Johnston SC, Khera A, Lloyd-Jones DM, Nelson SA, Nichol G, Orenstein D, Wilson PW, Woo YJ. Forecasting the future of cardiovascular disease in the United States: a policy statement from the American Heart Association. Circulation. 2011;123:933–44. doi: 10.1161/CIR.0b013e31820a55f5. [DOI] [PubMed] [Google Scholar]
- Holscher T. Prehospital use of portable ultrasound for stroke diagnosis and treatment initiation. Air Rescue. 2012;2:48–50. [Google Scholar]
- Holscher T, Schlachetzki F, Zimmermann M, Jakob W, Ittner KP, Haslberger J, Bogdahn U, Boy S. Transcranial ultrasound from diagnosis to early stroke treatment. 1. Feasibility of prehospital cerebrovascular assessment. Cerebrovasc Dis. 2008;26:659–63. doi: 10.1159/000166844. [DOI] [PubMed] [Google Scholar]
- Holscher T, Wilkening W, Draganski B, Meves SH, Eyding J, Voit H, Bogdahn U, Przuntek H, Postert T. Transcranial ultrasound brain perfusion assessment with a contrast agent-specific imaging mode: results of a two-center trial. Stroke. 2005;36:2283–5. doi: 10.1161/01.STR.0000179038.63109.b0. [DOI] [PubMed] [Google Scholar]
- Hoyer HX, Vogl S, Schiemann U, Haug A, Stolpe E, Michalski T. Prehospital ultrasound in emergency medicine: incidence, feasibility, indications and diagnoses. Eur J Emerg Med. 2010;17:254–9. doi: 10.1097/MEJ.0b013e328336ae9e. [DOI] [PubMed] [Google Scholar]
- Ivancevich NM, Dahl JJ, Smith SW. Comparison of 3-D multi-lag cross- correlation and speckle brightness aberration correction algorithms on static and moving targets. IEEE Trans Ultrason Ferroelectr Freq Control. 2009;56:2157–66. doi: 10.1109/TUFFC.2009.1298. [DOI] [PMC free article] [PubMed] [Google Scholar]
- Ivancevich NM, Dahl JJ, Trahey GE, Smith SW. Phase-aberration correction with a 3-D ultrasound scanner: feasibility study. IEEE Trans Ultrason Ferroelectr Freq Control. 2006;53:1432–9. doi: 10.1109/tuffc.2006.1665100. [DOI] [PubMed] [Google Scholar]
- Ivancevich NM, Pinton GF, Nicoletto HA, Bennett E, Laskowitz DT, Smith SW. Real-Time 3D Contrast-Enhanced Transcranial Ultrasound and Aberration Correction. Ultrasound in Medicine and Biology. 2008;34:1387–95. doi: 10.1016/j.ultrasmedbio.2008.01.015. [DOI] [PMC free article] [PubMed] [Google Scholar]
- Jensen JA. Estimation of Blood Velocities Using Ultrasound. Cambridge: Cambridge University Press; 1996. [Google Scholar]
- Johnston DC, Welsh BM. Analysis of multiconjugate adaptive optics. J Opt Soc Am. 1994;11:394–408. [Google Scholar]
- Kern R, Diels A, Pettenpohl J, Kablau M, Brade J, Hennerici MG, Meairs S. Real-time ultrasound brain perfusion imaging with analysis of microbubble replenishment in acute MCA stroke. J Cereb Blood Flow Metab. 2011;31:1716–24. doi: 10.1038/jcbfm.2011.14. [DOI] [PMC free article] [PubMed] [Google Scholar]
- Kern R, Kablau M, Sallustio F, Fatar M, Stroick M, Hennerici MG, Meairs S. Improved detection of intracerebral hemorrhage with transcranial ultrasound perfusion imaging. Cerebrovasc Dis. 2008;26:277–83. doi: 10.1159/000147456. [DOI] [PubMed] [Google Scholar]
- Krejza J, Swiat M, Pawlak MA, Oszkinis G, Weigele J, Hurst RW, Kasner S. Suitability of temporal bone acoustic window: conventional TCD versus transcranial color-coded duplex sonography. J Neuroimaging. 2007;17:311–4. doi: 10.1111/j.1552-6569.2007.00117.x. [DOI] [PubMed] [Google Scholar]
- Kukulska-Pawluczuk B, Ksiazkiewicz B, Nowaczewska M. Imaging of spontaneous intracerebral hemorrhages by means of transcranial color-coded sonography. Eur J Radiol. 81:1253–8. doi: 10.1016/j.ejrad.2011.02.066. [DOI] [PubMed] [Google Scholar]
- Lindsey BD, Light ED, Nicoletto HA, Bennett ER, Laskowitz DT, Smith SW. The ultrasound brain helmet: new transducers and volume registration for in vivo simultaneous multi-transducer 3-D transcranial imaging. IEEE Trans Ultrason Ferroelectr Freq Control. 2011;58:1189–202. doi: 10.1109/TUFFC.2011.1929. [DOI] [PMC free article] [PubMed] [Google Scholar]
- Lindsey BD, Nicoletto HA, Bennett E, Laskowitz DT, Smith SW. Simultaneous bilateral real-time 3D transcranial ultrasound imaging at 1 MHz through poor acoustic windows. Ultrasound in Medicine and Biology. 2013;39:721–34. doi: 10.1016/j.ultrasmedbio.2012.11.019. [DOI] [PMC free article] [PubMed] [Google Scholar]
- Lindsey BD, Smith SW. Pitch-catch phase aberration correction of multiple isoplanatic patches for 3D transcranial ultrasound imaging. IEEE Trans Ultrason Ferroelectr Freq Control. 2013;60:463–80. doi: 10.1109/TUFFC.2013.2590. [DOI] [PMC free article] [PubMed] [Google Scholar]
- Liu DL, Waag RC. Time-shift compensation of ultrasonic pulse focus degradation using least-mean-square error estimates of arrival time. J Acoust Soc Am. 1994;95:542–55. doi: 10.1121/1.408348. [DOI] [PubMed] [Google Scholar]
- Maciak A, Kier C, Seidel G, Meyer-Wiethe K, Hofmann UG. Detecting stripe artifacts in ultrasound images. J Digit Imaging. 2009;22:548–57. doi: 10.1007/s10278-007-9049-0. [DOI] [PMC free article] [PubMed] [Google Scholar]
- Marchetti E, Brast R, Delabre B, Donaldson R, Fedrigo E, Frank C, Hubin N. On-sky testing of the multi-conjugate adaptive optics demonstrator. The Messenger. 2007;129:8–13. [Google Scholar]
- Marinoni M, Ginanneschi A, Forleo P, Amaducci L. Technical limits in transcranial Doppler recording: inadequate acoustic windows. Ultrasound Med Biol. 1997;23:1275–7. doi: 10.1016/s0301-5629(97)00077-x. [DOI] [PubMed] [Google Scholar]
- Meyer-Wiethe K, Sallustio F, Kern R. Diagnosis of intracerebral hemorrhage with transcranial ultrasound. Cerebrovasc Dis. 2009;27 (Suppl 2):40–7. doi: 10.1159/000203125. [DOI] [PubMed] [Google Scholar]
- Muller RA, Buffington A. Real-time correction of atmospherically degraded telescope images through image sharpening. J Opt Soc Am. 1974;64:1200–9. [Google Scholar]
- Nedelmann M, Stolz E, Gerriets T, Baumgartner RW, Malferrari G, Seidel G, Kaps M. Consensus recommendations for transcranial color-coded duplex sonography for the assessment of intracranial arteries in clinical trials on acute stroke. Stroke. 2009;40:3238–44. doi: 10.1161/STROKEAHA.109.555169. [DOI] [PubMed] [Google Scholar]
- Pichardo S, Sin VW, Hynynen K. Multi-frequency characterization of the speed of sound and attenuation coefficient for longitudinal transmission of freshly excised human skulls. Phys Med Biol. 2011;56:219–50. doi: 10.1088/0031-9155/56/1/014. [DOI] [PMC free article] [PubMed] [Google Scholar]
- Pinton G, Aubry JF, Fink M, Tanter M. Effects of nonlinear ultrasound propagation on high intensity brain therapy. Med Phys. 2011;38:1207–16. doi: 10.1118/1.3531553. [DOI] [PubMed] [Google Scholar]
- Postert T, Federlein J, Przuntek H, Buttner T. Insufficient and absent acoustic temporal bone window: potential and limitations of transcranial contrast-enhanced color-coded sonography and contrast-enhanced power-based sonography. Ultrasound Med Biol. 1997;23:857–62. doi: 10.1016/s0301-5629(97)00047-1. [DOI] [PubMed] [Google Scholar]
- Roger VL, Go AS, Lloyd-Jones DM, Benjamin EJ, Berry JD, Borden WB, Bravata DM, Dai S, Ford ES, Fox CS, Fullerton HJ, Gillespie C, Hailpern SM, Heit JA, Howard VJ, Kissela BM, Kittner SJ, Lackland DT, Lichtman JH, Lisabeth LD, Makuc DM, Marcus GM, Marelli A, Matchar DB, Moy CS, Mozaffarian D, Mussolino ME, Nichol G, Paynter NP, Soliman EZ, Sorlie PD, Sotoodehnia N, Turan TN, Virani SS, Wong ND, Woo D, Turner MB. Heart Disease and Stroke Statistics--2012 Update: A Report From the American Heart Association. Circulation. 2011;125:e2–e220. doi: 10.1161/CIR.0b013e31823ac046. [DOI] [PMC free article] [PubMed] [Google Scholar]
- Schlachetzki F, Herzberg M, Holscher T, Ertl M, Zimmermann M, Ittner KP, Pels H, Bogdahn U, Boy S. Transcranial ultrasound from diagnosis to early stroke treatment: part 2: prehospital neurosonography in patients with acute stroke: the Regensburg stroke mobile project. Cerebrovasc Dis. 2012;33:262–71. doi: 10.1159/000334667. [DOI] [PubMed] [Google Scholar]
- Schlachetzki F, Holscher T, Koch HJ, Draganski B, May A, Schuierer G, Bogdahn U. Observation on the integrity of the blood-brain barrier after microbubble destruction by diagnostic transcranial color-coded sonography. J Ultrasound Med. 2002;21:419–29. doi: 10.7863/jum.2002.21.4.419. [DOI] [PubMed] [Google Scholar]
- Seidel G, Algermissen C, Christoph A, Claassen L, Vidal-Langwasser M, Katzer T. Harmonic imaging of the human brain. Visualization of brain perfusion with ultrasound. Stroke. 2000;31:151–4. doi: 10.1161/01.str.31.1.151. [DOI] [PubMed] [Google Scholar]
- Seidel G, Kaps M, Gerriets T. Potential and limitations of transcranial color-coded sonography in stroke patients. Stroke. 1995;26:2061–6. doi: 10.1161/01.str.26.11.2061. [DOI] [PubMed] [Google Scholar]
- Sims JR, Rordorf G, Smith EE, Koroshetz WJ, Lev MH, Buonanno F, Schwamm LH. Arterial occlusion revealed by CT angiography predicts NIH stroke score and acute outcomes after IV tPA treatment. AJNR Am J Neuroradiol. 2005;26:246–51. [PMC free article] [PubMed] [Google Scholar]
- Smith SW, Ivancevich NM, Lindsey BD, Whitman JJ, Light ED, Fronheiser MP, Nicoletto HA, Laskowitz DT. The ultrasound brain helmet: Feasibility study of multiple simultaneous 3D scans of cerebral vasculature. Ultrasound in Medicine and Biology. 2009;35:329–38. doi: 10.1016/j.ultrasmedbio.2008.08.016. [DOI] [PubMed] [Google Scholar]
- Smith SW, Pavy HG, von Ramm OT. High speed ultrasound volumetric imaging system part I: Transducer design and beam steering. IEEE Transactions on Ultrasonics Ferroelectrics and Frequency Control. 1991;38:100–8. doi: 10.1109/58.68466. [DOI] [PubMed] [Google Scholar]
- Smith SW, Trahey GE, von Ramm OT. Phased array ultrasound imaging through planar tissue layers. Ultrasound Med Biol. 1986;12:229–43. doi: 10.1016/0301-5629(86)90314-5. [DOI] [PubMed] [Google Scholar]
- Steinberg BD. Radar imaging from a distorted array: the radio camera algorithm and experimenls. IEEE Trans Antennas Propagat. 1981;29:740–8. [Google Scholar]
- Taner MT, Koehler F, Alhilali Estimation and correction of near-surface time anomalies. Geophys. 1974;39:442–63. [Google Scholar]
- Tanter M, Aubry JF, Gerber J, Thomas JL, Fink M. Optimal focusing by spatio-temporal inverse filter. I. Basic principles. J Acoust Soc Am. 2001;110:37–47. doi: 10.1121/1.1377051. [DOI] [PubMed] [Google Scholar]
- Tillett JC, Astheimer JP, Waag RC. A model of distributed phase aberration for deblurring phase estimated from scattering. IEEE Trans Ultrason Ferroelectr Freq Control. 2010;57:214–28. doi: 10.1109/TUFFC.2010.1400. [DOI] [PMC free article] [PubMed] [Google Scholar]
- Vignon F, Aubry JF, Tanter M, Margoum A, Fink M. Adaptive focusing for transcranial ultrasound imaging using dual arrays. J Acoust Soc Am. 2006;120:2737–45. doi: 10.1121/1.2354073. [DOI] [PubMed] [Google Scholar]
- Vignon F, Shi WT, Yin X, Hoelscher T, Powers JE. The stripe artifact in transcranial ultrasound imaging. J Ultrasound Med. 2010;29:1779–86. doi: 10.7863/jum.2010.29.12.1779. [DOI] [PubMed] [Google Scholar]
- von Ramm OT, Smith SW, Pavy HG. High speed ultrasound volumetric imaging system part II: Parallel processing and display. IEEE Transactions on Ultrasonics Ferroelectrics and Frequency Control. 1991;38:109–15. doi: 10.1109/58.68467. [DOI] [PubMed] [Google Scholar]
- Waag RC, Astheimer JP. Statistical estimation of ultrasonic propagation path parameters for aberration correction. IEEE Trans Ultrason Ferroelectr Freq Control. 2005;52:851–69. doi: 10.1109/tuffc.2005.1503972. [DOI] [PubMed] [Google Scholar]
- Wessels T, Bozzato A, Mull M, Klotzsch C. Intracranial collateral pathways assessed by contrast-enhanced three-dimensional transcranial color-coded sonography. Ultrasound Med Biol. 2004;30:1435–40. doi: 10.1016/j.ultrasmedbio.2004.05.011. [DOI] [PubMed] [Google Scholar]
- White DN, Stevenson RJ. The acoustic characteristics of the skull. Ultrasound in Medicine and Biology. 1978;4:225–52. doi: 10.1016/0301-5629(78)90054-6. [DOI] [PubMed] [Google Scholar]
- White J, Clement GT, Hynynen K. Transcranial ultrasound focus reconstruction with phase and amplitude correction. IEEE Trans Ultrason Ferroelectr Freq Control. 2005;52:1518–22. doi: 10.1109/tuffc.2005.1516024. [DOI] [PubMed] [Google Scholar]
- White PJ, Clement GT, Hynynen K. Longitudinal and shear mode ultrasound propagation in human skull bone. Ultrasound Med Biol. 2006;32:1085–96. doi: 10.1016/j.ultrasmedbio.2006.03.015. [DOI] [PMC free article] [PubMed] [Google Scholar]
- Wilson MH, Levett DZ, Dhillon S, Mitchell K, Morgan J, MPWG, Imray C. Stroke at high altitude diagnosed in the field using portable ultrasound. Wilderness & Environmental Medicine. 2011;22:54–7. doi: 10.1016/j.wem.2010.10.007. [DOI] [PubMed] [Google Scholar]
- World Health Organization. The top 10 causes of death: Fact sheet no 310. 2011. [Google Scholar]


