

Abstract
Objective
Overfeeding is associated with insulin resistance. Studies on animals suggest this is likely due to disruption of fatty acid metabolism and increased plasma free fatty acid (FFA) availability during the night. We tested the hypothesis that overfeeding induces insulin resistance and increases nocturnal but not daytime plasma FFA availability in human subjects.
Design and Methods
We measured plasma glucose, insulin, and FFA concentrations hourly for 24 hours during a day of isocaloric feeding and a day of hypercaloric feeding (30% calorie excess) in 8 overweight and obese, non-diabetic men (age: 38±3 years; body mass index: 34±2 kg/m2).
Results
Overfeeding had no effect on daytime plasma glucose, insulin, and FFA concentrations compared to isocaloric feeding, but increased nocturnal glucose (P=0.007) and insulin (P=0.003) concentrations and decreased nocturnal FFA concentration (P=0.006). The homeostasis model assessment of insulin resistance score was ~30% greater the morning after hypercaloric than isocaloric feeding (P=0.040).
Conclusions
One day of overfeeding has no effect on daytime plasma glucose and FFA concentrations but increases nocturnal plasma glucose and insulin concentrations, whereas nocturnal plasma FFA availability is reduced. The acute overfeeding-induced development of insulin resistant glucose metabolism therefore does not appear to be directly mediated by plasma FFA availability.
Keywords: hypercaloric, diurnal, insulin resistance, overnight
INTRODUCTION
Obesity develops as a result of chronic positive energy balance (i.e., dietary energy intake exceeds energy expenditure) and is associated with insulin resistance in adipose tissue, liver, and muscle and thus inadequate insulin-mediated suppression of adipose tissue lipolysis and hepatic glucose production and blunted insulin-mediated stimulation of skeletal muscle glucose uptake (1). This results in increased plasma glucose concentration and free fatty acid (FFA) availability unless increased insulin secretion is able to overcome insulin resistance in adipose tissue, liver and muscle (1–4). It has been suggested that muscle and liver insulin resistance in obese subjects develop secondary to increased body fat stores and obesity-associated adipose tissue dysfunction (i.e., insulin resistance and inflammation) which leads to increased plasma FFA availability and FFA-induced muscle and liver insulin resistance (5). However, the results from several overfeeding studies indicate that insulin resistance of glucose metabolism develops rapidly, as indicated by increased plasma insulin concentrations and no change or an increase in plasma glucose concentration after only 3 to 7 days of overfeeding (6–13), well before significant adipose tissue expansion and adipose tissue dysfunction develops (14). Basal plasma FFA availability, on the other hand, is reduced by 35–75% after overfeeding for 3 to 7 days (7,8,10–13,15), which suggests that plasma FFA are not involved in the pathogenesis of short-term overfeeding-induced insulin resistance. However, the results from overfeeding studies published to date provide only limited, “snap-shot” information from samples obtained after subjects fasted overnight. Studies on dogs suggest that overfeeding increases nocturnal but not daytime FFA availability (16). Night-time FFA availability may be critically important for daytime glucose homeostasis because it has been demonstrated that suppression of nocturnal FFA availability in insulin resistant subjects with type 2 diabetes readily reduces plasma insulin and glucose concentrations in the morning (17,18).
The purpose of our study therefore was to examine the effect of overfeeding on diurnal variations in plasma glucose, insulin, and FFA concentrations in human subjects. To this end, we measured plasma glucose, insulin, and FFA concentrations hourly for 24 hours during a day of isocaloric feeding (i.e., energy intake matched total daily energy requirement for weight maintenance) and a day of hypercaloric feeding (i.e., energy intake exceeded total daily energy requirement for weight maintenance by 30%), in overweight and obese, non-diabetic men. We hypothesized that overfeeding would alter nocturnal but not daytime plasma glucose and FFA homeostasis.
METHODS
Subjects and pre-study testing
Eight overweight and obese men who had been weight-stable (<2 kg change) and had not been participating in regular physical activity for ≥90 min/week (i.e., the minimum recommended amount of exercise (19,20)) for at least 6 months participated in this study (Table 1). Written informed consent was obtained from all subjects before participation in the study, which was approved by the Institutional Review Board of Washington University School of Medicine in St. Louis, MO.
Table 1.
Subjects’ age, body composition and basic metabolic status at the time of screening.
| Mean ± SEM | |
|---|---|
| Age (years) | 38 ± 3 |
| Body mass index (kg/m2) | 34 ± 2 |
| Body weight (kg) | 105 ± 7 |
| Fat-free mass (kg) | 75 ± 4 |
| Body fat (% total body weight) | 28 ± 2 |
| Resting energy expenditure (kcal/day) | 2,133 ± 181 |
| Insulin (pmol/L) | 56 ± 12 |
| Glucose, OGTT t = 0 (mmol/L) | 5.2 ± 0.2 |
| Glucose, OGTT t = 120 min (mmol/L) | 6.2 ± 0.5 |
| Total cholesterol (mmol/L) | 4.73 ± 0.24 |
| HDL-cholesterol (mmol/L) | 1.01 ± 0.07 |
| LDL-cholesterol (mmol/L) | 2.92 ± 0.25 |
| Triglyceride (mmol/L) | 1.81 ± 0.26 |
OGTT = 75 g oral glucose tolerance test; HDL = high-density lipoprotein; LDL = low-density lipoprotein.
All subjects completed a comprehensive medical examination, including a detailed history and physical examination, a resting electrocardiogram, standard blood tests, and an oral glucose tolerance test. None of the subjects had evidence of chronic illness or significant organ dysfunction (e.g., impaired glucose tolerance, diabetes mellitus, cirrhosis, hypo- or hyper-thyroidism), or were taking medications known to affect metabolism.
Total body fat mass and fat-free mass were determined by using dual energy X-ray absorptiometry (DXA, Hologic QDR 1000/w, Waltham, MA). Resting metabolic rate (RMR) was determined after 30 min of bed rest by using online expiratory gas exchange analysis (TrueOne 2400; ParvoMedics, Sandy, UT); the total daily energy requirement for weight maintenance in ambulatory but otherwise sedentary subjects was assumed to be 1.25 × RMR (21).
Experimental design
Each subject completed a 24-hour isocaloric metabolic study (i.e., energy intake matched total daily energy requirement for weight maintenance) and a 24-hour hypercaloric metabolic study (i.e., energy intake exceeded total daily energy requirement for weight maintenance by 30%), in randomized order, approximately 4 weeks apart (Figure 1). Subjects were instructed to consume their regular diet and to refrain from exercise for at least 3 days before each study. They were admitted to the inpatient unit of the Clinical Research Unit (CRU) in the late afternoon the day before the study, consumed a standard dinner between 6 and 7 pm, and then fasted, except for water, until the next morning. The following day, at approximately 6 am, a catheter was inserted into a hand vein to obtain twenty four hourly (starting at 7 am; t = 0 h) arterialized blood samples by heating the hand to 55 °C in a thermostatically controlled box for 15 min before each sample was obtained.
Figure 1.
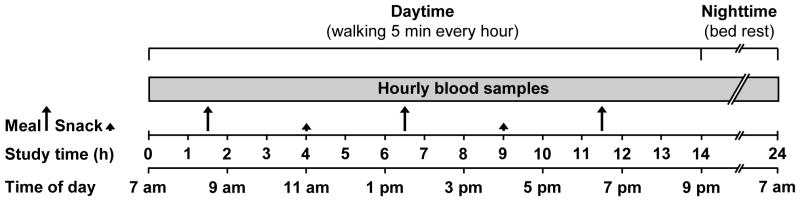
Schematic representation of the study protocol. Subjects were admitted to the Clinical Research Unit in the evening before the isocaloric and hypercaloric study, which was initiated after an overnight fast. Blood samples were obtained hourly for 24 h starting at 7 am on the first morning. During the isocaloric and hypercaloric study, subjects consumed the same breakfast, lunch and dinner meals, which contained equal amounts of energy and together provided 70% of total daily energy requirement for weight maintenance. In addition, subjects consumed two snacks that provided 15% of total daily energy requirement for weight maintenance each during the isocaloric study and 30% of total daily energy requirement each during the hypercaloric study, so that total energy intake in the hypercaloric trial exceeded that in the isocaloric trial by ~30%. Subjects were asked to walk for 5 min every hour on the hour from 7 am to 7 pm; thereafter, they rested in bed and fasted until completion of the study the next morning. See text for details.
Diet
For each study (iso- and hypercaloric), subjects consumed three meals (breakfast, lunch and dinner served at 8:30 am, 1:30 pm, and 6:30 pm, respectively) which contained equal amounts of energy and together provided 70% of total daily energy requirement for weight maintenance. During the isocaloric trial, subjects consumed two snacks (morning at 11 am and afternoon at 4 pm) that accounted for 15% of total daily energy requirement each and provided the additional energy required for weight maintenance; during the hypercaloric trial, subjects consumed two snacks that provided 30% of total daily energy requirement each so that total energy intake exceeded total daily energy requirement by 30% (Figure 1). Each meal and snack contained ~55% of total energy as carbohydrate, 30% as fat, and 15% as protein. Subjects were required to consume all of the food provided to them and were allowed to drink water or non-caloric, caffeine-free beverages only.
Physical activity
During the day, subjects sat in a chair or rested in bed and were asked to walk around the research unit for 5 min every hour between 7 am and 7 pm (i.e., 60 min total). Assuming 2–3 Metabolic Equivalents (MET) for this type of activity (22), the physical activity-induced energy expenditure was approximately 50–100 kcal/day in excess of our subjects’ resting energy expenditure in both trials. After dinner (7 pm), subjects rested in bed and fasted until completion of the study the next morning at 7 am.
Sample collection, processing and analyses
Blood samples were collected in chilled tubes containing: i) heparin to determine glucose and insulin concentrations, and ii) EDTA to determine FFA and triglyceride concentrations. Samples were placed in an ice bath, and plasma was separated by centrifugation within 30 min of collection. Aliquots of fresh plasma were kept at 4 ºC for isolation of the triglyceride-rich lipoprotein (TRL) fraction, which is responsible for the increase in total plasma triglyceride concentration following meal ingestion (23). The TRL fraction was isolated from plasma by ultracentrifugation in a 50.4 Ti rotor (Beckman Instruments Inc., Palo Alto, CA) at 100,000 g for 16 h at 10 °C; the top layer, containing TRL, was collected by tube slicing (Beckman Instruments Inc., Palo Alto, CA). Plasma samples and TRL fractions were stored at –80 °C until final analyses were performed.
Plasma glucose concentration was determined on an automated glucose analyzer (Yellow Spring Instruments Co, Yellow Springs, OH). Plasma insulin concentration was measured by using a chemiluminescent immunoassay (Immulite 1000, Diagnostic Products Corporation, Los Angeles, CA). Plasma FFA concentrations were quantified by using an enzymatic colorimetric assay (Wako Diagnostics, Richmond, VA). TRL-triglyceride concentration was determined by using a colorimetric enzymatic kit (SIGMA Chemicals, St. Louis, MO).
The homeostasis model assessment of insulin resistance (HOMA-IR) score was calculated as the product of plasma insulin (mU/l) and glucose (mmol/l) concentrations divided by 22.5 at the end of the 24-h iso- or hypercaloric feeding period after subjects had fasted overnight (24).
Statistical analysis
Analysis of variance for repeated measurements with two within-subject factors (trial × time) was performed to test the significance of differences in outcomes between the iso- and hypercaloric study days. Analyses were performed for the entire 24-hour study period as well as daytime (t = 0–14 h; 7 am-9 pm) and nighttime (t = 14–24 h; 9 pm-7 am) separately. Areas under the concentration-versus-time curves (AUC) were calculated by using the trapezoidal rule, and expressed either as total AUCs (for plasma FFA concentration which decreased from baseline after the first meal and gradually returned to baseline values at the end of the study) or the AUC above baseline (for plasma glucose and insulin concentrations which increased from baseline after the first meal and gradually returned to baseline values at the end of the study). The statistical significance of differences in AUC between the isocaloric and hypercaloric study days were evaluated by using Student’s paired t-test. All analyses were carried out with SPSS 19 for Windows (SPSS, Chicago, IL). Results are presented as means ± SEM. A P-value of <0.05 was considered statistically significant.
RESULTS
Dietary interventions
Subjects consumed 96 ± 1% of the calories provided to them. In the hypercaloric trial, they consumed (by design) significantly more protein, carbohydrate and fat than in the isocaloric trial, and were therefore in positive energy balance, i.e., they consumed 825 ± 53 kcal in excess of their total daily energy requirement for weight maintenance, which corresponded to a 33 ± 2% energy surplus and an additional intake of 113 ± 10 g carbohydrate, 28 ± 2 g fat, and 34 ± 3 g protein, equally divided between the two snacks (morning and afternoon).
Metabolic profile
Plasma glucose concentration (Figure 2A) in both trials was lowest at 7 am, and increased to peak concentrations of ~30% above basal values after breakfast, lunch and dinner and to a lesser extent after the snacks. During the night, plasma glucose concentration gradually decreased towards baseline values in both trials. During the day, plasma glucose concentration was not different between the hypercaloric and the isocaloric trials; however, the nighttime decrease in plasma glucose concentration was slower in the hypercaloric than the isocaloric trial (P for trial × time interaction = 0.02). The integrated 24-h rise in plasma glucose concentration above basal values (AUC) was ~70% greater in the hypercaloric than the isocaloric trial (P = 0.003) exclusively due to a significantly greater AUC above baseline during nighttime (P = 0.007) (Figure 2A).
Figure 2.

Plasma glucose (A), insulin (B), and free fatty acid (FFA, C) concentrations during the isocaloric and hypercaloric trials. Summary measures (areas under the curve above baseline [dAUC] for glucose and insulin and total area under the curve [AUC] for FFA) are shown in the inserts. Data are means ± SEM. * Value in the hypercaloric trial is significantly different from the corresponding value in the isocaloric trial, P < 0.05. Large and small arrows indicate the time of meal and snack consumption, respectively.
Plasma insulin concentration (Figure 2B) in both trials was also lowest at 7 am, and increased to ~10 times the basal values after breakfast with relatively small peaks and troughs during the day. During the night, plasma insulin concentration gradually decreased towards baseline values. At 7 am on the next day, plasma insulin concentration was back to baseline in the isocaloric trial, but remained ~30% above baseline in the hypercaloric trial (P = 0.039). The integrated rise (AUC) above baseline in plasma insulin concentration during the whole 24-h study period was ~45% greater in the hypercaloric than the isocaloric trial but the difference did not reach significance (P = 0.073), whereas insulin AUC above baseline during the night was ~120% greater in the hypercaloric than in the isocaloric trial (P = 0.003) (Figure 2B).
The HOMA-IR score was ~30% greater the morning after hypercaloric than isocaloric feeding (2.8 ± 0.6 and 2.1 ± 0.5, respectively; P = 0.040).
Plasma FFA concentration (Figure 2C) in both trials was highest at 7 am, was suppressed by ~75% following breakfast and remained below basal values throughout the day; after dinner, plasma FFA concentration quickly rose back to or near baseline values in both trials. The daytime suppression of plasma FFA concentration was not different between trials, whereas the nighttime return to baseline was delayed in the hypercaloric compared with the isocaloric trial (P for trial × time interaction = 0.002). Accordingly, the plasma FFA concentration AUC during the 24-h study period was ~10% less in the hypercaloric than the isocaloric trial (P = 0.026), which was entirely due to reduced nighttime FFA AUC in the hypercaloric than the isocaloric trial (P = 0.006).
Plasma TRL-triglyceride concentration was not different between trials at the beginning of the study (1.11 ± 0.26 and 1.30 ± 0.32 mmol/L in the isocaloric and hypercaloric trials, respectively; P = 0.331), continuously rose to a peak concentration of 2.43 ± 0.49 and 2.68 ± 0.63 mmol/L in the isocaloric and hypercaloric trials, respectively, at ~ 4 pm (both trials), and returned to baseline values thereafter. There were no significant differences between trials (P > 0.47) and no trial × time interactions (P > 0.85).
DISCUSSION
We evaluated the effect of overfeeding for one day on 24-hour plasma glucose homeostasis and FFA availability in sedentary, overweight and obese, non-diabetic men. We found that a single day of overfeeding, providing ~30% calories in excess of needs, had no effect on daytime plasma glucose and FFA concentrations; however, it increased nocturnal plasma glucose and insulin concentrations and decreased nocturnal plasma FFA concentration. TRL-triglyceride concentration was not affected by overfeeding, presumably because of the small amount of excess fat intake (~14 g of fat per snack). These findings suggest that a single day of overfeeding causes insulin-resistant glucose metabolism in the absence of increased plasma FFA availability. Increased plasma FFA availability is therefore most likely not involved in the pathogenesis of the acute overfeeding-induced insulin resistant glucose metabolism, which is consistent with the notion that insulin resistance in obese persons is not directly related to or caused by increased plasma FFA availability (25). Moreover, these results indicate that early morning glucose monitoring in the overnight fasted condition fails to reveal the adverse effects of overfeeding on glucose homeostasis.
The effect of short-term overfeeding on plasma glucose concentration after an overnight fast has been studied many times but the results have been inconsistent. Some investigators reported increased fasting plasma glucose concentrations after 3–7 days of overfeeding (8–10,12,13) but others did not (6,7,11,15). Some of the discrepancy in results could be due to subject characteristics, the degree of overfeeding, which ranged from 35% to 75% in these studies, and the duration of overfeeding. To our knowledge, daylong plasma glucose concentrations in response to short-term overfeeding have not been previously reported. The results from our study provide important new insights and suggest that the timing of measurements with respect to the duration of fasting is critically important.
The overfeeding-induced increase in nocturnal plasma glucose concentration in our study was most likely due to insulin resistance, rather than insufficient insulin secretion, because plasma insulin concentration was increased by overfeeding in our and most other short-term overfeeding studies (6–12), and studies that evaluated the effect of overfeeding on insulin kinetics have found that overfeeding increases pancreatic insulin secretion (13,26,27). Therefore, β-cell dysfunction and inadequate insulin secretion in response to overfeeding is most likely not responsible for the increase in plasma glucose concentration. The increase in plasma insulin concentration, although small, was sufficient to maintain normal plasma glucose concentration during daytime, but was insufficient to maintain normal plasma glucose concentration during the night. This suggests that overfeeding affected predominately hepatic insulin sensitivity, which is consistent with the overfeeding-induced increase in the HOMA-IR score at the end of the overnight fast. In the absence of carbohydrate ingestion, plasma glucose concentration is largely maintained by hepatic glucose secretion, and the HOMA-IR score, although only a crude measure of “global” insulin sensitivity, is largely determined by hepatic insulin sensitivity (28). Hepatic glucose production is exquisitely sensitive to changes in plasma insulin concentration within the postabsorptive concentration range (1) and is nearly completely suppressed during and for several hours after meal ingestion (29,30) (i.e., during much of the day) whereas insulin stimulation of skeletal muscle glucose uptake requires plasma insulin concentrations in the postprandial range (1). In fact, 5 days of 40–50% excess energy intake increases basal hepatic glucose production rates by 20–35% (10,13), whereas skeletal muscle glucose uptake is not affected (11,13); muscle glucose uptake decreases only after longer-duration (1–4 months) overfeeding and significant gains (3–8%) in body weight and fat mass (8,27). Similarly, short-term (48 h) calorie restriction improves hepatic but not muscle insulin sensitivity, which requires significant changes in body weight and fat mass to improve (31). Although we did not directly evaluate hepatic and skeletal muscle insulin sensitivity, these lines of reasoning suggest that skeletal muscle may not be as sensitive as the liver to acute changes in energy intake.
The mechanism(s) responsible for the overfeeding-induced insulin resistance and the disruption of nocturnal glucose homeostasis are not clear but most likely do not directly involve FFA because plasma FFA availability was the same (daytime) or less (nighttime) during hypercaloric compared with isocaloric feeding. Our findings are consistent with earlier studies that measured plasma FFA concentrations after an overnight fast and found lower FFA concentrations after short periods (3–7 days) of overfeeding (7,8,10–13,15). However, we cannot exclude the possibility of overfeeding-induced changes in intracellular fatty acid flux and/or metabolite concentrations and related signaling pathways that may interfere with insulin action (32–36). Our findings also suggest that overfeeding itself does not affect adipose tissue insulin sensitivity because, as expected, plasma FFA availability decreased in the presence of increased plasma insulin concentration during the night. This is supported by studies on animals which found that short-term overfeeding (3 days) does not impair insulin signaling in white adipose tissue (37). The increase in nocturnal adipose tissue FFA release and FFA concentration in obese, insulin-resistant individuals (38–40) is therefore most likely not due to increased energy intake per se but seems to develop in response to body weight and fat gain.
In summary, we found that a single day of overfeeding (~30% energy excess) with a mixed diet has no effect on daytime plasma glucose and FFA concentrations but increases nocturnal plasma glucose and insulin concentrations in overweight and obese, but otherwise healthy men, most likely due to hepatic insulin resistance, whereas nocturnal plasma FFA availability is reduced. Our findings help explain inconsistent results from previous overfeeding studies and indicate that the adverse effects of short-term overfeeding on glucose metabolism are most likely not detectable with standard blood sampling protocols used in clinical practice (i.e. measurements of blood glucose concentrations in the overnight fasted state or after a glucose challenge). Further characterizing the temporal relationship between overfeeding, body weight and fat gain, and the alterations in hepatic, skeletal muscle, and adipose tissue insulin action will be important in better understanding obesity-associated insulin resistance.
What is already known about this subject?
Short-term overfeeding (3–7 days) increases fasting plasma insulin concentrations.
Studies in animals indicate that overfeeding-induced insulin resistance is due to increased nocturnal plasma free fatty acid availability.
Suppression of nocturnal free fatty acid availability in insulin-resistant human subjects reduces plasma insulin and glucose concentrations in the morning.
What does this study add?
A single day of overfeeding has no effect on daytime plasma glucose and free fatty acid concentrations but increases nocturnal plasma glucose and insulin concentrations and decreases nocturnal plasma free fatty acid availability.
Acute overfeeding-induced insulin resistance in humans is not directly mediated by plasma free fatty acid availability.
Acknowledgments
The authors thank Megan Steward and Rachel Burrows for help in subject recruitment, Jennifer Shew for their technical assistance, the staff of the Clinical Research Unit for their help in performing the studies, and the study subjects for their participation.
Grant support: This publication was made possible by NIH grants HD 57796, DK 56341 (Nutrition and Obesity Research Center), RR024992 (Washington University School of Medicine Clinical Translational Science Award) and RR-00954 (Biomedical Mass Spectrometry Resource), and an American Heart Association fellowship award (0510015Z) to Faidon Magkos.
Footnotes
Competing interests: The authors have no competing interests.
References
- 1.Conte C, Fabbrini E, Kars M, Mittendorfer B, Patterson BW, Klein S. Multiorgan insulin sensitivity in lean and obese subjects. Diabetes Care. 2012;35:1316–1321. doi: 10.2337/dc11-1951. [DOI] [PMC free article] [PubMed] [Google Scholar]
- 2.Reeds DN, Stuart CA, Perez O, Klein S. Adipose tissue, hepatic, and skeletal muscle insulin sensitivity in extremely obese subjects with acanthosis nigricans. Metabolism. 2006;55:1658–1663. doi: 10.1016/j.metabol.2006.08.006. [DOI] [PubMed] [Google Scholar]
- 3.McQuaid SE, Hodson L, Neville MJ, Dennis AL, Cheeseman J, Humphreys SM, et al. Downregulation of adipose tissue fatty acid trafficking in obesity: a driver for ectopic fat deposition? Diabetes. 2011;60:47–55. doi: 10.2337/db10-0867. [DOI] [PMC free article] [PubMed] [Google Scholar]
- 4.Hickner RC, Racette SB, Binder EF, Fisher JS, Kohrt WM. Suppression of whole body and regional lipolysis by insulin: effects of obesity and exercise. J Clin Endocrinol Metab. 1999;84:3886–3895. doi: 10.1210/jcem.84.11.6137. [DOI] [PubMed] [Google Scholar]
- 5.Mittendorfer B. Origins of metabolic complications in obesity: adipose tissue and free fatty acid trafficking. Curr Opin Clin Nutr Metab Care. 2011;14:535–541. doi: 10.1097/MCO.0b013e32834ad8b6. [DOI] [PMC free article] [PubMed] [Google Scholar]
- 6.Wadden D, Cahill F, Amini P, Randell E, Vasdev S, Yi Y, et al. Serum acylated ghrelin concentrations in response to short-term overfeeding in normal weight, overweight, and obese men. PLoS One. 2012;7:e45748. doi: 10.1371/journal.pone.0045748. [DOI] [PMC free article] [PubMed] [Google Scholar]
- 7.Lagerpusch M, Bosy-Westphal A, Kehden B, Peters A, Muller MJ. Effects of brief perturbations in energy balance on indices of glucose homeostasis in healthy lean men. Int J Obes (Lond) 2012;36:1094–1101. doi: 10.1038/ijo.2011.211. [DOI] [PubMed] [Google Scholar]
- 8.Samocha-Bonet D, Campbell LV, Mori TA, Croft KD, Greenfield JR, Turner N, et al. Overfeeding reduces insulin sensitivity and increases oxidative stress, without altering markers of mitochondrial content and function in humans. PLoS One. 2012;7:e36320. doi: 10.1371/journal.pone.0036320. [DOI] [PMC free article] [PubMed] [Google Scholar]
- 9.Olefsky J, Crapo PA, Ginsberg H, Reaven GM. Metabolic effects of increased caloric intake in man. Metabolism. 1975;24:495–503. doi: 10.1016/0026-0495(75)90074-8. [DOI] [PubMed] [Google Scholar]
- 10.Clore JN, Helm ST, Blackard WG. Loss of hepatic autoregulation after carbohydrate overfeeding in normal man. J Clin Invest. 1995;96:1967–1972. doi: 10.1172/JCI118243. [DOI] [PMC free article] [PubMed] [Google Scholar]
- 11.Adochio RL, Leitner JW, Gray K, Draznin B, Cornier MA. Early responses of insulin signaling to high-carbohydrate and high-fat overfeeding. Nutr Metab (Lond) 2009;6:37. doi: 10.1186/1743-7075-6-37. [DOI] [PMC free article] [PubMed] [Google Scholar]
- 12.Minehira K, Vega N, Vidal H, Acheson K, Tappy L. Effect of carbohydrate overfeeding on whole body macronutrient metabolism and expression of lipogenic enzymes in adipose tissue of lean and overweight humans. Int J Obes Relat Metab Disord. 2004;28:1291–1298. doi: 10.1038/sj.ijo.0802760. [DOI] [PubMed] [Google Scholar]
- 13.Brons C, Jensen CB, Storgaard H, Hiscock NJ, White A, Appel JS, et al. Impact of short-term high-fat feeding on glucose and insulin metabolism in young healthy men. J Physiol. 2009;587:2387–2397. doi: 10.1113/jphysiol.2009.169078. [DOI] [PMC free article] [PubMed] [Google Scholar]
- 14.Tam CS, Viardot A, Clement K, Tordjman J, Tonks K, Greenfield JR, et al. Short-term overfeeding may induce peripheral insulin resistance without altering subcutaneous adipose tissue macrophages in humans. Diabetes. 2010;59:2164–2170. doi: 10.2337/db10-0162. [DOI] [PMC free article] [PubMed] [Google Scholar]
- 15.Ngo Sock ET, Le KA, Ith M, Kreis R, Boesch C, Tappy L. Effects of a short-term overfeeding with fructose or glucose in healthy young males. Br J Nutr. 2010;103:939–943. doi: 10.1017/S0007114509992819. [DOI] [PubMed] [Google Scholar]
- 16.Kim SP, Catalano KJ, Hsu IR, Chiu JD, Richey JM, Bergman RN. Nocturnal free fatty acids are uniquely elevated in the longitudinal development of diet-induced insulin resistance and hyperinsulinemia. Am J Physiol Endocrinol Metab. 2007;292:E1590–1598. doi: 10.1152/ajpendo.00669.2006. [DOI] [PubMed] [Google Scholar]
- 17.Axelsen M, Lonnroth P, Arvidsson Lenner R, Smith U. Suppression of the nocturnal free fatty acid levels by bedtime cornstarch in NIDDM subjects. Eur J Clin Invest. 1997;27:157–163. doi: 10.1046/j.1365-2362.1997.880639.x. [DOI] [PubMed] [Google Scholar]
- 18.Axelsen M, Lonnroth P, Lenner RA, Taskinen MR, Smith U. Suppression of nocturnal fatty acid concentrations by bedtime carbohydrate supplement in type 2 diabetes: effects on insulin sensitivity, lipids, and glycemic control. Am J Clin Nutr. 2000;71:1108–1114. doi: 10.1093/ajcn/71.5.1108. [DOI] [PubMed] [Google Scholar]
- 19.U.S. Department of Health and Human Services. Physical Activity Guidelines for Americans. Washington, DC: USDHHS; 2008. [Google Scholar]
- 20.Garber CE, Blissmer B, Deschenes MR, Franklin BA, Lamonte MJ, Lee IM, et al. American College of Sports Medicine position stand. Quantity and quality of exercise for developing and maintaining cardiorespiratory, musculoskeletal, and neuromotor fitness in apparently healthy adults: guidance for prescribing exercise. Med Sci Sports Exerc. 2011;43:1334–1359. doi: 10.1249/MSS.0b013e318213fefb. [DOI] [PubMed] [Google Scholar]
- 21.James WPT, Schofield EC. Human Energy Requirements. A Manual for Planners and Nutritionists. Oxford University Press/The Food and Agriculture Organization of the United Nations; Oxford, UK: 1990. [Google Scholar]
- 22.Ainsworth BE, Haskell WL, Herrmann SD, Meckes N, Bassett DR, Jr, Tudor-Locke C, et al. 2011 Compendium of Physical Activities: a second update of codes and MET values. Med Sci Sports Exerc. 2011;43:1575–1581. doi: 10.1249/MSS.0b013e31821ece12. [DOI] [PubMed] [Google Scholar]
- 23.Schneeman BO, Kotite L, Todd KM, Havel RJ. Relationships between the responses of triglyceride-rich lipoproteins in blood plasma containing apolipoproteins B-48 and B-100 to a fat-containing meal in normolipidemic humans. Proc Natl Acad Sci U S A. 1993;90:2069–2073. doi: 10.1073/pnas.90.5.2069. [DOI] [PMC free article] [PubMed] [Google Scholar]
- 24.Matthews DR, Hosker JP, Rudenski AS, Naylor BA, Treacher DF, Turner RC. Homeostasis model assessment: insulin resistance and beta-cell function from fasting plasma glucose and insulin concentrations in man. Diabetologia. 1985;28:412–419. doi: 10.1007/BF00280883. [DOI] [PubMed] [Google Scholar]
- 25.Karpe F, Dickmann JR, Frayn KN. Fatty acids, obesity, and insulin resistance: time for a reevaluation. Diabetes. 2011;60:2441–2449. doi: 10.2337/db11-0425. [DOI] [PMC free article] [PubMed] [Google Scholar]
- 26.Brands M, Swat M, Lammers NM, Sauerwein HP, Endert E, Ackermans MT, et al. Effects of a hypercaloric diet on beta-cell responsivity in lean healthy men. Clin Endocrinol (Oxf) 2013;78:217–225. doi: 10.1111/j.1365-2265.2012.04364.x. [DOI] [PubMed] [Google Scholar]
- 27.Erdmann J, Kallabis B, Oppel U, Sypchenko O, Wagenpfeil S, Schusdziarra V. Development of hyperinsulinemia and insulin resistance during the early stage of weight gain. Am J Physiol Endocrinol Metab. 2008;294:E568–575. doi: 10.1152/ajpendo.00560.2007. [DOI] [PubMed] [Google Scholar]
- 28.Tripathy D, Almgren P, Tuomi T, Groop L. Contribution of insulin-stimulated glucose uptake and basal hepatic insulin sensitivity to surrogate measures of insulin sensitivity. Diabetes Care. 2004;27:2204–2210. doi: 10.2337/diacare.27.9.2204. [DOI] [PubMed] [Google Scholar]
- 29.Saad A, Dalla Man C, Nandy DK, Levine JA, Bharucha AE, Rizza RA, et al. Diurnal pattern to insulin secretion and insulin action in healthy individuals. Diabetes. 2012;61:2691–2700. doi: 10.2337/db11-1478. [DOI] [PMC free article] [PubMed] [Google Scholar]
- 30.Bradley D, Conte C, Mittendorfer B, Eagon JC, Varela JE, Fabbrini E, et al. Gastric bypass and banding equally improve insulin sensitivity and beta cell function. J Clin Invest. 2012;122:4667–4674. doi: 10.1172/JCI64895. [DOI] [PMC free article] [PubMed] [Google Scholar]
- 31.Kirk E, Reeds DN, Finck BN, Mayurranjan SM, Patterson BW, Klein S. Dietary fat and carbohydrates differentially alter insulin sensitivity during caloric restriction. Gastroenterology. 2009;136:1552–1560. doi: 10.1053/j.gastro.2009.01.048. [DOI] [PMC free article] [PubMed] [Google Scholar]
- 32.Boden G. Obesity and free fatty acids. Endocrinol Metab Clin North Am. 2008;37:635–646. viii–ix. doi: 10.1016/j.ecl.2008.06.007. [DOI] [PMC free article] [PubMed] [Google Scholar]
- 33.Boden G. Ceramide: a contributor to insulin resistance or an innocent bystander? Diabetologia. 2008;51:1095–1096. doi: 10.1007/s00125-008-1015-y. [DOI] [PubMed] [Google Scholar]
- 34.Holland WL, Brozinick JT, Wang LP, Hawkins ED, Sargent KM, Liu Y, et al. Inhibition of ceramide synthesis ameliorates glucocorticoid-, saturated-fat-, and obesity-induced insulin resistance. Cell Metab. 2007;5:167–179. doi: 10.1016/j.cmet.2007.01.002. [DOI] [PubMed] [Google Scholar]
- 35.Itani SI, Ruderman NB, Schmieder F, Boden G. Lipid-induced insulin resistance in human muscle is associated with changes in diacylglycerol, protein kinase C, and IkappaB-alpha. Diabetes. 2002;51:2005–2011. doi: 10.2337/diabetes.51.7.2005. [DOI] [PubMed] [Google Scholar]
- 36.Petersen KF, Shulman GI. Pathogenesis of skeletal muscle insulin resistance in type 2 diabetes mellitus. Am J Cardiol. 2002;90:11G–18G. doi: 10.1016/s0002-9149(02)02554-7. [DOI] [PubMed] [Google Scholar]
- 37.Scherer T, Lindtner C, Zielinski E, O’Hare J, Filatova N, Buettner C. Short term voluntary overfeeding disrupts brain insulin control of adipose tissue lipolysis. J Biol Chem. 2012;287:33061–33069. doi: 10.1074/jbc.M111.307348. [DOI] [PMC free article] [PubMed] [Google Scholar]
- 38.Andreotti AC, Lanzi R, Manzoni MF, Caumo A, Moreschi A, Pontiroli AE. Acute pharmacologic blockade of lipolysis normalizes nocturnal growth hormone levels and pulsatility in obese subjects. Metabolism. 1994;43:1207–1213. doi: 10.1016/0026-0495(94)90212-7. [DOI] [PubMed] [Google Scholar]
- 39.Heptulla R, Smitten A, Teague B, Tamborlane WV, Ma YZ, Caprio S. Temporal patterns of circulating leptin levels in lean and obese adolescents: relationships to insulin, growth hormone, and free fatty acids rhythmicity. J Clin Endocrinol Metab. 2001;86:90–96. doi: 10.1210/jcem.86.1.7136. [DOI] [PubMed] [Google Scholar]
- 40.Miles JM, Wooldridge D, Grellner WJ, Windsor S, Isley WL, Klein S, et al. Nocturnal and postprandial free fatty acid kinetics in normal and type 2 diabetic subjects: effects of insulin sensitization therapy. Diabetes. 2003;52:675–681. doi: 10.2337/diabetes.52.3.675. [DOI] [PubMed] [Google Scholar]