

Abstract
The hypocretins (Hcrts) (also called orexins) are two neuropeptides expressed in the lateral hypothalamus that play a crucial role in the stability of wakefulness. Previously, our laboratory demonstrated that in vivo photostimulation of Hcrt neurons genetically targeted with ChR2, a light-activated cation channel, was sufficient to increase the probability of an awakening event during both slow-wave sleep and rapid eye movement sleep. In the current study, we ask whether Hcrt-mediated sleep-to-wake transitions are affected by light/dark period and sleep pressure. We found that stimulation of Hcrt neurons increased the probability of an awakening event throughout the entire light/dark period but that this effect was diminished with sleep pressure induced by 2 or 4 h of sleep deprivation. Interestingly, photostimulation of Hcrt neurons was still sufficient to increase activity assessed by c-Fos expression in Hcrt neurons after sleep deprivation, although this stimulation did not cause an increase in transitions to wakefulness. In addition, we found that photostimulation of Hcrt neurons increases neural activity assessed by c-Fos expression in the downstream arousal-promoting locus ceruleus and tuberomammilary nucleus but not after 2 h of sleep deprivation. Finally, stimulation of Hcrt neurons was still sufficient to increase the probability of an awakening event in histidine decarboxylase-deficient knock-out animals. Collectively, these results suggest that the Hcrt system promotes wakefulness throughout the light/dark period by activating multiple downstream targets, which themselves are inhibited with increased sleep pressure.
Introduction
The hypocretins (Hcrts) are two neuropeptides produced from a common genetic precursor and expressed exclusively in the lateral hypothalamus (de Lecea et al., 1998; Sakurai et al., 1998). Hcrts excite their postsynaptic targets by binding to two G-coupled protein receptors, hypocretin receptor-1 and -2 (Hcrt-r1 and Hcrt-r2, respectively) (Sakurai et al., 1998). The expression pattern of these receptors match the afferent projections of Hcrt neurons throughout the brain, with dense expression in arousal-promoting nuclei, including the locus ceruleus (LC), tuberomammillary nucleus (TMN), and dorsal raphe nuclei (DRN) (Peyron et al., 1998; Trivedi et al., 1998; Marcus et al., 2001). The role of Hcrts and Hcrt-expressing neurons in promoting wakefulness is well known (Saper et al., 2005; Sakurai, 2007; Adamantidis and de Lecea, 2008). Loss-of-function perturbation of the Hcrts or their receptors causes a narcolepsy phenotype (Chemelli et al., 1999; Lin et al., 1999; Nishino et al., 2000). When centrally administered, the Hcrts cause an increase in the time spent awake and a decrease in slow-wave sleep (SWS) and rapid eye movement (REM) sleep (Hagan et al., 1999; Ida et al., 1999; Piper et al., 2000; España et al., 2001, 2002). Electrophysiological recordings of Hcrt neurons show that they are relatively silent during sleep compared with wakefulness, with phasic bursts of activity preceding transitions to wakefulness (Lee et al., 2005; Mileykovskiy et al., 2005).
Recently, our laboratory used optogenetic technology to stimulate Hcrt neurons in vivo with high temporal resolution (Adamantidis et al., 2007). Genetic targeting of channelrhodopsin-2 (ChR2), a light-activated cation channel, allows for chronic, millisecond-timescale neuronal activation in precise spatial locations (Boyden et al., 2005; Zhang et al., 2007a). An Hcrt::ChR2– mCherry lentiviral vector or Hcrt::mCherry control vector stably expressed ChR2–mCherry or mCherry in >95% of Hcrt neurons. Optogenetic stimulation of Hcrt neurons at frequencies >5 Hz (but not 1 Hz) was sufficient to increase the probability of an awakening event during SWS and REM sleep (Adamantidis et al., 2007).
In the present study, we ask whether Hcrt-mediated sleep-to-wake transitions are affected by the light/dark period and an increase in sleep pressure. Sleep deprivation increases the propensity of an animal to sleep, increasing total sleep duration and the amplitude of the cortical EEG in SWS (Pace-Schott and Hobson, 2002). Therefore, we tested the hypothesis that sleep deprivation moderates the effect of Hcrt stimulation to promote wakefulness. Sleep deprivation also increases activity in nuclei thought to serve as sleep-promotion centers, such as the ventrolateral preoptic nucleus (VLPO), which send inhibitory projections to Hcrt neurons and other downstream nuclei (Sherin et al., 1996; Saper et al., 2005). Therefore, we also asked whether stimulation of Hcrt neurons was sufficient to induce activity in these downstream nuclei during various conditions of sleep deprivation. Finally, because Hcrt neurons send dense projections to the TMN, the brain's source of the arousal-promoting neuromodulator histamine, we asked whether Hcrt-mediated sleep-to-wake transitions are diminished in animals with genetic ablation of the histaminergic system.
Materials and Methods
Animals.
Male C57BL/6 mice, aged 8–10 weeks at the start of experimental procedures, were housed in individual Plexiglas recording chambers. The temperature (22 ± 1°C), humidity (40–60%), and circadian cycle (12 h light/dark cycle, starting at 9:00 A.M.) were set at a constant rate in custom-designed stainless steel cabinets. Food and water were available ad libitum. All experiments were performed in accordance with the guidelines described in the National Institutes of Health Guide for the Care and Use of Laboratory Animals. All experiments were completed before the mice aged 18 weeks.
Plasmid and virus preparation.
We used an Hcrt::ChR2–mCherry lentiviral vector or Hcrt::mCherry control vector as described previously (Adamantidis et al., 2007). High-titer lentiviruses were produced as described previously (Zhang et al., 2007b).
Surgery.
All animals received unilateral surgical implantation of a 26 gauge cannula (Plastics One) before the start of experimental procedures. Animals were implanted under ketamine/xylazine anesthesia (80 and 16 mg/kg, i.p., respectively) on a small animal stereotaxic frame (David Kopf Instruments). The cannula was placed above the right lateral hypothalamus [anteroposterior (AP), 1.6 mm; mediolateral (ML), 0.8 mm; dorsoventral, 4.5 mm] and affixed to the skull with C&B Metabond (Parkell) and dental acrylic. Immediately after cannula implantation, recombinant Hcrt::ChR2–mCherry or control Hcrt::mCherry lentivirus was injected through the cannula at a rate of 0.1 μl/min for 10 min (1 μl total volume).
Animals used for sleep recordings were also implanted with a custom-made EEG/EMG implant placed on the rear of the skull, posterior to the cannula implantation (Fig. 1A). EEG signals were recorded from electrodes placed on the frontal (AP, −2 mm; ML, ±1 mm) and temporal (AP, 3 mm; ML, 2.5 mm) cortices. EMG signals were recorded from two electrodes inserted in the neck musculature to record postural tone.
Figure 1.

Experimental setup used to stimulate Hcrt neurons in vivo while recording polysomnographic activity. A, A 26 gauge cannula was implanted unilaterally on each mouse just above the lateral hypothalamus. The cannula was used for stereotaxic injection of lentivirus and delivery of 473 nm blue laser light for photostimulation. For sleep recordings, EEG/EMG electrodes were also implanted just posterior to the cannula. The length of the fiber optic cable and EEG/EMG cable allowed the mouse to freely move about its cage. B, Drawing depicting stereotaxic placement of the cannula above the lateral hypothalamus (LH) according to the coordinates used by Paxinos and Franklin (2001). C, Representative colocalization of expression of mCherry (red) and anti-Hcrt antibody (green) from the brain of a ChR2–mCherry transduced mouse. Scale bar, 50 μm.
After surgical procedures, animals were allowed to recover in individual housing (circadian cycle 12 h light/dark, starting at 9:00 A.M.) for at least 10 d. Animals used for sleep recordings were then acclimated to a flexible EEG/EMG connection cable for an additional 7 d within individual recording chambers. Each cable was flexible so that mice could freely move about their cages.
Polysomnographic recording.
Sleep–wake cycle recording was performed as described previously (Adamantidis et al., 2007). In brief, EEG and EMG signals derived from the surgically implanted electrodes were amplified (Grass Instruments) and digitized at 256 Hz using sleep recording software (VitalRecorder; Kissei Comtec America). The signals were digitally filtered and spectrally analyzed by fast Fourier transformation, and polysomnographic recordings were scored using sleep analysis software (SleepSign for Animal; Kissei Comtec America). All scoring was performed manually based on the visual signature of the EEG and EMG waveforms, as well as the power spectra of 5 s epochs.
We defined wakefulness as desynchronized low-amplitude EEG and heightened tonic EMG activity with phasic bursts. We defined SWS as synchronized, high-amplitude, low-frequency (0.25–4 Hz) EEG and highly reduced EMG activity compared with wakefulness with no phasic bursts. We defined REM sleep as having a pronounced theta rhythm (4–9 Hz) and a flat EMG (muscle atonia). We calculated SWS and REM sleep-to-wake transition latencies as the time from the end of the light stimulation (during SWS or REM sleep) to the first event of wakefulness. We discarded awakenings that occurred during photostimulation from the data analysis. When measuring wake latencies during SWS, we discarded data when no awakening event occurred and the animal transitioned into REM sleep.
Photostimulation.
All photostimulation experiments were conducted unilaterally on the right Hcrt field. Fiber optic cables (ThorLabs) were placed inside the implanted cannulas 2 h before experiments or the previous day for experiments starting at 9:00 A.M. (Fig. 1B). The length of the cable followed the same path as the EEG/EMG cable so that the mice could freely move about their cages (Fig. 1A). Light pulse trains (15 ms pulses at 1 or 20 Hz for 10 s) programmed using a waveform generator (33220A Waveform Generator; Agilent Technologies) were delivered using a blue-light laser (473 nm; LaserGlo). Each stimulation epoch was applied 15 s after the occurrence of a stable SWS or REM sleep event as detected by real-time online EEG/EMG analysis. Latencies of photostimulation-induced sleep-to-wake transitions were measured by offline scoring of the EEG/EMG recordings as described above.
For chronic stimulation, we used a Master-8 pulse stimulator (A.M.P.I.) to deliver an automated stimulation protocol (15 ms light pulses at 20 Hz for 10 s every minute during 1 h) to test the consequences of sustained stimulation of the Hcrt system. After the experiment, sleep–wake cycle parameters (wake, SWS, REM sleep duration, and the number of sleep–wake transitions) were quantified by offline scoring of the entire hour of stimulation and the corresponding baseline for each animal.
For photostimulation followed by c-Fos experiments, we used an automated stimulation protocol (15 ms light pulses at 20 Hz for 10 s every minute during 1 h) and then immediately perfused the animal.
Photostimulation of Hcrt neurons across the light/dark cycle.
Mice were individually housed and acclimated to a fixed circadian time (12 h light/dark starting at 9:00 A.M.; inactive period lasting from 9:00 A.M. to 9:00 P.M.). To compare different times across a 24 h cycle, we divided the light/dark period into 4 h time intervals, with three intervals in the inactive period (9:00 A.M. to 1:00 P.M., 1:00 P.M. to 5:00 P.M., and 5:00 P.M. to 9:00 P.M.) and three intervals in the active period (9:00 P.M. to 1:00 A.M., 1:00 A.M. to 5:00 A.M., and 5:00 A.M. to 9:00 A.M.). For each experimental session, two to three individual mice were stimulated during each time interval. These two to three mice would not be subjected to stimulation or sleep recordings again for at least 2 d so that the effect of stimulation from one time interval would not confound results during another time interval. Data used in this experiment represent the same group of mice throughout the entire experiment: if an individual animal became unusable before the completion of the experiment, data from the mouse would be discarded so that another individual could be used throughout the entire light/dark period.
Sleep deprivation.
We sleep deprived animals for either 2 or 4 h using gentle handling procedures. If an animal remained motionless for a few seconds, we gently agitated the animal with a soft brush. Occasionally, we noticed an animal entering SWS during online EEG/EMG analysis, but these periods lasted <1–3 s before we agitated the animal with the brush. This method of sleep deprivation has been shown previously not to increase plasma corticosterone or adrenocorticotropic hormone levels, demonstrating that this procedure does not increase stress in mice (Palchykova et al., 2006).
Immunohistochemistry.
After completion of the experiments, mice were anesthetized with ketamine/xylazine anesthesia (80 and 16 mg/kg, i.p., respectively) and perfused transcardially with 1× PBS, pH 7.4, followed by 4% paraformaldehyde in PBS. The brains were extracted, allowed to postfix overnight in the same fixative at 4°C, and cryoprotected in 30% sucrose dissolved in PBS for an additional 24 h at 4°C. Each brain was sectioned at 30 μm on a cryostat (Leica Microsystems) and collected in cold PBS.
Sections were washed in PBS with 0.3% Triton X-100 (PBST) and incubated in a 3% hydrogen peroxide solution for 30 min. After a brief wash in PBST, sections were incubated in a blocking solution composed of PBST with 4% bovine serum albumin and 2% normal horse serum. Sections were incubated in rabbit anti c-Fos (1:5000; PC05; Calbiochem) overnight at 4°C in block solution. At 12 h later, the sections were washed three times in PBST and incubated in biotinylated IgG secondary antibody (1:500; Vector Laboratories) for 1 h at room temperature. Next, the sections were washed three times in PBST and incubated in an avidin–biotin ABC peroxidase solution (PK-6100; Vector Laboratories). Finally, the sections were washed three times in PBS and stained using 3-3′diaminobenzidine-4 HCl (DAB) and nickel solution (SK-4100; Vector Laboratories).
After this initial round of staining for the presence of c-Fos, sections were submitted to a second round of staining for cell-type-specific markers. After a brief wash in PBST, sections were incubated overnight at 4°C in an additional primary antibody for either anti-orexin (Hcrt) (1:5000; sc-8070; Santa Cruz Biotechnology), anti-tryptophan hydroxylase (TrH) (1:1000; ab3907; Abcam), anti-tyrosine hydroxylase (TH) (1:2500; catalog #TH; Aves Labs), or a mixture of anti-adenosine deaminase (ADA) (1:500; sc-7450 and sc-7451; Santa Cruz Biotechnology) antibodies. Adenosine deaminase is a marker of histaminergic neurons (Senba et al., 1985). These antibodies have been used in previous studies and labeled neurons in a manner consistent with well known gene/protein expression patterns (Senba et al., 1985; Abumaria et al., 2007; Adamantidis et al., 2007; Kohlmeier et al., 2008). At 16 h later, the sections were processed according to the same protocol above, but instead of using DAB with nickel solution for the final staining step, we used DAB alone (Vector Laboratories) to create a brown staining product. The differentiation between black staining products revealed by DAB with nickel solution and brown staining products revealed by DAB alone has been effectively used in other studies colabeling c-Fos with Hcrt, TrH, TH, or ADA (Winsky-Sommerer et al., 2004; Harris et al., 2005; Deurveilher et al., 2006; Adamantidis et al., 2007). In control experiments, we were able to differentiate brown cytoplasmic staining from black nuclear staining (supplemental Fig. 1, available at www.jneurosci.org as supplemental material).
For non-c-Fos behavioral experiments, mice were killed and examined for the colabeling of mCherry fluorescence with immunostaining for Hcrt (Fig. 1C). Data from animals in which no mCherry fluorescence was detected were discarded.
Processed sections were mounted onto slides in PBS and coverslipped with Permaslip (Alban Scientific). Slides were examined using a fluorescent microscope (Carl Zeiss), and digital images were minimally processed using Adobe Photoshop CS3 (Adobe Systems) to enhance brightness and contrast for optimal representation of the data. All digital images were processed in the same way to avoid artificial manipulation between different datasets. We used five complete sets of alternating sections (∼30 μm apart) to analyze cells double labeled for c-Fos and other cell-specific markers. We analyzed sections from the extreme rostral and caudal ends of specific nuclei to avoid any rostrocaudal bias in the analysis [dorsal raphe nucleus: bregma −4.16 to −5.34, 18 sections; lateral hypothalamus: bregma −1.06 to −2.14, 18 sections; locus ceruleus: bregma −5.34 to −5.8, 8 sections; tuberomammillary nucleus: bregma −1.82 to −2.46, 10 sections (Paxinos and Franklin, 2001)]. Cells positive for cell-specific markers were scored for the presence of c-Fos by an investigator blind to the stimulation condition.
Statistical methods.
All statistics were analyzed using Prism 5.0 (GraphPad Software). Latencies of sleep-to-wake transitions and c-Fos expression data were analyzed using the Student's t test. Probability distributions were analyzed using the Kolmogorov–Smirnov (KS) test. Long-term stimulation experiments were analyzed using two-way ANOVA.
Results
Photostimulation of Hcrt neurons across the light/dark period
To test whether the efficacy of Hcrt-mediated sleep-to-wake transitions were mediated by the light/dark period, we unilaterally stimulated Hcrt neurons at various time points throughout the 12 h light/dark cycle. We first quantitatively measured the latency of sleep-to-wake transitions from SWS or REM sleep after single optical light pulse trains in Hcrt::ChR2–mCherry (n = 6) or Hcrt::mCherry (n = 6) transduced animals during different time points in the inactive period. Our previous studies demonstrated that stimulation frequencies from 5 to 30 Hz, but not 1 Hz, were sufficient to increase the number of transitions to wakefulness (Adamantidis et al., 2007). Because previous studies indicated that 20 Hz firing frequency was similar to endogenous bursts of action potentials in Hcrt neurons (Lee et al., 2005; Mileykovskiy et al., 2005), we stimulated mice at either 1 or 20 Hz using a stimulation protocol of 15 ms light pulses for 10 s starting 15 s after the onset of either SWS or REM sleep. We found that optical stimulation of Hcrt neurons at 20 Hz, but not 1 Hz, significantly reduced the latency to wakefulness from SWS and REM sleep in Hcrt::ChR2–mCherry animals compared with Hcrt::mCherry control animals (20 Hz, p < 0.0001; 1 Hz, p > 0.05 for all comparisons with control) (Fig. 2A,B). These effects were consistent across animals, because pooled wake latency values from either SWS or REM sleep revealed significant differences between experimental and control animals (supplemental Fig. 2, available at www.jneurosci.org as supplemental material). We did not observe any difference in the ability of photostimulation at 20 Hz to decrease the latency of wakefulness between animals at different time intervals for either SWS or REM sleep (p > 0.05, two-way ANOVA).
Figure 2.

Stimulation of Hcrt neurons is sufficient to increase sleep-to-wake transitions across the inactive period. A, B, Latencies of wake transitions after stimulation during SWS (A) or REM sleep (B) of Hcrt::ChR2–mCherry transduced animals (n = 6) or Hcrt::mCherry control animals (n = 6). Photostimulation consisted of 15 ms light pulses at either 1 or 20 Hz for 10 s. Photostimulation periods took place at 9:00 A.M. to 1:00 P.M., 1:00 P.M. to 5:00 P.M., or 5:00 P.M. to 9:00 P.M., with the 12 h light inactive period starting at 9:00 A.M. Data analysis is based on an average of 30 or 10 stimulations per frequency and per mouse during SWS and REM sleep, respectively. Latencies represent mean ± SEM. Two-way ANOVA between stimulation parameter and time of day revealed no significant difference between latencies in Hcrt::ChR2–mCherry animals across the inactive period (p > 0.05). However, we found significant differences in the latencies between ChR2–mCherry and mCherry control animals at 20 Hz stimulation at all times tested (*p < 0.05, ***p < 0001 using a two-tailed Student's t test). C, D, Cumulative probability distribution of latencies from SWS (C) or REM sleep (D) after light stimulation (ChR2–mCherry animals, blue curves; mCherry control animals, red curves). The 20 Hz stimulation resulted in a significant shift in the probability curve for both SWS (p < 0.001, KS test) and REM (p < 0.001, KS test). E, Chronic stimulation of Hcrt neurons is sufficient to increase transitions from SWS to wakefulness across the circadian period. We used a chronic stimulation protocol (15 ms light pulses for 10 s every minute for 1 h, 20 Hz stimulation) to stimulate Hcrt::ChR2–mCherry mice (n = 4) or Hcrt::mCherry control mice (n = 4) at 4 h intervals throughout the entire circadian period. y-Axis represents the mean ± SEM number of transitions from SWS to wakefulness divided by the baseline number of transitions during that time interval. Analysis is based on duplicated stimulation sessions for each animal. *p < 0.05 using a two-tailed Student's t test between transduced animals. F, Chronic stimulation of Hcrt neurons is insufficient to increase transitions from REM to wakefulness throughout the circadian period. Same experimental conditions as E.
The effects of Hcrt-mediated sleep-to-wake transitions were not fixed. Instead, stimulation shifted the distribution of sleep-to-wake latencies to lower values (supplemental Fig. 3, available at www.jneurosci.org as supplemental material). The 20 Hz stimulation in ChR2–mCherry animals caused a greater number of awakenings 1–30 s after stimulation compared with spontaneous transitions in ChR2–mCherry and mCherry transduced animals (1–120 s). This had the consequential effect of increasing the probability of an awakening event from either SWS or REM sleep after a single light pulse train at 20 Hz, but not at 1 Hz, in ChR2–mCherry animals compared with mCherry control animals (p < 0.001, KS test) (Fig. 2C,D).
To test whether long-term stimulation of Hcrt neurons increased the number of sleep–wake transitions throughout the entire light/dark period, we studied the effects of chronic stimulation (15 ms pulses at 20 Hz for 10 s every minute for 1 h) of Hcrt neurons for all time intervals throughout the 12 h light/dark cycle. This stimulation paradigm increased the number of SWS sleep-to-wake transitions in Hcrt::ChR2–mCherry animals compared with control animals (p < 0.05, two-way ANOVA between transduction and stimulation paradigm, followed by Student's t test) but not total wake, SWS, and REM amounts (p > 0.05, two-way ANOVA) (supplemental Fig. 4, available at www.jneurosci.org as supplemental material). To compare increases in transitions among different time intervals, we compared the number of sleep-to-wake transitions and divided this value by the baseline number of transitions (Fig. 2E). We found a significant difference between the number of SWS-to-wake transitions in Hcrt::ChR2–mCherry transduced animals between baseline conditions (p < 0.05, Student's t test) but not in control animals (p > 0.05, Student's t test). There were no significant differences between the number of REM-to-wake transitions in either experimental group, probably because not enough REM events occurred during the sampling conditions (Fig. 2F). Together, these data suggest that stimulation of Hcrt neurons is sufficient to increase the transitions to wakefulness and probability of an awakening event over the entire light/dark period.
Photostimulation of Hcrt neurons in conditions of sleep pressure
We next examined whether the sufficiency of optical stimulation of Hcrt neurons to increase the probability of an awakening event was under the control of sleep homeostatic signals. Sleep pressure was experimentally induced by 2 or 4 h sleep deprivation caused by gentle handling (Palchykova et al., 2006). To avoid potential conflicts between the number of hours of sleep deprivation and the time of day, we performed these experiments under two conditions. In the first condition, we sleep deprived mice for either 2 or 4 h starting at the beginning of the active period (9:00 A.M.) and then stimulated Hcrt neurons for the subsequent 2 h (11:00 A.M. or 1:00 P.M.). In the second condition, we sleep deprived mice starting at 11:00 A.M. (for 4 h sleep deprivation) or 1:00 P.M. (for 2 h sleep deprivation) and then stimulated Hcrt neurons for the subsequent 2 h starting at 3:00 P.M. Therefore, we could avoid any potential differences between differing lengths of sleep deprivation and different circadian times of photostimulation.
We first ensured that 2 or 4 h sleep deprivation was sufficient to increase the drive to sleep in each virally transduced animal by examining the sleep architecture of mice in baseline conditions (without stimulation) in the 2 h of sleep rebound immediately after sleep deprivation. We found a significant decrease of the duration of time spent awake concomitant with a significant increase of the total duration of SWS and REM sleep (p < 0.05, Student's t test between 2/4 and 0 h sleep deprivation) in both ChR2–mCherry (n = 6) and mCherry (n = 6) animals (supplemental Fig. 5A, available at www.jneurosci.org as supplemental material). We also examined the power spectrum of the cortical EEG after 2 h sleep deprivation, because delta rhythm EEG (0.25–4 Hz) is thought to reflect SWS need and its underlying homeostatically regulated recovery process (Franken et al., 2001). We found a marked increase in the delta rhythm EEG over the 2 h immediately after sleep deprivation with high-amplitude, low-frequency waveforms (p < 0.0001) (supplemental Fig. 5B, available at www.jneurosci.org as supplemental material).
Next, we measured the latency of SWS-to-wake transitions after 1 or 20 Hz light pulse trains (15 ms light pulses for 10 s starting 15 s after SWS onset) in Hcrt::ChR2–mCherry or Hcrt::mCherry transduced animals after 0, 2, or 4 h sleep deprivation (n = 6 for each condition). We restricted our analysis to SWS events because REM sleep events were relatively rare during this period. Stimulation at 20 Hz significantly reduced the latency to wakefulness of Hcrt::ChR2– mCherry animals compared with control animals after 0 h sleep deprivation (p < 0.001 for all comparisons with control) at both 9:00 A.M. (Fig. 3A) and 3:00 P.M. (Fig. 3B). After 2 h of sleep deprivation starting at 9:00 A.M. (light onset), the significant difference between ChR2–mCherry and mCherry animals decreased to p < 0.05. There was no significant difference between animals sleep deprived for 2 h starting at 1:00 P.M. Finally, there was no significant difference between transduced animals stimulated at 20 Hz after 4 h sleep deprivation (p > 0.05) (Fig. 3A,B). Mean sleep-to-wake latencies for ChR2–mCherry animals sleep deprived starting at 9:00 A.M. were 38.3 ± 6.9, 43.6 ± 4.2, and 62.3 ± 8.2 s after 0, 2, or 4 h sleep deprivation, respectively. Mean sleep-to-wake latencies for mCherry animals sleep deprived before 3:00 P.M. were 35.4 ± 5.8, 52.7 ± 5.3, and 63.4 ± 7.6 s after 0, 2, or 4 h sleep deprivation, respectively. Light pulses at 1 Hz did not result in a significant decrease in the latency to wakefulness in any of the conditions (p > 0.05) (Fig. 3A,B).
Figure 3.

Sleep deprivation (2 or 4 h) moderates Hcrt-mediated sleep-to-wake transitions. A, B, We recorded the latencies of SWS-to-wake transitions in Hcrt::ChR2–mCherry transduced animals (n = 6) or Hcrt::mCherry control animals (n = 6) that were sleep deprived starting at the beginning of the inactive period (A) or in the afternoon (B). Photostimulation consisted of 15 ms light pulses at either 1 or 20 Hz for 10 s. Data analysis is based on an average of 30 stimulations per mouse during both conditions of sleep deprivation. Latencies represent mean ± SEM. We found a significant decrease in the latencies to wakening for both sleep deprivation conditions at 20 Hz between ChR2–mCherry and mCherry control animals that received no sleep deprivation (**p < 0.001, two-tailed Student's t test). After 2 h of sleep deprivation in the morning, the significant difference between ChR2–mCherry and mCherry animals decreased to p < 0.05, and there was no significant difference between animals sleep deprived in the afternoon. Four hours of sleep deprivation resulted in latencies that were not significantly different between animals (*p > 0.05, two-tailed Student's t test). C, D, Cumulative probability distribution of latencies from SWS after light stimulation in animals sleep deprived at the beginning of the inactive period (C) or in the afternoon (D) (ChR2–mCherry animals, blue curves; mCherry control animals, red curves). Probability curves from ChR2–mCherry animals that received no sleep deprivation were statistically different from the other distributions, including ChR2–mCherry animals after 2 h sleep deprivation (p < 0.001 for animals sleep deprived in the morning and afternoon, KS test). E, F, Correlograms comparing slow-wave EEG activity with the mean probability of wakefulness for each individual in animals sleep deprived at the beginning of the inactive period (E) or afternoon (F). Each dot represents one individual during one experimental session (n = 6 individuals × 3 sessions each) after 0, 2, and 4 h sleep deprivation (ChR2–mCherry animals, blue curves; mCherry control animals, red curves). Slow-wave activity is calculated as the percentage of delta power (0.5–4.0 Hz) in the entire power spectrum of EEG activity. The mean probability of wakefulness is the SWS-to-wake latency value occurring at a probabilistic value of 0.5. Linear regression analysis demonstrates a positive correlation (p < 0.0001) between the latency-to-wakening and SWS sleep power in ChR2–mCherry animals.
Similar to our previous experiments, the distribution of latencies to awakening after 0 h sleep deprivation were not fixed but instead shifted to lower values, revealing a significant increase in the probability of SWS-to-wake transitions (p < 0.001, KS test) (Fig. 3C,D). Interestingly, 2 or 4 h sleep deprivation blocked this distribution shift.
Importantly, the ability of stimulation of Hcrt neurons to increase the probability of an awakening event inversely correlated with the intensity of slow-wave activity during SWS (Fig. 3E,F). We found that Hcrt::ChR2–mCherry transduced animals with a relatively higher percentage of the delta rhythm EEG (0.25–4 Hz) in the power spectrum had a lower probability of a SWS-to-wake transition (r = 0.43, p < 0.0001 at light onset; r = 0.67, p < 0.0001 at 3:00 P.M., linear regression analysis) in the 2 h immediately after sleep deprivation. We did not find a significant correlation between slow-wave activity and the probability of SWS-to-wake transitions in Hcrt::mCherry control animals or animals stimulated at 1 Hz (p < 0.05, linear regression), because these animals had a statistically consistent mean SWS-to-wake probability no matter the percentage of delta rhythm EEG. However, although insignificant, there is a clear trend of increasing sleep-to-wake latency with increasing SWS sleep power. This trend reflects the increase in SWS duration after 2 or 4 h sleep deprivation.
Together, these results demonstrate that increased sleep pressure caused by sleep deprivation moderates Hcrt-mediated sleep-to-wake transitions.
Effect of photostimulation of Hcrt neurons on neural activity assessed by c-Fos expression
We wondered whether 2 or 4 h sleep deprivation blocked the effects of Hcrt-mediated sleep-to-wake transitions because photostimulation was insufficient to increase activity in those neurons. To answer this question, we sleep deprived Hcrt::ChR2–mCherry or control mice for either 0 or 2 h (n = 5 for each condition) and then applied the same chronic stimulation paradigm used previously (15 ms light pulses for 10 s each minute for 1 h, 20 Hz). After 1 h of chronic stimulation, the animals were immediately perfused. To examine neural activity in Hcrt neurons, we studied the expression of the immediate early gene c-Fos, a biomarker of active neurons. After immunohistochemical processing, we quantified the number of neurons positive for both Hcrt and c-Fos expression (Fig. 4) (supplemental Table 1, available at www.jneurosci.org as supplemental material). We found that stimulation of Hcrt neurons caused an increase in c-Fos expression in Hcrt neurons in Hcrt::ChR2–mCherry animals compared with control animals, after both 0 and 2 h sleep deprivation (p < 0.001, Student's t test between transduced animals). There was no significant difference in the percentage of Hcrt neurons that expressed c-Fos between Hcrt::ChR2–mCherry animals after 0 or 2 h sleep deprivation (p > 0.05, Student's t test between conditions of sleep deprivation).
Figure 4.

Stimulation of Hcrt neurons causes an increase in c-Fos expression in Hcrt neurons, with and without 2 h of sleep deprivation. We quantified the number of neurons expressing the immediate early gene c-Fos in Hcrt::mCherry animals (A, C) or Hcrt::ChR2–mCherry animals (B, D) after 0 (A, B) or 2 h (C, D) sleep deprivation (n = 6 for each condition). A–D, Representative images from neurons double stained for c-Fos (black) and Hcrt (light brown). Arrows indicate Hcrt-positive neurons coexpressing c-Fos. E, Quantification of data in A–D, depicting the percentage of Hcrt-positive neurons positive for c-Fos. **p < 0.001, two-tailed Student's t test. Scale bar, 50 μm.
Because photostimulation at 20 Hz following 2 h sleep deprivation was sufficient to increase c-Fos expression in Hcrt neurons but insufficient to decrease the sleep-to-wake latency, we decided to explore activity in downstream targets of Hcrt projections. We focused on the noradrenergic LC, the histaminergic TMN, and the serotoninergic DRN because these brain regions promote arousal, receive dense projections from Hcrt neurons, and are thought to mediate the effects of Hcrt on arousal (Aston-Jones and Bloom, 1981; Jacobs and Azmitia, 1992; Peyron et al., 1998; Bourgin et al., 2000; John et al., 2004; Saper et al., 2005). We studied the effect of optical stimulation of Hcrt neurons using a chronic stimulation paradigm (15 ms light pulses for 10 s each minute for 1 h, 20 Hz) in Hcrt::ChR2–mCherry or Hcrt::mCherry animals after 0 or 2 h sleep deprivation (n = 6 for each condition). After stimulation, animals were immediately perfused, brains were extracted, and histology was performed to examine expression of c-Fos. We performed double-labeling experiments with antibodies to TH, ADA, or TrH to label cells in the LC, TMN, and DRN, respectively (Fig. 5). We quantified the percentage of cells labeled by each antibody that also showed expression of c-Fos (supplemental Table 1, available at www.jneurosci.org as supplemental material). Stimulation of Hcrt::ChR2–mCherry animals significantly increased the percentage of c-Fos-expressing cells in the LC and TMN compared with Hcrt::mCherry control animals (Fig. 5E,J) (p < 0.001 and p < 0.05, respectively, Student's t test) but not the number of c-Fos cells in the DRN (Fig. 5O) (p > 0.05, Student's t test). There was no increase in c-Fos expression in animals that received stimulation after 2 h sleep deprivation (Fig. 5E,J,O) (p > 0.05, Student's t test). These data suggest that stimulation of Hcrt neurons is sufficient to increase activity in the LC and TMN but that this stimulation is insufficient to overcome endogenous inhibition of these neurons during high sleep pressure conditions.
Figure 5.
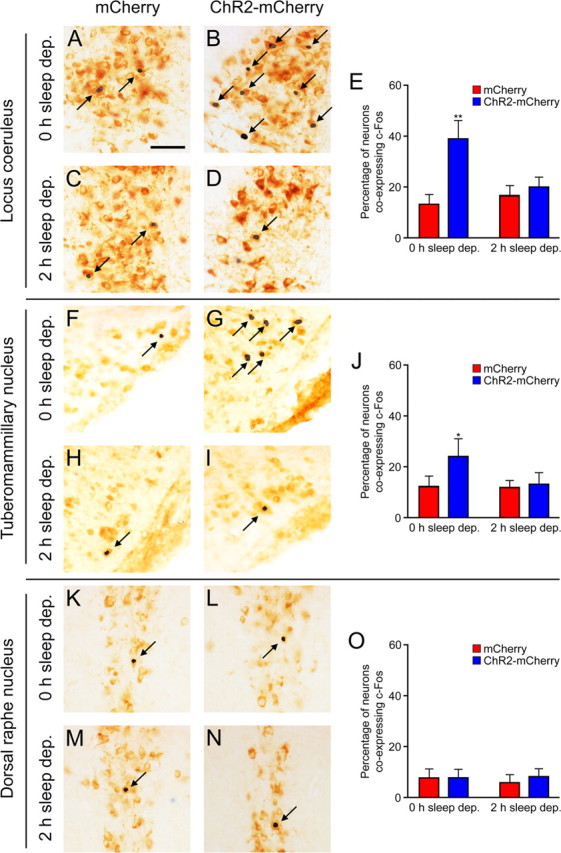
Effect of stimulation of Hcrt neurons on c-Fos expression in downstream nuclei, with and without 2 h of sleep deprivation. We quantified the number of neurons expressing the immediate early gene c-Fos in Hcrt::mCherry animals (A, C, F, H, K, M) or Hcrt::ChR2–mCherry animals (B, D, G, I, L, N) after 0 h (A, B, F, G, K, L) or 2 h (C, D, H, I, M, N) sleep deprivation (n = 6 for each condition). A–D, Representative images taken from the locus ceruleus, with neurons double stained for c-Fos (black) and TH (light brown). F–I, Representative images taken from the tuberomammilary nucleus, with neurons double stained for c-Fos (black) and ADA (light brown). K–N, Representative images taken from the dorsal raphe nuclei, with neurons double stained for c-Fos (black) and TrH (light brown). Arrows indicate neurons stained for either TH, ADA, or TrH that also express c-Fos. E, J, O, Quantification of data in A–D, F–I, and K–N, respectively, depicting the percentage of neurons stained for either TH, ADA, or TrH also positive for c-Fos. *p < 0.05, **p < 0.001, two-tailed Student's t test. Scale bar, 50 μm.
Photostimulation of Hcrt neurons in histidine decarboxylase knock-out mice
Because stimulation of Hcrt neurons increased activity in the TMN, the brain's source of the neuromodulator histamine (Haas et al., 2008), we asked whether Hcrt-mediated sleep-to-wake transitions would be diminished in animals in which the histaminergic system was genetically ablated. Therefore, we repeated stimulation experiments in mice lacking the gene encoding histidine decarboxylase (HDC), the enzyme that produces histamine [HDC knock-out (KO) mice] (Ohtsu et al., 2001).
As before, we measured the latency of sleep-to-wake transitions after 1 or 20 Hz light pulse trains (15 ms light pulses for 10 s starting 15 s after sleep onset). We found that stimulation at 20 Hz significantly reduced the latency to wakefulness of animals transduced with Hcrt::ChR2– mCherry compared with control animals in both HDC KO and wild-type animals (p < 0.0001 for all comparisons with control) after both SWS and REM sleep (Fig. 6A,B). Light pulses at 1 Hz did not result in a significant decrease in the latency to wakefulness (p > 0.05 for all comparisons with control). As in wild-type animals, photostimulation in HDC KO animals shifted the distribution of sleep-to-wake latencies to lower values, increasing the probability of an awakening event from either SWS or REM sleep (Fig. 6C,D). There was no significant difference in sleep-to-wake latency values between HDC KO and wild-type animals (p > 0.05 for all comparisons between genetic background).
Figure 6.

Stimulation of Hcrt neurons is sufficient to increase sleep-to-wake transitions in HDC KO mice. A, B, Latencies to wake transitions after stimulation during SWS (A) or REM sleep (B) in wild-type animals or HDC KO animals transduced with either Hcrt::ChR2–mCherry or Hcrt::mCherry (n = 6 for each condition). Photostimulation consisted of 15 ms light pulses at either 1 or 20 Hz for 10 s. All photostimulation experiments took place from 1:00 to 5:00 P.M. Data analysis is based on an average of 30 or 10 stimulations per frequency and per mouse during SWS and REM sleep, respectively. Latencies represent mean ± SEM. We found significant differences in the latencies between ChR2–mCherry and mCherry control animals at 20 Hz stimulation (but not 1 Hz stimulation) in both wild-type and HDC KO animals (***p < 0.0001 using a two-tailed Student's t test). C, D, Cumulative probability distribution of latencies from SWS (C) or REM sleep (D) after light stimulation (ChR2–mCherry animals, blue/light blue curves; mCherry control animals, red/pink curves). The 20 Hz stimulation of ChR2–mCherry transduced animals significantly shifted the probability distributions in both wild-type and HDC KO mice during both SWS and REM sleep (p < 0.001, KS test). Furthermore, there was no significant difference between wild-type and HDC KO mice for any stimulation condition during SWS and REM sleep (p > 0.05, KS test). E, Stimulation of Hcrt neurons is sufficient to increase transitions from SWS to wakefulness in HDC KO mice. We used a chronic stimulation protocol (15 ms light pulses for 10 s every minute for 1 h) to test frequencies of stimulation at 1, 5, 10, 20, and 30 Hz stimulation in animals transduced with Hcrt::ChR2–mCherry (n = 4) and Hcrt::mCherry (n = 4). We measured the number of transitions from SWS to wakefulness for each frequency and found a significant increase in the number of transitions in Hcrt::ChR2–mCherry transduced animals compared with control animals for stimulations greater that 5 Hz. Data represent the mean ± SEM number of transitions from SWS to wakefulness. Analysis is based on duplicated stimulation sessions for each animal. *p < 0.05 using a two-tailed Student's t test between ChR2–mCherry and mCherry transduced animals.
To determine whether long-term chronic stimulation increased the number of SWS- to-wake transitions in HDC KO animals, we subjected animals to a chronic stimulation protocol (15 ms pulses for 10 s every min for 1 h) at frequencies of 1, 5, 10, 20, and 30 Hz. We found a significant increase in the number of transitions in Hcrt::ChR2–mCherry animals compared with control animals for all stimulation frequencies >5 Hz (Fig. 6E) (p < 0.05, two-way ANOVA, followed by Student's t test between conditions). These results suggest that Hcrt-mediated sleep-to-wake transitions do not depend on the histaminergic system.
Discussion
The present study demonstrates that optical stimulation of Hcrt neurons is sufficient to increase transitions from SWS and REM sleep to wakefulness throughout the entire light/dark period but that this stimulation is insufficient to increase transitions after 2 or more hours of sleep deprivation. We also found that the arousal-promoting neuromodulator histamine is not necessary for Hcrt-mediated sleep-to-wake transitions to occur.
Hcrt-mediated sleep-to-wake transitions across the light/dark period
Previous studies report that Hcrt neurons are relatively silent during sleep compared with wakefulness, with phasic bursts of activity preceding transitions to wakefulness (Lee et al., 2005; Mileykovskiy et al., 2005). Our results complement these correlational studies, demonstrating a causal role between Hcrt activity and transitions to wakefulness throughout the light/dark period. By artificially providing 10 s bursts of activity in Hcrt neurons during sleep, we found that this activity increased the probability of an awakening event throughout the entire inactive period (Fig. 2). Chronic stimulation increased the number of SWS-to-wake transitions throughout both the active and inactive periods (Fig. 2E). We believe that chronic photostimulation did not result in an increase in REM-to-wake transitions because not enough REM events occurred during the sampling conditions. Our chronic photostimulation protocol only stimulated Hcrt cells for 10 s each min, probably missing many of the REM sleep events that occurred during the 1 h stimulation period. Alternatively, postsynaptic inhibition of Hcrt target neurons, likely imposed by local GABAergic interneurons, may be more potent during REM sleep than SWS (Nitz and Siegel, 1997a,b; Gervasoni et al., 1998; Maloney et al., 1999, 2000).
The ability of Hcrt neurons to promote transitions to wakefulness throughout the light/dark period suggests that one role of these neurons may be to promote arousal whenever necessary depending on environmental conditions. For example, in conditions of food deprivation, stress, or anxiety, Hcrt neurons may promote wakefulness and arousal so that an animal may react appropriately to a challenging environment (McEwen and Stellar, 1993). Indeed, these neurons are anatomically well positioned to integrate information about energy balance (Yamanaka et al., 2003), stress (Winsky-Sommerer et al., 2004), and emotional stimuli (Sakurai et al., 2005). Furthermore, challenging environmental conditions strengthen synaptic connections onto Hcrt neurons, potentially increasing Hcrt neural activity and promoting arousal regardless of circadian time (Rao et al., 2007). Our study supports this hypothesis, demonstrating the sufficiency of Hcrt neurons to promote arousal throughout the entire light/dark period.
Sleep pressure moderates Hcrt-mediated sleep-to-wake transitions
A major finding of our study is that Hcrt-mediated sleep-to-wake transitions are diminished with increasing sleep pressure (Fig. 3). Importantly, not only did sleep deprivation increase the delta power of SWS compared with baseline conditions (supplemental Fig. 5B, available at www.jneurosci.org as supplemental material), but the slow-wave activity inversely correlated with Hcrt-mediated sleep-to-wake transitions (Fig. 3E,F). Therefore, the greater the sleep pressure caused by sleep deprivation, the less the effect of Hcrt stimulation in promoting wakefulness. These results demonstrate that, although stimulation of the Hcrt system is sufficient to promote wakefulness throughout the light/dark period, the effects of this stimulation have natural limits depending on the drive to sleep. Interestingly, the percentage of Hcrt neurons expressing c-Fos, a biomarker of neural activity, was the same in Hcrt:: ChR2–mCherry animals after 0 or 2 h sleep deprivation (Fig. 4). These results suggest that photostimulation was still sufficient to drive neural activity in these cells but that sleep deprivation blocked Hcrt-mediated sleep-to-wake transitions by affecting downstream neurons.
Current models of sleep–wake regulation, such as the “flip–flop” model proposed by Saper et al. (2005), suggest that Hcrts promote arousal by exciting the LC, TMN, and DRN. Recent studies suggest that the LC and DRN may play a role in maintaining muscle tone, whereas activity in the TMN is linked to the maintenance of waking (John et al., 2004). Indeed, we found an increase of c-Fos expression in the LC and TMN after photostimulation of Hcrt neurons but not after 2 h sleep deprivation (Fig. 5). Therefore, these downstream nuclei must receive inhibitory input from other neural structures that respond to sleep pressure and actively promote sleep. Current models of sleep regulation suggest both homeostatic and circadian drives for sleep (Achermann and Borbély, 2003; Saper et al., 2005). Both the homeostatic and circadian drives for sleep are thought to exert excitatory influences on sleep-promotion nuclei, such as the VLPO, while also exerting inhibitory influences on arousal-promoting nuclei. The VLPO sends inhibitory projections to many arousal-promoting nuclei, including the LC and TMN (Sherin et al., 1996). Cells in the lateral hypothalamus that express melanin-concentrating hormone are also active during sleep (Modirrousta et al., 2005; Hassani et al., 2009) and project to arousal-promoting nuclei (Saito et al., 2001).
This underlying anatomy and physiology suggests a model in which homeostatic and circadian factors influence a balance between sleep- and arousal-promoting neurotransmitters/neuromodulators (Fig. 7A). In this model, optical stimulation of Hcrt neurons tips the balance such that there is increased excitation in arousal-promoting neurotransmitters, increasing the probability of an awakening event (Fig. 7B). However, after 2 or more hours of sleep deprivation, the homeostatic drive for sleep exerts influences that directly or indirectly inhibit firing in nuclei downstream of Hcrt neurons. Exogenous stimulation of Hcrt neurons would be insufficient to overcome this inhibition (Fig. 7C). Thus, although Hcrt neurons are sufficient to promote wakefulness when necessary across the light/dark period, homeostatic and circadian mechanisms that increase the drive to sleep can overcome Hcrt excitatory input to downstream targets.
Figure 7.
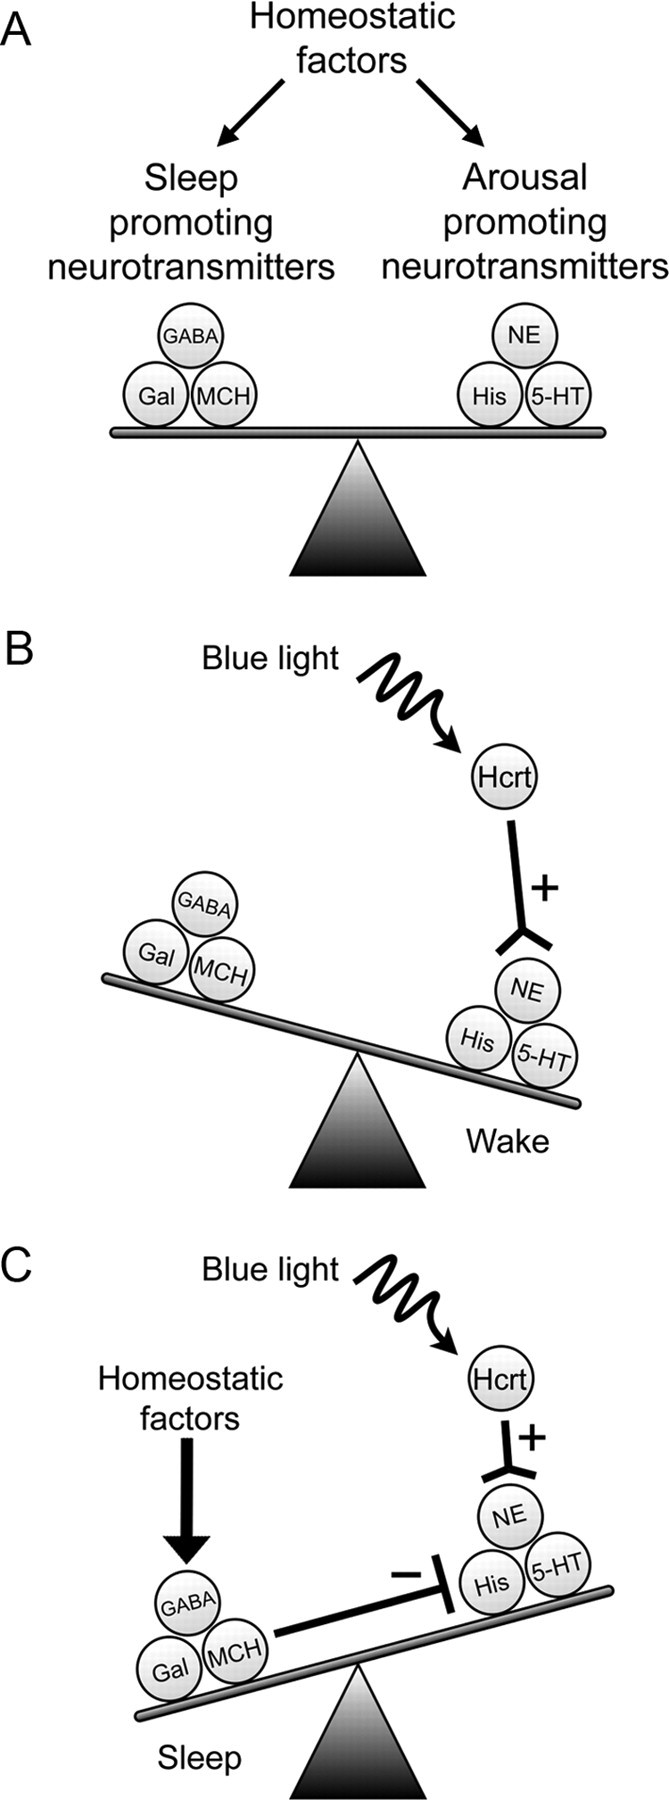
A model of Hcrt-mediated promotion of wakefulness. A, The balance between sleep and wake states is facilitated by sleep-promoting and arousal-producing neurotransmitters expressed in specific nuclei of the hypothalamus and brainstem. These neurons are influenced by circadian and homeostatic factors that regulate neuron excitability, gene expression, and synaptic efficacy. B, Stimulation of Hcrt neurons excites arousal-producing neurons, shifting the balance between sleep–wake states and increasing the probability of an awakening event. C, In conditions of increased sleep pressure, sleep-promoting neurons and neurotransmitters actively inhibit arousal-promoting nuclei. Arousal-promoting nuclei may also be inhibited by external factors and autoregulation by long-term depression of excitatory synapses and circadian downregulation of gene expression. The inhibition of these arousal-promoting nuclei may overpower the excitatory input from ChR2-stimulated Hcrt neurons. Thus, although ChR2 is sufficient to drive action potentials in Hcrt cells, the afferent projections are inadequate to overcome the inhibition attributable to increased sleep pressure. 5HT, Serotonin; Gal, galanin; His, histamine; MCH, melanin-concentrating hormone; NE, norepinephrine.
Histamine is not necessary for Hcrt-mediated sleep-to-wake transitions
The histaminergic TMN heavily expresses Hcrt-r2 and receives dense projections from Hcrt neurons (Peyron et al., 1998; Trivedi et al., 1998; Marcus et al., 2001; Nishino et al., 2001). These neurons showed an increase in c-Fos staining after Hcrt stimulation but not after sleep deprivation, in which Hcrt-mediated sleep-to-wake transitions were lost (Fig. 5) (supplemental Table 1, available at www.jneurosci.org as supplemental material). Therefore, we focused on the TMN as a site that may mediate the actions of Hcrt in promoting wakefulness. We found no significant difference between latencies-to-wakefulness in SWS or REM sleep between wild-type animals and HDC KO animals (Fig. 6). These results suggest that HDC transmission is not required for Hcrt-mediated transitions to wakefulness.
Our results contrast with other studies that used different methods to examine the role of the TMN in the ability of Hcrts to promote wakefulness. For example, Huang et al. (2001) found that injection of Hcrt1 into the lateral ventricles produced a significant increase in wakefulness but not in animals in which the histaminergic H1R receptor was genetically ablated. Similarly, Shigemoto et al. (2004) found that intracerebroventricular injection of Hcrt1 caused an increase in wakefulness and a decrease in SWS and REM sleep but this effect was blocked by intracerebroventricular injection of pyrilamine, an H1R antagonist. These studies used pharmacological and perhaps non-endogenous levels of peptide application to observe increases in wakefulness. Our study depended on endogenous Hcrt release from Hcrt cells stimulated at physiologically relevant firing rates. Furthermore, H1R ablation may have produced sleep-promoting effects more severe than exogenous application of Hcrt peptide could overcome to promote wakefulness.
It is also possible that HDC KO mice compensate for a lack of histamine during development, perhaps by strengthening connections between Hcrt cells and other arousal-promoting nuclei. Luquet et al. (2005) showed that ablation of neuropeptide Y/agouti-related peptide neurons in adults resulted in altered feeding behaviors, whereas systemic gene deletion during development lacked a feeding phenotype. This study demonstrates the potential for hypothalamic systems to compensate during development. Given the apparent redundancy in arousal-promoting centers in the brain, perhaps no phenotype is present when the histaminergic system is ablated during development but could be more pronounced when deleted as an adult.
Optogenetic study of sleep–wake transitions
This study is one of a growing number of studies using optogenetic stimulation of genetically targeted neurons to manipulate behavior in a variety of animals, including rodents (Adamantidis et al., 2007; Aravanis et al., 2007; Alilain et al., 2008; Gradinaru et al., 2009; Huber et al., 2008; Tsai et al., 2009), zebrafish (Douglass et al., 2008), flies (Zhang et al., 2007c), and worms (Nagel et al., 2005). For decades, the study of the neural circuitry regulating sleep–wake states has been limited by the inability to perturb specific populations of neurons in vivo (Kilduff et al., 2008). Future targeting of optogenetic transgenes to other populations of neurons hypothesized to play a role in regulating arousal will be useful to test models of sleep boundary state control, such as the flip–flop models of SWS and REM sleep (Saper et al., 2005; Lu et al., 2006). Furthermore, emerging technologies that have the potential to deliver light to brain regions of human subjects (Bernstein et al., 2008) could be used in the treatment of severe sleep disorders.
Footnotes
M.E.C. is supported by fellowships from the National Science Foundation and National Institutes of Health (award number 5F31MH083439). A.A. is supported by fellowships from the Fonds National de la Recherche Scientifique (FRS-FNRS–“Charge de Recherche”), National Alliance for Research on Schizophrenia and Depression, and the Fondation Leon Frederic. K.D. is supported by the California Institute of Regenerative Medicine, the McKnight and Wallace H. Coulter Foundations, the National Science Foundation, the National Institute of Mental Health, the National Institute on Drug Abuse, the National Institutes of Health Pioneer Award, and the Kinetics and Keck Foundations. L.d.L. is supported by grants from the National Institute on Drug Abuse, Defense Advanced Research Projects Agency, and National Alliance for Research on Schizophrenia and Depression.
References
- Abumaria N, Rygula R, Hiemke C, Fuchs E, Havemann-Reinecke U, Rüther E, Flügge G. Effect of chronic citalopram on serotonin-related and stress-regulated genes in the dorsal raphe nucleus of the rat. Eur Neuropsychopharmacol. 2007;17:417–429. doi: 10.1016/j.euroneuro.2006.08.009. [DOI] [PubMed] [Google Scholar]
- Achermann P, Borbély AA. Mathematical models of sleep regulation. Front Biosci. 2003;8:S683–S693. doi: 10.2741/1064. [DOI] [PubMed] [Google Scholar]
- Adamantidis A, de Lecea L. Physiological arousal: a role for hypothalamic systems. Cell Mol Life Sci. 2008;65:1475–1488. doi: 10.1007/s00018-008-7521-8. [DOI] [PMC free article] [PubMed] [Google Scholar]
- Adamantidis AR, Zhang F, Aravanis AM, Deisseroth K, de Lecea L. Neural substrates of awakening probed with optogenetic control of hypocretin neurons. Nature. 2007;450:420–424. doi: 10.1038/nature06310. [DOI] [PMC free article] [PubMed] [Google Scholar]
- Alilain WJ, Li X, Horn KP, Dhingra R, Dick TE, Herlitze S, Silver J. Light-induced rescue of breathing after spinal cord injury. J Neurosci. 2008;28:11862–11870. doi: 10.1523/JNEUROSCI.3378-08.2008. [DOI] [PMC free article] [PubMed] [Google Scholar]
- Aravanis AM, Wang LP, Zhang F, Meltzer LA, Mogri MZ, Schneider MB, Deisseroth K. An optical neural interface: in vivo control of rodent motor cortex with integrated fiberoptic and optogenetic technology. J Neural Eng. 2007;4:S143–S156. doi: 10.1088/1741-2560/4/3/S02. [DOI] [PubMed] [Google Scholar]
- Aston-Jones G, Bloom FE. Activity of norepinephrine-containing locus coeruleus neurons in behaving rats anticipates fluctuations in the sleep-waking cycle. J Neurosci. 1981;1:876–886. doi: 10.1523/JNEUROSCI.01-08-00876.1981. [DOI] [PMC free article] [PubMed] [Google Scholar]
- Bernstein JG, Han X, Henninger MA, Ko EY, Qian X, Franzesi GT, McConnell JP, Stern P, Desimone R, Boyden ES. Prosthetic systems for therapeutic optical activation and silencing of genetically-targeted neurons. Proc Soc Photo Opt Instrum Eng. 2008;6854:68540H. doi: 10.1117/12.768798. [DOI] [PMC free article] [PubMed] [Google Scholar]
- Bourgin P, Huitrón-Résendiz S, Spier AD, Fabre V, Morte B, Criado JR, Sutcliffe JG, Henriksen SJ, de Lecea L. Hypocretin-1 modulates rapid eye movement sleep through activation of locus ceruleus neurons. J Neurosci. 2000;20:7760–7765. doi: 10.1523/JNEUROSCI.20-20-07760.2000. [DOI] [PMC free article] [PubMed] [Google Scholar]
- Boyden ES, Zhang F, Bamberg E, Nagel G, Deisseroth K. Millisecond-timescale, genetically targeted optical control of neural activity. Nat Neurosci. 2005;8:1263–1268. doi: 10.1038/nn1525. [DOI] [PubMed] [Google Scholar]
- Chemelli RM, Willie JT, Sinton CM, Elmquist JK, Scammell T, Lee C, Richardson JA, Williams SC, Xiong Y, Kisanuki Y, Fitch TE, Nakazato M, Hammer RE, Saper CB, Yanagisawa M. Narcolepsy in orexin knockout mice: molecular genetics of sleep regulation. Cell. 1999;98:437–451. doi: 10.1016/s0092-8674(00)81973-x. [DOI] [PubMed] [Google Scholar]
- de Lecea L, Kilduff TS, Peyron C, Gao X, Foye PE, Danielson PE, Fukuhara C, Battenberg EL, Gautvik VT, Bartlett FS, 2nd, Frankel WN, van den Pol AN, Bloom FE, Gautvik KM, Sutcliffe JG. The hypocretins: hypothalamus-specific peptides with neuroexcitatory activity. Proc Natl Acad Sci U S A. 1998;95:322–327. doi: 10.1073/pnas.95.1.322. [DOI] [PMC free article] [PubMed] [Google Scholar]
- Deurveilher S, Lo H, Murphy JA, Burns J, Semba K. Differential c-Fos immunoreactivity in arousal-promoting cell groups following systemic administration of caffeine in rats. J Comp Neurol. 2006;498:667–689. doi: 10.1002/cne.21084. [DOI] [PubMed] [Google Scholar]
- Douglass AD, Kraves S, Deisseroth K, Schier AF, Engert F. Escape behavior elicited by single, channelrhodopsin-2-evoked spikes in zebrafish somatosensory neurons. Curr Biol. 2008;18:1133–1137. doi: 10.1016/j.cub.2008.06.077. [DOI] [PMC free article] [PubMed] [Google Scholar]
- España RA, Baldo BA, Kelley AE, Berridge CW. Wake-promoting and sleep suppressing actions of hypocretin (orexin): basal forebrain sites of action. Neuroscience. 2001;106:699–715. doi: 10.1016/s0306-4522(01)00319-0. [DOI] [PubMed] [Google Scholar]
- España RA, Plahn S, Berridge CW. Circadian-dependent and circadian-independent behavioral actions of hypocretin/orexin. Brain Res. 2002;943:224–236. doi: 10.1016/s0006-8993(02)02653-7. [DOI] [PubMed] [Google Scholar]
- Franken P, Chollet D, Tafti M. The homeostatic regulation of sleep need is under genetic control. J Neurosci. 2001;21:2610–2621. doi: 10.1523/JNEUROSCI.21-08-02610.2001. [DOI] [PMC free article] [PubMed] [Google Scholar]
- Gervasoni D, Darracq L, Fort P, Soulière F, Chouvet G, Luppi PH. Electrophysiological evidence that noradrenergic neurons of the rat locus coeruleus are tonically inhibited during sleep. Eur J Neurosci. 1998;10:964–970. doi: 10.1046/j.1460-9568.1998.00106.x. [DOI] [PubMed] [Google Scholar]
- Gradinaru V, Mogri M, Thompson KR, Henderson JM, Deisseroth K. Optical deconstruction of parkinsonian neural circuitry. Science. 2009;324:354–359. doi: 10.1126/science.1167093. [DOI] [PMC free article] [PubMed] [Google Scholar]
- Haas HL, Sergeeva OA, Selbach O. Histamine in the nervous system. Physiol Rev. 2008;88:1183–1241. doi: 10.1152/physrev.00043.2007. [DOI] [PubMed] [Google Scholar]
- Hagan JJ, Leslie RA, Patel S, Evans ML, Wattam TA, Holmes S, Benham CD, Taylor SG, Routledge C, Hemmati P, Munton RP, Ashmeade TE, Shah AS, Hatcher JP, Hatcher PD, Jones DN, Smith MI, Piper DC, Hunter AJ, Porter RA, Upton N. Orexin A activates locus coeruleus cell firing and increases arousal in the rat. Proc Natl Acad Sci U S A. 1999;96:10911–10916. doi: 10.1073/pnas.96.19.10911. [DOI] [PMC free article] [PubMed] [Google Scholar]
- Harris GC, Wimmer M, Aston-Jones G. A role for lateral hypothalamic orexin neurons in reward seeking. Nature. 2005;437:556–559. doi: 10.1038/nature04071. [DOI] [PubMed] [Google Scholar]
- Hassani OK, Lee MG, Jones BE. Melanin-concentrating ohmone neurons discharge in a reciprocal manner to orexin neurons across the sleep-wake cycle. Proc Natl Acad Sci U S A. 2009;106:2418–2422. doi: 10.1073/pnas.0811400106. [DOI] [PMC free article] [PubMed] [Google Scholar]
- Huang ZL, Qu WM, Li WD, Mochizuki T, Eguchi N, Watanabe T, Urade Y, Hayaishi O. Arousal effect of orexin A depends on activation of the histaminergic system. Proc Natl Acad Sci U S A. 2001;98:9965–9970. doi: 10.1073/pnas.181330998. [DOI] [PMC free article] [PubMed] [Google Scholar]
- Huber D, Petreanu L, Ghitani N, Ranade S, Hromádka T, Mainen Z, Svoboda K. Sparse optical microstimulation in barrel cortex drives learned behaviour in freely moving mice. Nature. 2008;451:61–64. doi: 10.1038/nature06445. [DOI] [PMC free article] [PubMed] [Google Scholar]
- Ida T, Nakahara K, Katayama T, Murakami N, Nakazato M. Effect of lateral cerebroventricular injection of the appetite-stimulating neuropeptide, orexin and neuropeptide Y, on the various behavioral activities of rats. Brain Res. 1999;821:526–529. doi: 10.1016/s0006-8993(99)01131-2. [DOI] [PubMed] [Google Scholar]
- Jacobs BL, Azmitia EC. Structure and function of the brain serotonin system. Physiol Rev. 1992;72:165–229. doi: 10.1152/physrev.1992.72.1.165. [DOI] [PubMed] [Google Scholar]
- John J, Wu MF, Boehmer LN, Siegel JM. Cataplexy-active neurons in the hypothalamus: implications for the role of histamine in sleep and waking behavior. Neuron. 2004;42:619–634. doi: 10.1016/s0896-6273(04)00247-8. [DOI] [PMC free article] [PubMed] [Google Scholar]
- Kilduff TS, Lein ES, de la Iglesia H, Sakurai T, Fu YH, Shaw P. New developments in sleep research: molecular genetics, gene expression, and systems neurobiology. J Neurosci. 2008;28:11814–11818. doi: 10.1523/JNEUROSCI.3768-08.2008. [DOI] [PMC free article] [PubMed] [Google Scholar]
- Kohlmeier KA, Watanabe S, Tyler CJ, Burlet S, Leonard CS. Dual orexin actions on dorsal raphe and laterodorsal tegmentum neurons: noisy cation current activation and selective transients mediated by L-type calcium channels. J Neurophysiol. 2008;100:2265–2281. doi: 10.1152/jn.01388.2007. [DOI] [PMC free article] [PubMed] [Google Scholar]
- Lee MG, Hassani OK, Jones BE. Discharge of identified orexin/hypocrein neurons across the sleep-waking cycle. J Neurosci. 2005;25:6716–6720. doi: 10.1523/JNEUROSCI.1887-05.2005. [DOI] [PMC free article] [PubMed] [Google Scholar]
- Lin L, Faraco J, Li R, Kadotani H, Rogers W, Lin X, Qiu X, de Jong PJ, Nishino S, Mignot E. The sleep disorder canine narcolepsy is caused by a mutation in the hypocretin (orexin) receptor 2 gene. Cell. 1999;98:365–376. doi: 10.1016/s0092-8674(00)81965-0. [DOI] [PubMed] [Google Scholar]
- Lu J, Sherman D, Devor M, Saper CB. A putative flip-flop switch for control of REM sleep. Nature. 2006;441:589–594. doi: 10.1038/nature04767. [DOI] [PubMed] [Google Scholar]
- Luquet S, Perez FA, Hnasko TS, Palmiter RD. NPY/AgRP neurons are essential for feeding in adult mice but can be ablated in neonates. Science. 2005;310:683–685. doi: 10.1126/science.1115524. [DOI] [PubMed] [Google Scholar]
- Maloney KJ, Mainville L, Jones BE. Differential c-Fos expression in cholinergic, monoaminergic, and GABAergic cell groups of the pontomesencephalic tegmentum after paradoxical sleep deprivation and recovery. J Neurosci. 1999;19:3057–3072. doi: 10.1523/JNEUROSCI.19-08-03057.1999. [DOI] [PMC free article] [PubMed] [Google Scholar]
- Maloney KJ, Mainville L, Jones BE. c-Fos expression in GABAergic, serotonergic, and other neurons of the pontomedullary reticular formation and raphe after paradoxical sleep deprivation and recovery. J Neurosci. 2000;20:4669–4679. doi: 10.1523/JNEUROSCI.20-12-04669.2000. [DOI] [PMC free article] [PubMed] [Google Scholar]
- Marcus JN, Aschkenasi CJ, Lee CE, Chemelli RM, Saper CB, Yanagisawa M, Elmquist JK. Differential expression of orexin receptors 1 and 2 in the rat brain. J Comp Neurol. 2001;435:6–25. doi: 10.1002/cne.1190. [DOI] [PubMed] [Google Scholar]
- McEwen BS, Stellar E. Stress and the individual. Mechanisms leading to disease. Arch Intern Med. 1993;153:2093–2101. [PubMed] [Google Scholar]
- Mileykovskiy BY, Kiyashchenko LI, Siegel JM. Behavioral correlates of activity in identified hypocretin/orexin neurons. Neuron. 2005;46:787–798. doi: 10.1016/j.neuron.2005.04.035. [DOI] [PMC free article] [PubMed] [Google Scholar]
- Modirrousta M, Mainville L, Jones BE. Orexin and MCH neurons express c-Fos differently after sleep deprivation vs. recovery and bear different adrenergic receptors. Eur J Neurosci. 2005;21:2807–2816. doi: 10.1111/j.1460-9568.2005.04104.x. [DOI] [PubMed] [Google Scholar]
- Nagel G, Brauner M, Liewald JF, Adeishvili N, Bamberg E, Gottschalk A. Light activation of channelrhodopsin-2 in excitable cells of Caenorhabditis elegans triggers rapid behavioral responses. Curr Biol. 2005;15:2279–2284. doi: 10.1016/j.cub.2005.11.032. [DOI] [PubMed] [Google Scholar]
- Nishino S, Ripley B, Overeem S, Lammers GJ, Mignot E. Hypocretin (orexin) deficiency in human narcolepsy. Lancet. 2000;355:39–40. doi: 10.1016/S0140-6736(99)05582-8. [DOI] [PubMed] [Google Scholar]
- Nishino S, Fujiki N, Ripley B, Sakurai E, Kato M, Watanabe T, Mignot E, Yanai K. Descreased brain histamine content in hypocretin/orexin receptor-2 mutated narcoleptic dogs. Neurosci Lett. 2001;313:125–128. doi: 10.1016/s0304-3940(01)02270-4. [DOI] [PubMed] [Google Scholar]
- Nitz D, Siegel JM. GABA release in the dorsal raphe nucleus: role in the control of REM sleep. Am J Physiol. 1997a;273:R451–R455. doi: 10.1152/ajpregu.1997.273.1.R451. [DOI] [PMC free article] [PubMed] [Google Scholar]
- Nitz D, Siegel JM. GABA release in the locus coeruleus as a function of sleep/wake state. Neuroscience. 1997b;78:795–801. doi: 10.1016/s0306-4522(96)00549-0. [DOI] [PMC free article] [PubMed] [Google Scholar]
- Ohtsu H, Tanaka S, Terui T, Hori Y, Makabe-Kobayashi Y, Pejler G, Tchougounova E, Hellman L, Gertsenstein M, Hirasawa N, Sakurai E, Buzás E, Kovács P, Csaba G, Kittel A, Okada M, Hara M, Mar L, Numayama-Tsuruta K, Ishigaki-Suzuki S, Ohuchi K, Ichikawa A, Falus A, Watanabe T, Nagy A. Mice lacking histidine decarboxylase exhibit abnormal mast cells. FEBS Lett. 2001;502:53–56. doi: 10.1016/s0014-5793(01)02663-1. [DOI] [PubMed] [Google Scholar]
- Pace-Schott EF, Hobson JA. The neurobiology of sleep: genetics, cellular physiology and subcortical networks. Nat Rev Neurosci. 2002;3:591–605. doi: 10.1038/nrn895. [DOI] [PubMed] [Google Scholar]
- Palchykova S, Winsky-Sommerer R, Meerlo P, Dürr R, Tobler I. Sleep deprivation impairs object recognition in mice. Neurobiol Learn Mem. 2006;85:263–271. doi: 10.1016/j.nlm.2005.11.005. [DOI] [PubMed] [Google Scholar]
- Paxinos G, Franklin K. The mouse brain in stereotaxic coordinates. Ed 2. New York: Academic; 2001. [Google Scholar]
- Peyron C, Tighe DK, van den Pol AN, de Lecea L, Heller HC, Sutcliffe JG, Kilduff TS. Neurons containing hypocretin (orexin) project to multiple neuronal systems. J Neurosci. 1998;18:9996–10015. doi: 10.1523/JNEUROSCI.18-23-09996.1998. [DOI] [PMC free article] [PubMed] [Google Scholar]
- Piper DC, Upton N, Smith MI, Hunter AJ. The novel brain neuropeptide, orexin-A, modulates the sleep-wake cycle of rats. Eur J Neurosci. 2000;12:726–730. doi: 10.1046/j.1460-9568.2000.00919.x. [DOI] [PubMed] [Google Scholar]
- Rao Y, Liu ZW, Borok E, Rabenstein RL, Shanabrough M, Lu M, Picciotto MR, Horvath TL, Gao XB. Prolonged wakefulness induces experience-dependent synaptic plasticity in mouse hypocretin/orexin neurons. J Clin Invest. 2007;117:4022–4033. doi: 10.1172/JCI32829. [DOI] [PMC free article] [PubMed] [Google Scholar]
- Saito Y, Cheng M, Leslie FM, Civelli O. Expression of the melanin-concentrating hormone (MCH) receptor mRNA in the rat brain. J Comp Neurol. 2001;435:26–40. doi: 10.1002/cne.1191. [DOI] [PubMed] [Google Scholar]
- Sakurai T. The neural circuit of orexin (hypocretin): maintaining sleep and wakefulness. Nat Rev Neurosci. 2007;8:171–181. doi: 10.1038/nrn2092. [DOI] [PubMed] [Google Scholar]
- Sakurai T, Amemiya A, Ishii M, Matsuzaki I, Chemelli RM, Tanaka H, Williams SC, Richardson JA, Kozlowski GP, Wilson S, Arch JR, Buckingham RE, Haynes AC, Carr SA, Annan RS, McNulty DE, Liu WS, Terrett JA, Elshourbagy NA, Bergsma DJ, Yanagisawa M. Orexins and orexin receptors: a family of hypothalamic neuropeptides and G protein-coupled receptors that regulate feeding behavior. Cell. 1998;92:573–585. doi: 10.1016/s0092-8674(00)80949-6. [DOI] [PubMed] [Google Scholar]
- Sakurai T, Nagata R, Yamanaka A, Kawamura H, Tsujino N, Muraki Y, Kageyama H, Kunita S, Takahashi S, Goto K, Koyama Y, Shioda S, Yanagisawa M. Input of orexin/hypocretin neurons revealed by a genetically encoded tracer in mice. Neuron. 2005;46:297–308. doi: 10.1016/j.neuron.2005.03.010. [DOI] [PubMed] [Google Scholar]
- Saper CB, Scammell TE, Lu J. Hypothalamic regulation of sleep and circadian rhythms. Nature. 2005;437:1257–1263. doi: 10.1038/nature04284. [DOI] [PubMed] [Google Scholar]
- Senba E, Daddona PE, Watanabe T, Wu JY, Nagy JI. Coexistence of adenosine deaminase, histidine decarboxylase, and glutamate decarboxylase on hypothalamic neurons of the rat. J Neurosci. 1985;5:3393–3402. doi: 10.1523/JNEUROSCI.05-12-03393.1985. [DOI] [PMC free article] [PubMed] [Google Scholar]
- Sherin JE, Shiromani PJ, McCarley RW, Saper CB. Activation of ventrolateral preoptic neurons during sleep. Science. 1996;271:216–219. doi: 10.1126/science.271.5246.216. [DOI] [PubMed] [Google Scholar]
- Shigemoto Y, Fujii Y, Shinomiya K, Kamei C. Participation of histaminergic H1 and noradrenergic alpha 1 receptors in orexin A-induced wakefulness in rats. Brain Res. 2004;1023:121–125. doi: 10.1016/j.brainres.2004.07.031. [DOI] [PubMed] [Google Scholar]
- Trivedi P, Yu H, MacNeil DJ, Van der Ploeg LH, Guan XM. Distribution of orexin receptor mRNA in the rat brain. FEBS Lett. 1998;438:71–75. doi: 10.1016/s0014-5793(98)01266-6. [DOI] [PubMed] [Google Scholar]
- Tsai HC, Zhang F, Adamantidis A, Stuber GD, Bonci A, de Lecea L, Deisseroth K. Phasic firing in dopaminergic neurons is sufficient for behavioral conditioning. Science. 2009;324:1080–1084. doi: 10.1126/science.1168878. [DOI] [PMC free article] [PubMed] [Google Scholar]
- Winsky-Sommerer R, Yamanaka A, Diano S, Borok E, Roberts AJ, Sakurai T, Kilduff TS, Horvath TL, de Lecea L. Interactions between the corticotropin-releasing factor system and hypocretins (orexins): a novel circuit mediating stress response. J Neurosci. 2004;24:11439–11448. doi: 10.1523/JNEUROSCI.3459-04.2004. [DOI] [PMC free article] [PubMed] [Google Scholar]
- Yamanaka A, Beuckmann CT, Willie JT, Hara J, Tsujino N, Mieda M, Tominaga M, Yagami K, Sugiyama F, Goto K, Yanagisawa M, Sakurai T. Hypothalamic orexin neurons regulate arousal according to energy balance in mice. Neuron. 2003;38:701–713. doi: 10.1016/s0896-6273(03)00331-3. [DOI] [PubMed] [Google Scholar]
- Zhang F, Aravanis AM, Adamantidis A, de Lecea L, Deisseroth K. Circuit breakers: optical technologies for probing neural signals and systems. Nat Rev Neurosci. 2007a;8:577–581. doi: 10.1038/nrn2192. [DOI] [PubMed] [Google Scholar]
- Zhang F, Wang LP, Brauner M, Liewald JF, Kay K, Watzke N, Wood PG, Bamberg E, Nagel G, Gottschalk A, Deisseroth K. Multimodal fast optical interrogation of neural circuitry. Nature. 2007b;446:633–639. doi: 10.1038/nature05744. [DOI] [PubMed] [Google Scholar]
- Zhang W, Ge W, Wang Z. A toolbox for light control of Drosophila behaviors through Channelrhodopsin 2-mediated photoactivation of targeted neurons. Eur J Neurosci. 2007c;26:2405–2416. doi: 10.1111/j.1460-9568.2007.05862.x. [DOI] [PubMed] [Google Scholar]