

Abstract
In this report, we present a simple and powerful way to incorporate individual-specific liability classes into linkage analysis. The proposed method is applicable to both quantitative and qualitative traits. In linkage studies, we may have information about different covariates. Incorporation of these covariates along with the estimates of residual familial effects, age-at-onset effects, and susceptibility in the definition of liability classes can increase the power to detect genetic linkage. In this study, we show how one can form individual-specific liability classes and use these classes in standard linkage-analysis programs, such as the widely used LINKAGE package, to perform more powerful genetic linkage analysis. Our simulation study shows that this approach yields higher LOD scores and more-accurate estimates of the recombination fraction in the families showing linkage. The proposed method is also applied to kindreds collected, at the M. D. Anderson Cancer Center, through probands with childhood soft-tissue sarcoma. Confirmed germ-line mutations in the p53 tumor-suppressor gene have been identified in these families. Application of our method to these families yielded significantly higher LOD scores and more-accurate recombination fractions than did analysis that did not account for individual-specific covariate information.
In linkage analysis, liability classes are used to define penetrance values for each of the possible genotypes of the trait loci. A diallelic locus with disease allele D and normal allele N has three possible genotypes—NN, ND, and DD—and one usually specifies a penetrance value for each of these three genotypes (Terwilliger and Ott 1994). For example, if the disease follows single dominant Mendelian inheritance, then one would specify penetrance values of 0, 1, and 1 for NN, ND, and DD, respectively. If the penetrance is reduced with possible phenocopies, then one might specify penetrance values of, say, 0.1, 0.8, and 0.8, respectively. Liability groups are useful for classification of individuals into different penetrance groups, on the basis of their age and sex. While performing linkage analysis, investigators typically use 10–20 liability groups based on the subjects’ age and sex. For the kth age group (which includes individuals of age xk-1 to xk), the penetrance may be defined for the ith genotype, as (1/2)[Fi(xk-1)+Fi(xk)] where, at the lower limit of the kth age group, penetrance is Fi(xk-1), and, at the upper limit, it is Fi(xk) (Ott 1999). In this report, we propose the use of individual-specific liability classes. This is a useful and powerful approach for modeling, because, even if two individuals are in the same age group and have the same sex, they may have different environmental exposures, smoking statuses, eating habits, and ethnicities, any of which might further modify their risk of developing a disease.
Incorporation of these environmental and behavioral risk factors to develop individual-specific penetrance classes should result in more-powerful tests of linkage. This approach would be useful for complex disorders such as cancer, in which many factors—such as smoking, disease status of first- and second-degree relatives, ethnic group, sex, eating habits, and socioeconomic status—play an important role in modifying one’s risk. The proposed approach can be easily adapted in the standard linkage-analysis programs—such as FASTLINK, LINKAGE, and VITTESE (Cottingham et al. 1993; Terwilliger and Ott 1994; O’Connell and Weeks 1995)—in a very simple manner, by modifying the parameter file and recompiling the program in order to allow enough liability classes to model each individual.
To evaluate the power gain due to this approach, we performed simulation studies. We generated phenotype value according to the model
where gi is the major gene effect, Gi is the polygenic effect, X values are uncorrelated environmental effects, and ei is the error. We assumed a polygenic variance of σ2G=2, error variance σ2e=1, and β1=β2=2. The X covariates were generated from a normal distribution with mean and variance equal to 1. We considered a dominant disease model with a disease-allele frequency of 0.1 (the results for other disease models were similar and are not presented). Because we are considering a dominant disease model, gi takes two values: a for genotypes homozygous and heterozygous for the disease allele and −a for the genotypes homozygous for the normal allele. We chose values of a=1.5, 2.0, and 2.5; these choices resulted in heritabilities of 0.11, 0.18, and 0.26, respectively. Individuals were classified as affected if their phenotypic values exceeded a given threshold. These thresholds were chosen so that, conditional on covariate values, phenocopies are ∼12.4% and penetrances for the disease allele genotypes are 71%–95%. Prevalence of the disease can be calculated by the usual methods. Let p and q be the frequencies of the normal and the disease allele, respectively. Then, for a dominant model, prevalence is defined as p2* phenocopies + (2pq+q2)* penetrance. Here, one would use mean values of phenocopies and penetrances, of all individuals in the sample. For our simulated data, prevalence was 23%–28%. A four-allele equifrequent marker was simulated at a recombination fraction (θ) of 0.0, 0.05, and 0.1. We simulated 500 replicate samples. In each replicate, we simulated 100 sibships with five sibs per sibship. We performed linkage analysis in three ways: first, by assigning a single liability class for all individuals; second, by assigning 10 liability classes, by dividing groups into 10 classes based on their covariate values; and, finally, by assigning each individual to a separate class, conditional on the covariate values. The 10 classes were obtained by dividing the range of covariate values into 10 groups. From equation (1), conditional on gi and on covariates X1i and X2i, the mean phenotype value of the ith individual is μci=gi+β1X1i+β2X2i, and the conditional variance σ2c is equal to σ2G+σ2e. Then, the individual-specific penetrance for the ith individual is k∞φ(x,μci,σ2c)dx, where k is the given threshold and φ(x,μci,σ2c) is the normal density function with mean μci and variance σ2c. We use the μci and σ2c given above. In general, one would obtain these parameter estimates on the basis of regressive model-based segregation analysis (S.A.G.E. 1997).
The results of this analysis are reported in table 1: the true values of θ are given in the first column, and the means of estimated values of θ, as well as of the corresponding LOD scores, when individual-specific liabilities are used, are given in the second and the third columns, respectively; when a single liability class is used for all individuals, these parameter estimates are given in the fourth and the fifth columns, respectively; and, finally, when 10 liability classes are used, these estimates are given in the sixth and the seventh columns, respectively; all values in parentheses are median estimates of these two parameters. From table 1, it can be seen that the use of individual-specific liability groups significantly increased the power to detect linkage. The mean LOD scores were two to three times higher when our method was used. Also noteworthy is that the estimates of θ were more accurate when the proposed method was used. Also, the 95% confidence intervals based on the proposed method were significantly smaller (data not shown). Assigning, say, 20 classes would increase the LOD scores, compared with the results for 10 classes, but these LOD scores were still smaller than those resulting from our approach (data not shown).
Table 1.
Estimates of θ and of LOD Scores, for a Dichotomized Trait
|
Mean (Median) Estimates |
||||||
| Individual-Specific Liabilities |
Common Liabilities |
10 Liabilities |
||||
| True θ | Estimated θ | LOD Score | Estimated θ | LOD Score | Estimated θ | LOD Score |
| Heritability .26: | ||||||
| .0 | .015 (.0) | 4.37 (4.24) | .047 (.0) | 1.62 (1.44) | .0 (.0) | 2.42 (2.34) |
| .05 | .05 (.05) | 3.12 (3.00) | .08 (.05) | 1.22 (1.02) | .0 (.0) | 1.91 (1.86) |
| .1 | .1 (.1) | 2.09 (1.82) | .13 (.1) | .90 (.73) | .02 (.0) | 1.42 (1.37) |
| Heritability .18: | ||||||
| .0 | .025 (.0) | 2.23 (2.14) | .095 (.01) | .71 (.55) | .01 (.0) | 1.02 (.98) |
| .05 | .06 (.01) | 1.63 (1.50) | .13 (.05) | .55 (.39) | .02 (.0) | .81 (.79) |
| .1 | .11 (.1) | 1.13 (.89) | .18 (.1) | .43 (.22) | .04 (.0) | .61 (.57) |
| Heritability .11: | ||||||
| .0 | .07 (.0) | .78 (.61) | .16 (.01) | .26 (.16) | .05 (.0) | .30 (.27) |
| .05 | .12 (.05) | .58 (.43) | .20 (.1) | .21 (.09) | .09 (.0) | .23 (.20) |
| .1 | .16 (.1) | .43 (.25) | .22 (.1) | .18 (.05) | .13 (.0) | .19 (.14) |
Usually in linkage analysis, underlying quantitative phenotype values are available, on the basis of which individuals are classified as either affected or unaffected, according to whether their phenotype exceeds a certain predetermined threshold (as we did in our simulation in the previous paragraph); but it is known that use of these quantitative-trait values instead of dichotomization of the trait can give much more power to detect linkage. Our method can easily be applied to quantitative traits. We used the individual-specific liability-classes method for the quantitative trait simulated earlier. In this case, we used a normal probability-density function for the penetrance classes. Conditional on covariates, for the ith individual with genotype gi and phenotype Yi, penetrance was defined as the probability-density function, φ(Yi,μci,σ2c), where μci and σ2c are as defined above. The results of this analysis are reported in table 2. Once again, as expected, we observed a significant gain in power (i.e., a 5–10-fold increase) to detect linkage when we used these individual-specific liability classes. The estimates of θ were also more accurate, and the 95% confidence intervals (data not shown) were much smaller, in the data analysis that used the proposed method. Also, the LOD scores were higher when quantitative-trait values, rather than dichotomization of the trait, were used.
Table 2.
Mean (Median) Estimates of θ and of LOD Scores, for a Quantitative Trait
|
Mean (Median) Estimates |
||||||
| Individual-Specific Densities |
Unconditional Densities |
10 Groups of Densities |
||||
| True θ | Estimated θ | LOD Score | Estimated θ | LOD Score | Estimated θ | LOD Score |
| Heritability .26: | ||||||
| .0 | .0 (.0) | 17.52 (17.36) | .021 (.0) | 3.44 (3.25) | .0 (.0) | 6.82 (6.82) |
| .05 | .05 (.05) | 11.91 (11.71) | .052 (.05) | 2.50 (2.36) | .0 (.0) | 5.42 (5.42) |
| .1 | .1 (.1) | 7.85 (7.62) | .1 (.1) | 1.68 (1.46) | .0 (.0) | 4.08 (3.96) |
| Heritability .18: | ||||||
| .0 | .0 (0.0) | 10.87 (10.88) | .05 (.0) | 1.45 (1.37) | .0 (.0) | 2.83 (2.80) |
| .05 | .04 (.05) | 7.62 (7.34) | .08 (.05) | 1.08 (.90) | .0 (.0) | 2.27 (2.24) |
| .1 | .08 (.1) | 5.12 (4.77) | .13 (.1) | .82 (.54) | .0 (.0) | 1.74 (1.72) |
| Heritability .11: | ||||||
| .0 | .01 (.0) | 4.66 (4.60) | .12 (.01) | .49 (.35) | .0 (.0) | .81 (.79) |
| .05 | .04 (.01) | 3.31 (3.12) | .16 (.05) | .38 (.22) | .01 (.0) | .65 (.62) |
| .1 | .08 (.05) | 2.32 (2.07) | .18 (.1) | .31 (.14) | .01 (.0) | .51 (.47) |
Next, linkage analysis using the proposed approach was performed on three large white families ascertained through childhood soft-tissue sarcoma and found to have Li-Fraumeni syndrome (LFS [MIM 151623]). LFS is characterized by increased incidence of soft-tissue sarcoma, osteosarcoma, breast cancer, adrenocortical carcinoma, leukemia, and brain tumors, at early ages and in multiple family members (Li and Fraumeni 1969, 1982). The families studied here are part of a study of patients with childhood sarcoma who were surveyed at The University of Texas M. D. Anderson Cancer Center. The details of the clinical data and of the method of data collection have been reported elsewhere (Strong et al. 1987). Confirmed germline mutations in the p53 tumor-suppressor gene have been identified in these families. Excess aggregation of cancer in relatives of patients with childhood sarcoma was found to be well described by segregation of a rare autosomal dominant locus with age-dependent penetrance (Bondy et al. 1992; Lustbader et al. 1992). Here we studied linkage in three families in which confirmed mutations in the p53 gene have been identified; these three families with LFS included 610, 32, and 31 individuals, with 51, 5, and 9 affected by cancer, respectively.
To elucidate genetic and other covariate effects, we performed regressive logistic model-based segregation analysis implemented by the REGTL program of S.A.G.E. (Bonney 1986; S.A.G.E. 1997). The best-fitting model was a rare dominant disorder, as expected. Various parameter estimates are reported in table 3. The mean ages at onset were 32.19 years for those carrying the disease allele and 104.6 years for subjects homozygous for the normal allele, for both males and females. The advanced estimated age at onset for normal-allele homozygotes indicates that these individuals would die from other competing risk factors before developing the disease—and, hence, would likely be censored before developing cancer. Susceptibility was found to be 100%. The individual-specific penetrance was calculated by use of the estimates of various parameters associated with the regressive model, as follows. Let yi be the phenotype (0 or 1) of the ith individual. Here, phenotypic value 1 means that the individual was affected, and 0 means that the individual was unaffected. For an affected individual i with genotype ui and age at onset ai, we use the penetrance
 |
where si is the sex of i; Xi is a vector of covariates; Si, Mi, and Fi are the spouse, mother, and father of i; and γsi is the susceptibility (i.e., the probability that a randomly selected individual from this population is affected).
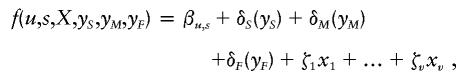 |
where βu,s is a baseline parameter that is the natural logarithm of the odds of being affected versus being unaffected (when other components are zero), αu,s is the age coefficient, and δ's are regressive familial effects. We integrate equation (2) from zero, to the age at examination, a′i, both for unaffected individuals and for affected individuals for whom the age at onset, ai, is unknown (Bonney 1986; Elston and George 1989). This gives the penetrance value
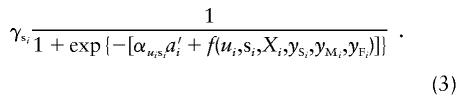 |
Table 3.
Estimates of Various Parameters of the Segregation Analysis
| Parameter | Estimate (SD) |
| Frequency of A | .01301 (.0072) |
| Baseline parameter βAA | −2.8061 (.5192) |
| Baseline parameter βBB | −7.4107 (1.3096) |
| Coefficient of smoking | −.0952 (.0619) |
| Age-adjusted coefficient of AA | .0872 (.0109) |
| Age-adjusted coefficient of BB | .0709 (.0149) |
| Mean age at onset for AA | 32.19 (4.866) |
| Mean age at onset for BB | 104.59 (18.482) |
| Susceptibility | 1.000 (…) |
Missing covariate information can be handled by using various techniques, such as imputation for missing data, which we will not discuss here because they are not the primary concern of this report. We performed linkage analysis by using the FASTLINK program with individual-specific penetrance classes, obtained by use of equations (2) and (3), for the p53 mutation–carrying families with LFS that have been described above. We found very strong evidence for linkage, with a LOD score of 8.27 at θ=0.01; at θ=0, the LOD score was 8.23. Linkage analysis with a single penetrance class gave a LOD score of 4.27 at θ=0.1 and of 1.56 at θ=0. We also analyzed these families by using 10 liability classes. An individual was assigned to one of the 10 classes based on affection status, and either age at onset or, for an unaffected individual, age at examination. Penetrance for each class was assigned as average risk, by genotype, for that group. This linkage analysis gave a LOD score of 6.68 at θ=0. Hence, when these mutation-carrier families were used, we obtained a higher LOD score and more-accurate estimates of θ by using individual-specific penetrances. This observation is consistent with our simulation results presented in tables 1 and 2.
In conclusion, for complex diseases involving multiple genetic and environmental determinants, it is extremely useful to employ techniques that are simple to implement and that result in higher power to detect true linkage. In this report, we have presented a simple yet very powerful way to incorporate individual-specific liability classes into linkage analysis of quantitative and qualitative traits. Compared with the use of just a single liability class, the use of 10–20 classes based on age and/or sex can increase a LOD score; nonetheless, individual-specific liability classes still yield higher LOD scores and more-accurate estimates of θ. In addition, our method of forming liability classes is more objective than arbitrarily establishing 10–20 classes based on age and/or sex only. This is particularly important in the study of complex disorders, which can be strongly dependent on, among other factors, environmental covariates and ethnic group. This approach can be implemented whenever one has estimates of various genetic and environmental covariate effects, which are usually obtained by segregation analysis.
Comparison of the proposed approach with other methods that jointly allow for adjustment of covariates would be interesting. Although the variance-components method can include covariates jointly in the modeling of linkage, that procedure treats allele effects as random, and so this method is distinct from what we propose here.
Acknowledgments
We thank the two anonymous reviewers for their helpful constructive comments. We also thank Dr. Maureen Goode for comments that led to a better presentation of the material in this report. Some of the results reported were obtained by the program package S.A.G.E., which is supported by U.S. Public Health Service Resource grant PR03655 from the National Center for Research Resources. This work is supported by National Institutes of Health grants CA76293, CA34936, and HG02275.
Electronic-Database Information
The accession number and URL for data in this article are as follows:
- Online Mendelian Inheritance in Man (OMIM), http://www.ncbi.nlm.nih.gov/Omim/ (for LFS [MIM 151623])
References
- Bondy ML, Lustbader ED, Strom SS, Strong LC (1992) Segregation analysis of 159 soft tissue sarcoma kindreds: comparison of fixed and sequential sampling schemes. Genet Epidemiol 9:291–304 [DOI] [PubMed] [Google Scholar]
- Bonney GE (1986) Regressive logistic models for familial disease and other binary traits. Biometrics 42:611–625 [PubMed] [Google Scholar]
- Cottingham RW Jr, Idury RM, Schäffer AA (1993) Faster sequential genetic linkage computations. Am J Hum Genet 53:252–263 [PMC free article] [PubMed] [Google Scholar]
- Elston RC, George VT (1989) Age of onset, age at examination, and other covariates in the analysis of family data. Genet Epidemiol 6:217–220 [DOI] [PubMed] [Google Scholar]
- Li FP, Fraumeni JF Jr (1969) Soft-tissue sarcomas, breast cancer, and other neoplasms: a familial syndrome? Ann Intern Med 71:747–752 [DOI] [PubMed] [Google Scholar]
- ——— (1982) Prospective study of a family cancer syndrome. JAMA 247:2692–2694 [PubMed] [Google Scholar]
- Lustbader ED, Williams WR, Bondy ML, Strom S, Strong LC (1992) Segregation analysis of cancer in families of childhood soft-tissue-sarcoma patients. Am J Hum Genet 51:344–356 [PMC free article] [PubMed] [Google Scholar]
- O’Connell JR, Weeks DE (1995) The VITESSE algorithm for rapid exact multilocus linkage analysis via genotype set-recoding and fuzzy inheritance. Nat Genet 11:402–408 [DOI] [PubMed] [Google Scholar]
- Ott J (1999) Analysis of human genetic linkage. Johns Hopkins University Press, Baltimore [Google Scholar]
- S.A.G.E. (1997) Statistical analysis for genetic epidemiology, release 3.1. Computer program package available from the Department of Epidemiology and Biostatistics, Case Western Reserve University, Cleveland [Google Scholar]
- Strong LC, Stine M, Norsted TL (1987) Cancer in survivors of childhood soft tissue sarcoma and their relatives. J Natl Cancer Inst 79:1213–1220 [PubMed] [Google Scholar]
- Terwilliger JD, Ott J (1994) Handbook of human genetic linkage. Johns Hopkins University Press, Baltimore [Google Scholar]