

Abstract
A loss in the necessary amount of sleep alters expression of genes and proteins implicated in brain plasticity, but key proteins that render neuronal circuits sensitive to sleep disturbance are unknown. We show that mild (4–6 h) sleep deprivation (SD) selectively augmented the number of NR2A subunits of NMDA receptors on postsynaptic densities of adult mouse CA1 synapses. The greater synaptic NR2A content facilitated induction of CA3-CA1 long-term depression in the theta frequency stimulation range and augmented the synaptic modification threshold. NR2A-knock-out mice maintained behavioral response to SD, including compensatory increase in post-deprivation resting time, but hippocampal synaptic plasticity was insensitive to sleep loss. After SD, the balance between synaptically activated and slowly recruited NMDA receptor pools during temporal summation was disrupted. Together, these results indicate that NR2A is obligatory for the consequences of sleep loss on hippocampal synaptic plasticity. These findings could advance pharmacological strategies aiming to sustain hippocampal function during sleep restriction.
Introduction
Sleep facilitates plasticity of neuronal circuits that underlie development, learning, and memory (Walker and Stickgold, 2004; Dang-Vu et al., 2006). Experience-dependent plasticity of neuronal assemblies exposed to novel environmental and sensory stimuli is consolidated during subsequent sleep (Frank et al., 2001; Miyamoto and Hensch, 2003; Hennevin et al., 2007). Sleep also participates in homeostasis of synaptic strength (Vyazovskiy et al., 2008) and is accompanied by differential expression of genes and proteins involved in synaptic plasticity (Cirelli, 2006; Vyazovskiy et al., 2008).
Despite this recent progress, key molecules rendering neuronal circuits sensitive to sleep are unknown. Sleep deprivation (SD) is a suitable approach to assess candidate factors in neuronal tissue subject to enhanced sleep pressure (Cirelli, 2006; Longordo et al., 2009). A prominent SD-sensitive target is the glutamatergic NMDA receptor (NMDAR), important for the induction of many forms of synaptic plasticity (Malenka and Bear, 2004). Prolonged SD (24–72 h) altered cytosolic levels of the NMDAR subunits NR1 and NR2A in whole hippocampus preparations (Chen et al., 2006; McDermott et al., 2006). A short (4–6 h) SD resulted in selectively enhanced membrane levels of the NMDAR subunit NR2A in purified hippocampal synaptosomes (Kopp et al., 2006). Periods of spontaneous wakefulness in rats (>75% of the last 6 h) were accompanied by elevated NR2A protein in hippocampal and, to a weaker extent, in cortical tissue preparations enriched in synaptic proteins (Vyazovskiy et al., 2008). However, whether enriched NR2A expression levels underlie the susceptibility of hippocampal and cortical circuits to sleep loss remains unknown (Graves et al., 2003; Vyazovskiy et al., 2008).
The NR2A subunit is an attractive candidate for a mechanistic link between sleep loss and neuronal plasticity. Augmented expression of NR2A is induced by both spontaneous and enforced waking, and is reversible through 3 h of recovery sleep (Kopp et al., 2006; Vyazovskiy et al., 2008). Moreover, various studies report that SD alters NMDAR-dependent forms of synaptic plasticity (Campbell et al., 2002; Davis et al., 2003; McDermott et al., 2003; Kopp et al., 2006) and hippocampus-dependent learning (Graves et al., 2003). Finally, NR2A subunit content sets kinetic profiles and signaling characteristics of NMDAR-mediated currents (Cull-Candy and Leszkiewicz, 2004) proposed to be important for bidirectional synaptic plasticity (Yashiro and Philpot, 2008).
Here, we identify an obligatory role for NR2A-containing NMDARs (NR2A-NMDARs), localized on the spines of apical CA1 dendrites, in conveying the effect of sleep loss on CA1 synaptic plasticity. Genetic deletion of the NR2A subunit does not alter sleep-wake behavior and homeostatic response to SD, but it preserves hippocampal plasticity from the impact of sleep loss. As to NR2A's role, we show that the increased synaptic NR2A content after sleep loss distinctly affects the contribution of synaptic and more slowly recruited NMDAR pools to temporal summation during plasticity-induction protocols. This study establishes a mechanistic link between a molecular correlate of sleep loss and its impact on system-relevant neuronal functions.
Materials and Methods
Animals.
C57BL/6J mice were generated from breeding pairs obtained from RCC Laboratory Animal Services. The NR2A-knock-out (NR2A KO) line (Sakimura et al., 1995) was repeatedly backcrossed into the C57BL/6J line from our provider. Adult postnatal day 56–70 (P56–P70) wild-type (WT) C57BL/6J and NR2A KO mice were kept in standard Macrolon cages and maintained on a 12 h light/dark cycle (light from 7:00 A.M. to 7:00 P.M.) with food and water provided ad libitum. Mice were genotyped by PCR. All experiments were performed in agreement with the guidelines of the Veterinary Institutes of the Canton Basel-Stadt and of the Canton de Vaud.
Behavioral monitoring and SD.
Three to seven days before being used, all animals were transferred to a testing room controlled for temperature (21.7–25.2°C), relative humidity (47–64%), and noise (∼45–50 dBA during the light phase). Subgroups of mice were regularly monitored (4–8 animals/month) for their sleep-wake behavior via tracking spontaneous locomotor activity (distance traveled per unit of recording time) using Ethovision 3.0 (Noldus Information Technology). As previously reported (Kapfhamer et al., 2002; Kopp et al., 2006), sleeping time approximated by the resting time (percentage of recording time during which the mouse activity equals 0 mm per second) was measured. All WT animals used in this study showed a distribution of resting and active behavior that was well entrained to the light-dark cycle and typical for an undisturbed 24 h cycle (Kopp et al., 2006).
SD was essentially performed as previously described in detail (Kopp et al., 2006) and was halted when mice remained in a sleeping position for >5 min (i.e., after 4.5 ± 0.1 h; n = 58 mice in total). Control undisturbed mice (n = 92 mice in total) were left totally undisturbed and were killed at the same time of day as the sleep-deprived animals (between 11:30 A.M. and 01:30 P.M.).
For behavioral analysis in NR2A KO mice, a subgroup of P56–P70 littermate WT (n = 6) and NR2A KO (n = 9) animals was used. For each session, 2–4 animals were monitored in the testing room, with at least one WT animal included. Baseline locomotor activity was tracked during three consecutive undisturbed light-dark cycles (72 h). The levels of activity and resting time of all the animals were quantified during SD and the following recovery period.
Electron microscopy.
For each experimental group (WT, NR2A KO, SD), n = 3 animals were used. Mice were kept under deep anesthesia with isoflurane and perfused through the ascending aorta with 0.9% saline for 1–2 min, followed by freshly prepared ice-cold fixative solution containing 4% paraformaldehyde, 0.05% glutaraldehyde and 15% saturated picric acid solution made up in 0.1 m phosphate buffer (PB; pH 7.2–7.4). Each animal was perfused with ∼150 ml of fixative solution. After perfusion, brains were removed from the skull and immersed in ice-cold PB for 2 h. Brains were then stored in ice-cold PB containing 1 m sucrose and 0.05% NaN3 until sections were prepared. Blocks from three hippocampi were washed in 0.1 m PB for 2 h. Sections of the hippocampus were cut at 500 μm, incubated in 1 m sucrose/PBS solution overnight, slammed onto copper blocks cooled in liquid nitrogen, and embedded in Lowicryl HM 20 (TAAB Laboratories) after freeze substitution with methanol. Ultrathin sections (70–90 nm) from three Lowicryl-embedded blocks were incubated for 45 min on pioloform-coated nickel grids with drops of blocking solution consisting of 2% albumin in 0.05 m TBS, 0.9% NaCl and 0.03% Triton X-100. The grids were transferred to solutions of NR2A (Millipore Bioscience Research Reagents) or NR2B [University of California, Davis (UC Davis)/National Institutes of Health (NIH) NeuroMab Facility, Davis, CA] antibodies at a final protein concentration of 10 μg/ml diluted in blocking solution overnight at room temperature.
After several washes in TBS, grids were incubated for 2 h in drops of goat anti-mouse IgG conjugated to 10 nm-colloidal gold particles (BioCell International), each diluted 1:80 in a 0.05 m TBS solution containing 2% normal human serum and 0.5% polyethylene glycol. Grids were then washed in TBS for 30 min and counterstained for electron microscopy (EM) with saturated aqueous uranyl acetate and lead citrate. Ultrastructural analyses were performed in a Jeol-1010 electron microscope. Electron photomicrographs were captured with CCD camera (Mega View III, Soft Imaging System). Digitized electron images were then modified for brightness and contrast by using Adobe PhotoShop CS1 to optimize them for printing.
To establish the relative abundance of NR2A and NR2B immunoreactivity in the different experimental groups, quantification of immunolabeling was performed in the distal part of the stratum radiatum from 80 nm ultrathin sections. For each of three animals, three samples of tissue were obtained (nine total blocks). Areas were randomly chosen and were digitally captured at a magnification of 50,000×. Only synapses made by axon terminals with pyramidal cell spines were included in the analysis. Nonlabeled synapses were not considered. Immunoparticles were counted within the anatomically defined synaptic junctions. The length of the postsynaptic density was measured on ultrathin sections and the number of immunoparticles per postsynaptic density was counted. This procedure was shown previously to provide reliable estimates of NMDAR subunit density (Lin et al., 2008). Finally, the density of NR2A or NR2B along the postsynaptic densities of dendritic spines of pyramidal cells, measured as number of immunoparticles per micrometer, was calculated in control conditions, after SD and in NR2A KO mice. Before carrying out statistical tests, data were assessed for their normal distribution, which was found to be the case for particle densities of both control and sleep-deprived animals (p = 0.409). Background staining of immunoparticles was measured over mitochondria and capillaries over a 2000 μm2 area, and amounted to 0.04 ± 0.02 particles/μm2 in WT mice and to 0.04 ± 0.01 particles/μm2 in NR2A KO mice.
Electrophysiological recordings.
Parasagittal slices (300–400 μm) were prepared according to standard procedures (Kopp et al., 2006). A cut was applied between CA3 and CA1 to prevent epileptic discharges.
For extracellular recordings, slices (400 μm) were placed in an interface-style recording chamber at 33.0 ± 0.5°C and continuously perfused with standard artificial CSF (ACSF) (in mm): 131 NaCl; 2.5 KCl; 1.25 NaH2PO4; 1.2 MgCl2; 2 CaCl2; 26 NaHCO3, 20 dextrose, 1.7 l(+)-ascorbic acid supplemented with picrotoxin (25–50 μm) and bubbled with 95%/5% O2/CO2. Field EPSPs (fEPSPs) were evoked by recruiting Schaffer collateral inputs with 100 μs pulses delivered through bipolar stimulation and recorded with a glass pipette (2–3 MΩ) filled with ACSF and positioned in the CA1 stratum radiatum. Stimulation intensity was adjusted to ∼50% of the maximal response before population spikes started to appear, requiring stimulation intensities of 20–60 μA. Average fEPSP slopes were −362 ± 18 μV/ms (n = 77 slices in control mice) and −382 ± 21 μV/ms (n = 71 slices in sleep-deprived mice). The signals were amplified 1000 times and filtered between 10 and 3000 Hz (Differential Amplifier DP301; Warner Instruments) before being digitally acquired at 10 kHz (Clampex 9.2; Molecular Devices). Analysis was completed using Clampfit 9.2. Before inducing plasticity, a 10 min baseline of fEPSPs at 0.05 Hz was recorded that fulfilled the following stability criteria: standard deviation <5%, slope of linear fitting <± 0.1%/min. Conditioning protocols of 900 pulses delivered at 5 Hz or 10 Hz were applied, followed by 30 min postconditioning at a stimulation frequency of 0.05 Hz. In NR2A KO mice, bidirectional synaptic plasticity was assessed by using 1 Hz low-frequency stimulation (900 pulses at 1 Hz) and 100 Hz high-frequency stimulation (two 1 s pulses at 100 Hz separated by 30 s). When testing the effects of NMDAR antagonists on synaptic plasticity, experiments in drug-free conditions (ACSF) were always performed interleaved to test experiments, in which slices were preincubated with a single antagonist for at least 1 h. Effects of the drugs were analyzed and plotted with respect to the interleaved ACSF experiments. Synaptic strength of the postsynaptic response was assessed by the 10–90% slope of the fEPSP and normalized to the corresponding mean baseline value. Long-term plasticity was assessed during the last 10 min of 30 min of postconditioning recordings. In individual experiments, the criterion for long-term depression (LTD) and long-term potentiation (LTP) induction was set at ≥10% of absolute change from baseline.
For whole-cell voltage-clamp experiments, slices (300 μm) were transferred to a storage chamber filled with ACSF and maintained at 35°C for the first 30 min and then allowed to cool to room temperature (21−22°C). For recordings, slices were transferred to a submerged recording chamber and maintained at near-physiological temperature (32.5–33.5°C) in ACSF. Patch pipettes (2.5–3.5 MΩ) were pulled from borosilicate glass (TW150F-4; World Precision Instruments) and filled with the following (in mm): 127 cesium gluconate, 10 HEPES, 2 cesium BAPTA, 6 MgCl2, 2 Mg-ATP, and 10 phosphocreatine, adjusted to pH 7.25–7.28 with gluconic acid and to 290–295 mOsm. Mg-GTP (0.2 mm) and QX-314 (1 mm) were freshly added daily, and the solution was filtered and maintained on ice. This solution yielded a liquid junction potential of −10 mV (Kopp et al., 2006), which was not compensated. Whole-cell recordings were obtained under visual control, using near-infrared differential interference contrast microscopy (BX51WI; Olympus). Voltage-clamp recordings were obtained using an Axopatch 200B amplifier (Molecular Devices), filtered at 2 kHz, and acquired at 10 kHz using pClamp 9.2 software. Analysis was completed using Clampfit 9.2. After obtaining whole-cell access, synaptic currents were evoked every 20 s by brief current pulses delivered via a bipolar stimulation electrode placed in the CA1 stratum radiatum. Series resistances (<20 MΩ) were constantly monitored throughout the experiments and changes >20% were not accepted.
To study pharmacology of NMDAR-mediated synaptic responses, NMDAR-mediated EPSCs (NMDAR-EPSCs) were recorded at a holding potential of −35 to −30 mV, while stimulating Schaffer collaterals at 0.033 Hz, in the presence of picrotoxin (100 μm), glycine (1 μm) and the AMPA/kainate receptor antagonist DNQX (40 μm) or NBQX (10 μm). After obtaining a stable baseline of 15 min (30 sweeps), the NR2B-NMDAR selective antagonist CP-101,606 (CP; 10 μm) or the NR2A-NMDAR preferential antagonist NVP-AAM077 (NVP; 50 nm) were bath-applied for at least 20 min. At the end of each experiment, the response was blocked by d,l-APV (100 μm). Evoked currents, from which the responses in d,l-APV were digitally subtracted, were measured at their peak and normalized to the corresponding mean baseline amplitude. Antagonist effects were quantified as percentage of baseline responses in the last 10 min of recordings. A major portion of the pharmacological experiments was performed blind to genotype.
Temporal summation of NMDAR-EPSCs in response to 5 Hz stimulation was quantified at a holding potential of +40 mV. Stimulation of Schaffer collaterals was adjusted to evoke NMDAR-EPSCs in the range of 50–150 pA, and average responses were comparable in the different experimental groups (WT, SD, and NR2A KO) (see Fig. 8 and legend), such that equivalent voltage-clamp control could be ensured (Diamond, 2001; Arnth-Jensen et al., 2002). Experiments from control and sleep-deprived animals were run in an interleaved manner. First, the stability of the NMDAR-mediated response was tested by using a single-pulse protocol, which consisted of three NMDAR-EPSCs elicited at 0.05 Hz at +40 mV, followed by a silent period of 5 min during which the cell was held at −55/−50 mV. The stability of the reversal potential was also monitored by recording the NMDAR-EPSC at +10 and +20 mV before stimulation at +40 mV. After obtaining a stable response for at least 3 successive single-pulse protocols, a stimulation train protocol was applied that consisted of 3 consecutive 5 Hz trains of 50 pulses at 25 s intervals. Unless otherwise noted, averaged NMDAR-mediated currents were normalized to the peak amplitude of the response induced by the first pulse. When the effects of NMDAR antagonists on temporally summated currents were studied, a first stimulation train protocol was elicited in ACSF. The cell was then repolarized to −55/−50 mV during the bath application of the antagonist. After 15 min of drug application, NMDAR-EPSCs were recorded at +10 mV, +20 mV, and +40 mV to check for the stability of the reversal potential and a stimulation train protocol in the presence of the antagonist was then applied. At the end of each experiment the current was blocked by application of the general antagonist d, l-APV (100 μm).
Figure 8.

The NR2A/NR2B ratio sets characteristic properties of temporal summation of NMDAR-EPSCs during 5 Hz stimulation. A, Representative train of 50 NMDAR-EPSCs elicited at 5 Hz in a slice from a control undisturbed WT mouse, obtained from the average of three consecutive sweeps. The horizontal dashed line indicates the baseline value of the holding current before 5 Hz stimulation. B, Enlarged section of the first five responses of the train shown in A, with arrows indicating the persistent and phasic current components. C, Average time course of the total (black circles), phasic (dark gray circles) and persistent (light gray circles) current components during 5 Hz stimulation trains in control undisturbed WT mice (n = 34). All currents were normalized to the amplitude of the first peak (97.1 ± 7.0 pA; n = 34). D, Effect of CP on temporal summation. Top, Representative traces of responses to the first pulse in the train and of steady-state responses (40th to 45th pulses), scaled to the first EPSC. Bottom, Temporal development (left) and steady-state values (right, average of the last 10 pulses) of the total (upper panel), persistent (middle panel) and phasic (lower panel) current components in drug-free conditions (ACSF, black circles and bars) and following bath-application of 10 μm CP (dark gray circles and bars) in slices from control undisturbed WT mice. NMDAR-EPSC amplitudes were normalized to that of the first peak (ACSF: 86.5 ± 9.6 pA; CP: 49.1 ± 6.1 pA, n = 9). *p < 0.03; **p < 0.0002 (paired t test). E, Same experiment as D, performed for NR2A KO mice (light gray circles and bars) and WT littermates (black circles and bars) in control undisturbed conditions. NMDAR-EPSCs were normalized to the amplitude of the first peak in the train (WT: 97.1 ± 7.0, n = 34; NR2A KO: 102.3 ± 9.1 pA, n = 11). **p < 0.0001 (unpaired t test). F, Plot of normalized persistent (upper panel) and phasic (lower panel) current components (last 10 pulses average) versus the relative contribution of NR2A- and NR2B-NMDARs (WT, black circles; WT_CP, dark gray circles; NR2A KO, light gray circles). G, Same experiment as D and E, performed for WT animals in control undisturbed conditions (Ctrl; black circles and bars) and after SD (white circles and bars). NMDAR-EPSC amplitudes were normalized to that of the first peak in the train (Ctrl: 83.1 ± 9.4, n = 18; SD: 84.7 ± 5.5 pA, n = 16). *p < 0.03 (unpaired t test).
AMPA receptor (AMPAR)-EPSCs were recorded at −60 to −65 mV in the presence of picrotoxin (100 μm). For temporal summation of AMPAR-mediated currents, the stability of the AMPAR-EPSCs was tested by eliciting single pulse stimulation at 0.05 Hz. After obtaining a stable response, the stimulation train protocol at 5 Hz was applied.
Calculation of the relative contributions of NR2A- and NR2B-NMDARs to the NMDAR-EPSCs and prediction of summed actions of NVP plus CP.
Given the high selectivity of CP for NR2B-NMDARs (Köhr, 2006) and its low affinity for triheteromeric NR2A/NR2B-NMDARs (Chazot et al., 2002), we estimated the total contribution of diheteromeric NR2B-NMDAR to an NMDAR-EPSC (NR2BWT; expressed as a fraction of 1) by using the following equation: NR2BWT = (fCP_WT/fCP_KO), where fCP_WT and fCP_KO represent the CP-sensitive components in WT and NR2A KO mice, respectively, normalized to the NMDAR-EPSC amplitudes during baseline recording (INMDA_WT and INMDA_KO, respectively). Given the dominant expression of NR2A and NR2B subunit proteins at adult synapses in the hippocampus (Monyer et al., 1994), the remaining fraction (NR2AWT = 1 − NR2BWT) is mediated by NR2A-containing receptors (di- and triheteromers).
We then used the estimated relative contribution of NR2B- and NR2A-NMDARs to predict the NMDAR-mediated current sensitive to the application of CP + NVP in combination (ICP+NVP_WT) by using the following equation: ICP+NVP_WT = INMDA_WT − [(INMDA_WT * NR2AWT * 0.77) + (INMDA_WT * NR2BWT * fNVP_KO)] − [(INMDA_WT * NR2BWT) * (1 − fNVP_KO) * fCP_KO], where fNVP_KO is the fraction of NMDAR-EPSC blocked by NVP (50 nm) in NR2A KO mice and 0.77 is the fraction of pure recombinant NR2A-NMDARs blocked by 50 nm NVP (Berberich et al., 2005). The first term in the first square bracket represents the estimated current mediated by NR2A-containing receptors (INMDA_WT * NR2AWT) that is blocked by 50 nm NVP by a factor of 0.77. The second term represents the estimated current mediated by NR2B-containing receptors (INMDA_WT * NR2BWT) that is blocked by NVP (fNVP_KO). The terms in the second square bracket represent the estimated residual current mediated by NR2B-containing receptors after the application of NVP [(INMDA_WT * NR2BWT)*(1 − fNVP_KO)] that is blocked by the application of 10 μm CP by a factor of fCP_KO.
Data analysis.
Kinetic properties of NMDAR-mediated currents evoked by a single pulse or at the end of a 5 Hz train of stimulation were studied as additional indicators of NMDAR subtype dominance in the synaptic response. To simplify the comparison across conditions, a single weighted decay measure (referred to in the text as decay time) was calculated by normalizing the charge transfer with the peak amplitude of the NMDAR-mediated currents (Arnth-Jensen et al., 2002; Lozovaya et al., 2004; Bellone and Nicoll, 2007). Charge transfer during the decay of the current was calculated from the integral of the current between the time of the EPSC peak and the time at which the current had returned to baseline. Datasets showed comparable low average series resistances (typically <15 MΩ in cells used for kinetics analysis) and similar EPSC sizes (see above) minimizing possible voltage-clamp artifacts that could have affected the kinetics of NMDAR-mediated currents. The effect of SD on the decay kinetics of NMDAR-mediated currents at the end of 5 Hz stimulation trains was confirmed by fitting decay curves with a biexponential function and then calculating the weighted time constants (Rumbaugh and Vicini, 1999) (data not shown).
When studying the properties of temporally summated NMDAR-mediated currents, persistent current components were quantified by measuring the amplitude of the current just preceding each stimulation artifact, whereas phasic current components were quantified by measuring NMDAR-EPSCs peak amplitude relative to the preceding baseline.
Linear summation of NMDAR-EPSCs.
A subset of representative experiments from WT (n = 8) and NR2A KO (n = 8) mice were chosen. For each dataset, the decay of experimentally measured NMDAR-EPSCs was fitted with a biexponential function I(t) = Af exp(−t/τf) + As exp(−t/τs), over a 800 ms window from the peak. Af and As are the amplitudes of the fast and slow components, and τf and τs are the respective time constants. The stimulus artifact and the rising component of the NMDAR-EPSCs were substituted with a 4 ms steady value equal to 0. NMDAR-EPSCs after the first pulse were scaled according to the phasic NMDAR-EPSC amplitudes. Fifty consecutive NMDAR-EPSCs were summated at 5 Hz. The properties of simulated NMDAR-mediated currents were analyzed as the experimental data.
Computational simulations.
Reaction rate models of NMDAR subtypes were derived from published work (Popescu, 2005) and from unpublished data (S. A. Amico-Ruvio and G. K. Popescu). Currents were simulated with ChanneLab version 2 (Synaptosoft). For simulating repeated glutamate release, the Stimulus Feature of ChanneLab was used to create repeated glutamate transients at 5 Hz, with an instantaneous rise and a decay time constant of 1.2 ms according to Clements et al., 1992. The amplitude of these pulses was determined by fitting the AMPAR model by Diamond and Jahr (1997), such that the experimentally measured AMPAR-mediated currents during repeated stimulation (see Fig. 9) were closely reproduced. These showed a slight facilitation, which could be reproduced by using glutamate concentrations of 0.55 mm for the first pulse, 0.825 mm for pulses 2–15 and 0.7 mm for pulses 16–20 (data not shown).
Figure 9.

Temporal profile of AMPAR-EPSCs in response to 5 Hz trains of 50 pulses is not altered after SD. Left, Sample trains of 50 AMPAR-EPSCs elicited at 5 Hz in a control undisturbed (Ctrl; top) and SD (bottom) WT mouse. The trace represents the average of three consecutive trains. Right, Average time course of the AMPAR-EPSCs during 5 Hz stimulation trains in control undisturbed (Ctrl, n = 10, black circles) and sleep-deprived (SD, n = 11, white circles) WT mice. All currents were normalized to the amplitude of the first peak (Ctrl: 297.6 ± 49.4 pA, n = 10; SD: 395.6 ± 77.7 pA, n = 11).
Drugs and chemicals.
Picrotoxin, d,l-APV, DNQX, and NBQX were purchased from Tocris Cookson; d-AA and standard salts were from Sigma-Aldrich. CP-101,606 was from Pfizer Pharmaceuticals and NVP-AAM077 was from Novartis Pharma. For NR2A, a monoclonal antibody was obtained from Millipore Bioscience Research Reagents. For NR2B, a monoclonal antibody was obtained from UC Davis/NIH NeuroMab Facility (Davis, CA).
Statistics.
Values are given in mean ± SEM. Statistics were done using ANOVA and t tests (two-tailed paired and unpaired for within and between group comparisons, respectively) using SPSS version 14.0. Chi squared (χ2 test) and Kolmogorov–Smirnov tests were also used when indicated. Significance was set at p < 0.05.
Results
Electron microscopy reveals equal amounts of NR2A and NR2B at control CA3-CA1 synapses and increased NR2A levels after SD
The relative amounts of NR2A and NR2B proteins, the predominant NR2 subunits of NMDARs in the adult hippocampus, were first probed via EM using postembedding immunogold and quantitative approaches in adult WT mice with a well entrained sleep-wake cycle (see Materials and Methods). Immunogold labeling for either NR2A or NR2B revealed almost exclusive labeling of the postsynaptic densities of dendritic spines (Fig. 1A, B), whereas extrasynaptic compartments contained very low levels of immunoreactivity. The density of gold particles, counted over the anatomically defined postsynaptic density of asymmetric synapses in CA1 stratum radiatum, was comparable for NR2A and NR2B antibodies (NR2A: 11.652 ± 7.143/μm, n = 70 synapses with 150 particles; NR2B: 12.404 ± 7.692/μm, n = 70 synapses with 155 particles), and similar to densities reported in adult rat tissue (Racca et al., 2000). At CA1 synapses from NR2A KO animals, no labeling for NR2A could be found (n = 70 synapses).
Figure 1.
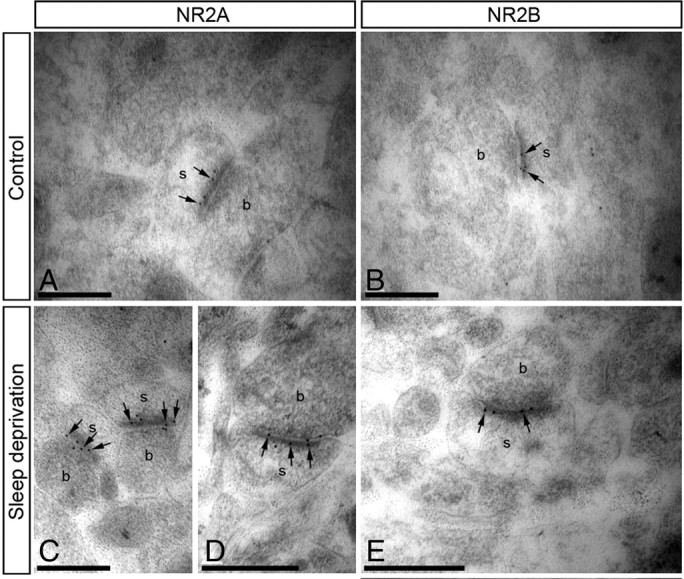
Comparable amounts of NR2A and NR2B subunit proteins at CA1 apical dendritic spines of control mice and selective increase in NR2A content after SD. A–E, Electron micrographs showing immunoreactivity for NR2A and NR2B in representative areas of CA1 stratum radiatum, as detected using postembedding immunogold EM. A, B, In control undisturbed mice, immunoparticles (arrows) for NR2A (A) and NR2B (B) proteins were found along postsynaptic densities of individual spines (s), establishing contact with axon terminals (b), presumably Schaffer collaterals. C–E, After SD, an increase in the number of immunoparticles for NR2A subunit protein was detected (C, D), whereas that for NR2B subunit protein did not change (E). Scale bars, 0.2 μm.
Analysis of CA1 synapses derived from mice that had undergone a mild SD (see Materials and Methods) (Kopp et al., 2006) revealed 1.6-fold greater levels of NR2A at synaptic sites (18.750 ± 14.286/μm, n = 70 synapses with 248 gold particles, p < 0.001 compared with synapses from control mice) (Fig. 1C, D). In contrast, NR2B immunogold density was not affected by SD (11.438 ± 8.333/μm, n = 70 synapses with n = 154 gold particles, p > 0.05) (Fig. 1E). Furthermore, average lengths of postsynaptic densities were similar (control: 0.179 ± 0.032 μm; SD: 0.180 ± 0.029 μm, p > 0.05), excluding the possibility that enlarged synapse size contributed to increased receptor numbers. Therefore, synapses from undisturbed mice contained equal levels of NR2A and NR2B protein, whereas SD selectively augmented the number of NR2A subunits at synaptic sites.
NR2A- and NR2B-NMDARs equally contribute to generate NMDAR-EPSCs at adult CA3-CA1 synapses
To assess the consequences of the SD-induced enhancement of NR2A subunit protein on CA3 to CA1 synaptic transmission and plasticity, we started by evaluating the efficacy of subtype-specific NMDAR antagonists in acute slices prepared from WT and NR2A KO mice kept under undisturbed housing conditions (see Materials and Methods). CP (10 μm), a well established NR2B-selective antagonist (Köhr, 2006), and NVP (50 nm), an NR2A-preferential antagonist (Berberich et al., 2005; Bartlett et al., 2007), were tested individually on NMDAR-EPSCs elicited in the hippocampal CA1 area via stimulating Schaffer collaterals and measured using whole-cell patch-clamp recordings (see Materials and Methods). Under these conditions, NMDAR-EPSC amplitudes were −39.5 ± 4.2 pA in NR2A KO mice (n = 16) and −55.2 ± 5.7 pA in WT mice (n = 17) at holding potentials of −30 to-35 mV to partially relieve the pore block by Mg2+. Current decay time, quantified by dividing the charge transfer by the peak amplitude of the EPSCs (see Materials and Methods) (Arnth-Jensen et al., 2002; Bellone and Nicoll, 2007), was markedly slower in cells from NR2A KO (176.9 ± 13.4 ms, n = 16) compared with WT mice (42.4 ± 2.3 ms, n = 17; p < 0.0001). In NR2A KO mice, NVP bath-applied at 50 nm attenuated the NMDAR-EPSCs by 20.3 ± 9.1%, with marginal significance (n = 9, p = 0.05) (Fig. 2A), in agreement with the minor effect of this concentration on heterologously expressed NR2B-NMDARs (Berberich et al., 2005). Conversely, 10 μm CP blocked the NMDAR-EPSCs by 74.7 ± 3.6% (n = 6, p < 0.0001) (Fig. 2B) consistent with its submaximal antagonistic potency. In WT mice, NVP and CP reduced NMDAR-EPSCs by 48.0 ± 4.4% (n = 6, p < 0.0005) and 36.0 ± 7.7% (n = 7, p < 0.005), respectively (Fig. 2C, D). Decay times decelerated in NVP (48.2 ± 4.0 ms vs 60.0 ± 5.6 ms before and after NVP application, respectively, n = 6, p < 0.005) (Fig. 2E), but were unaltered in CP (40.4 ± 2.8 ms vs 42.5 ± 4.2 ms, n = 7, p = 0.53) (Fig. 2F). Based on these values, we estimated the relative contributions of NR2B- and NR2A-containing NMDARs to EPSCs (see Materials and Methods for detailed calculation). The submaximal antagonism of CP (Berberich et al., 2005) (Fig. 2B) and its low affinity for triheteromeric NMDARs (Chazot et al., 2002) predicted a contribution of NR2B-NMDAR diheteromers to the NMDAR-EPSC of 48% (Fig. 2G), with the remaining 52% being mediated by di- and triheteromeric NR2A-containing NMDARs. NR2A- and NR2B-containing NMDARs thus generated equal portions of NMDAR-EPSCs in adult CA3-CA1 synapses, in excellent agreement with receptor subunit densities measured with EM (Fig. 1A, B) or using immunoprecipitation (Al-Hallaq et al., 2007). Finally, by using these estimates we further tested for the selectivity of NVP block in WT synapses. We measured experimentally and predicted theoretically the effects of coapplication of NVP and CP. Notably, the combined application of these antagonists reduced NMDAR-EPSCs from WT mice by 76.2 ± 4.0% (n = 5) (Fig. 2H, I), in excellent agreement with the predicted block when assuming two complementary subpopulations of NVP- and CP-sensitive NMDARs (79%) (see Materials and Methods). Moreover, in WT mice, the NMDAR antagonist NVP (50 nm) did not affect basal synaptic transmission through AMPARs (data not shown) or probability of release assessed by measuring the paired-pulse facilitation ratio of evoked AMPAR-EPSCs with interspike intervals of 50–100 ms (1.6 ± 0.8 vs 1.7 ± 0.1 before and after NVP application, respectively, n = 8, p = 0.49). Thus in adult CA1 synapses, the efficacy and selectivity of NVP were high enough to pharmacologically modulate the relative contribution of synaptic NMDAR subtypes by preferentially blocking a major component of NR2A-NMDARs.
Figure 2.
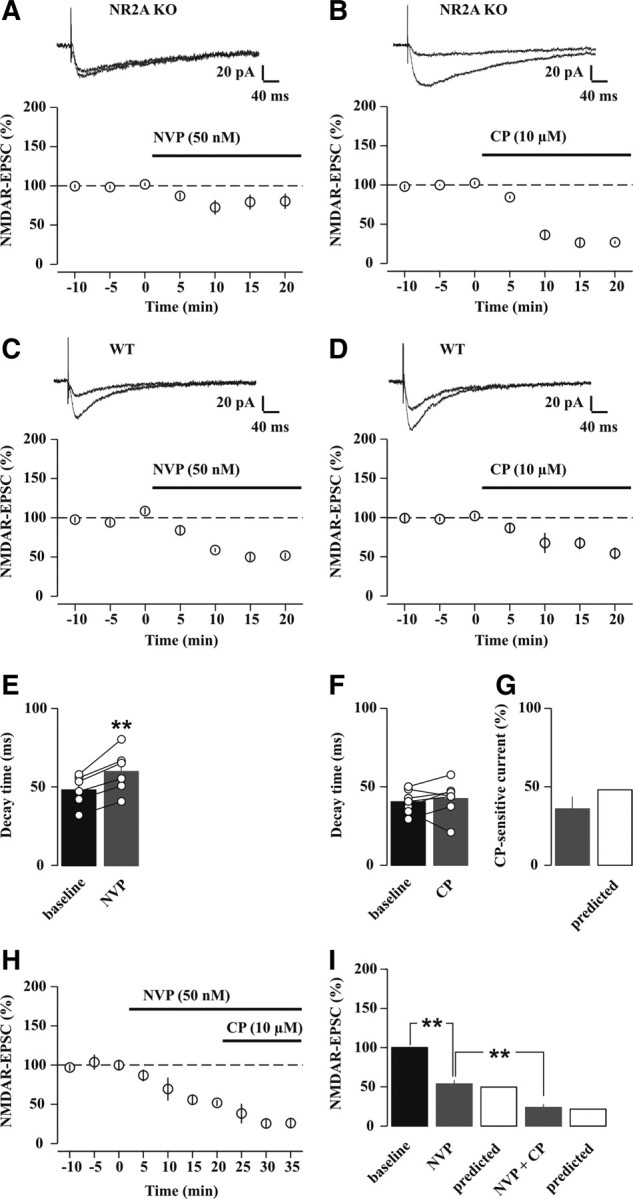
Effects of NVP (50 nm), a preferential NR2A-NMDAR antagonist, and CP (10 μm), a selective NR2B-NMDAR antagonist, on synaptically evoked NMDAR-EPSCs at adult CA3-CA1 synapses. A, B, Time course of average NMDAR-EPSC amplitudes (percentage of baseline) before and during application of 50 nm NVP, (A, n = 9, p = 0.05, paired t test) or 10 μm CP, (B, n = 6, p < 0.0001, paired t test) in slices from NR2A KO mice. For plots, data were binned at 5 min intervals. Averaged sample traces (mean of 10–30 consecutive sweeps) are shown on top. C, D, Time course of average NMDAR-EPSC amplitudes (percentage of baseline) before and during application of 50 nm NVP (C, n = 6, p < 0.0005, paired t test) or 10 μm CP (D; n = 7, p < 0.005, paired t test) in slices from WT mice. Averaged sample traces are shown on top. E, F, Effect of 50 nm NVP (E) and 10 μm CP (F) on decay time of NMDAR-EPSCs in slices from WT mice. Bars represent mean decay time values, and vertical scatter plots show individual experiments. **p < 0.005 (paired t test). G, Amplitude of the CP-sensitive EPSC (percentage of baseline) in slices from WT mice (gray bar) and predicted amplitude of the NR2B-NMDAR-mediated EPSC (white bar). H, Time course of average NMDAR-EPSC amplitudes (percentage of baseline) before and during application of 50 nm NVP alone and in combination with 10 μm CP in slices from WT mice (n = 5). I, Histograms summarizing the effects of NMDAR antagonists. White bars indicate the predicted actions of NVP alone and in combination with CP (see Materials and Methods). **p < 0.001 (paired t test).
The SD-induced facilitation of LTD induction requires the activation of NR2A-NMDARs
Using NVP and CP, as well as NR2A KO mice, we studied the role of NR2A in CA3-CA1 synaptic plasticity after sleep loss. We focused on stimulation frequencies near the modification threshold (MT) for bidirectional synaptic plasticity, known to strongly influence learning behavior (Bach et al., 1995; Zeng et al., 2001). In control undisturbed mice, a 5 Hz conditioning protocol (see Materials and Methods) left average synaptic strength unaltered, as measured by fEPSP slopes in the CA1 region of the hippocampus (Fig. 3A). When the outcome of n = 39 individual experiments was plotted (Fig. 3B), a spread of data points around the baseline slope was apparent, indicating that LTD or LTP was occasionally induced (∼13% and ∼20% of the total number of experiments, respectively). However, the half-maximal value of the cumulative distribution of fEPSP slopes (percentage of baseline) was close to baseline (95.7 ± 0.8%, slope = 6.3 ± 0.5) (Fig. 3C), confirming that most hippocampal synaptic populations remained unaltered in strength.
Figure 3.

SD unravels an NMDAR-dependent 5 Hz-LTD. A, Time course of average fEPSP slopes (percentage of baseline) before and after a 5 Hz conditioning protocol (900 pulses) in control undisturbed mice (Ctrl; black circles, n = 39) and after SD (white circles, n = 37). For plots, data were binned at 1 min intervals. Persistent change in synaptic strength during the last 10 min of postconditioning was significant for SD (p < 0.0001, paired t test) but not for Ctrl (p = 0.14, paired t test). Averaged sample traces (mean of 30 consecutive sweeps) are shown to the left; these were taken at times indicated by numbers. B, Distribution of fEPSP slopes (percentage of baseline) quantified during the last 10 min of postconditioning for individual Ctrl (n = 39) and SD experiments (n = 37, p < 0.0001, unpaired t test vs Ctrl). Dashed lines are set at 10% change from baseline, the level defined as LTD or LTP induction (see Materials and Methods). C, Cumulative probability curves for long-term changes in fEPSP slope after 5 Hz conditioning in Ctrl (black circles) and SD (white circles). A sigmoidal fit f = a/[1 + exp(−(x − x0)/b)] to the cumulative probability distributions yielded: a = 96.0 ± 1.7, b = 6.3 ± 0.5, x0 = 95.7 ± 0.8 for Ctrl, and a = 97.4 ± 2.7, b = 8.2 ± 0.9, x0 = 77.3 ± 1.1 for SD (p < 0.001, Kolmogorov–Smirnov test). D, Time course of average fEPSP slopes for 5 Hz conditioning experiments in slices from sleep-deprived mice in drug-free conditions (SD; white circles, n = 8, p < 0.0005, paired t test) and in 100 μm d,l-APV (SD_APV, gray circles, n = 6, p = 0.81, paired t test) (p < 0.02 vs SD, unpaired t test). Sample traces are shown to the left, as described in A.
When 5 Hz conditioning of CA1 fEPSPs was applied to slices from sleep-deprived mice, an LTD averaging 84.5 ± 2.5% of baseline fEPSP slope was observed (n = 37, p < 0.0001) (Fig. 3A) that was abolished in the presence of the general NMDAR antagonist d,l-APV (100 μm) (ACSF: 84.2 ± 2.5% of baseline, n = 8, p < 0.0005; d,l-APV: 101.4 ± 5.7% of baseline, n = 6, p = 0.81; p < 0.0005 vs ACSF) (Fig. 3D). Inspection of the results from individual experiments showed a strongly increased probability of observing plasticity (∼68% LTD and 2% LTP, p < 0.0001, χ2 test vs control undisturbed mice) (Fig. 3B). The cumulative distribution curve of the fEPSP slopes after 5 Hz stimulation retained its shape, although the half-maximal value was leftward shifted to 77.3 ± 1.1% (Fig. 3C). Therefore, after SD, 5 Hz conditioning produced a comparable probabilistic spread of synaptic strength, but this was biased in favor of an LTD. Taking these results together, a mild SD resulted in a shift of the MT that favors an NMDAR-dependent LTD at 5 Hz (5 Hz-LTD).
The 5 Hz-LTD in slices from sleep-deprived mice (73.4 ± 3.5% of baseline, n = 4, p < 0.005) was prevented by 50 nm NVP (96.8 ± 3.3% of baseline, n = 7, p = 0.36; p < 0.001 vs ACSF) with only two out of seven experiments inducing an LTD (Fig. 4A). Conversely, 5 Hz-LTD was preserved in 10 μm CP (ACSF: 79.8 ± 5.1% of baseline, n = 11, p < 0.005; CP: 79.1 ± 5.7% of baseline, n = 7, p < 0.02; p = 0.47 vs ACSF) (Fig. 4B). This effect of NVP could be explained by a reset of the MT to control values. Alternatively, however, 5 Hz stimulation could have become subthreshold for LTD induction. To differentiate between these two possibilities, we measured whether a slightly higher stimulation frequency (10 Hz) (see Materials and Methods) favored LTD or LTP. After SD, fEPSPs were potentiated in NVP in response to 10 Hz conditioning (123.2 ± 2.9% of baseline, n = 5, p < 0.01), with LTP observed in five out of five experiments. Together, these data show that a specific blockade of NR2B-NMDARs did not alter 5 Hz-LTD after SD, whereas a preferential attenuation of NR2A-containing receptors by NVP was sufficient to prevent plasticity, likely by reversing the dominant presence of NR2A-NMDARs and resetting the MT to control values.
Figure 4.

Activation of NR2A-NMDARs is required for SD-induced 5 Hz-LTD. A, B, Field EPSP slopes (percentage of baseline) recorded in slices from sleep-deprived mice. A, Top, Sample fEPSP traces, representative for times indicated by numbers, and their superposition. Middle, Time course of average fEPSP slopes for 5 Hz conditioning experiments in drug-free conditions (ACSF, white circles, n = 4) and in 50 nm NVP (gray circles, n = 7). Bottom, Histograms depicting mean values of synaptic strengths (bars), quantified in the last 10 min of postconditioning, with values for individual experiments overlaid (circles connected by lines). Note that 5 Hz-LTD was observed in all the ACSF experiments (**p < 0.005, paired t test), but only in 2 out of 7 experiments after NVP application (p = 0.36, paired t test). B, As A, but the effects of CP (10 μm) on 5 Hz-LTD were tested. 5 Hz-LTD was observed in 8 out of 11 ACSF experiments (**p < 0.005, paired t test) and in 6 out of 7 experiments after CP application (*p < 0.02, paired t test).
Dissociable roles for NMDAR subtypes in hippocampal synaptic plasticity
Previous studies emphasized that it is mainly the relative contribution of NR2A- vs NR2B-NMDARs (NR2A/NR2B ratio) that underlies a sliding MT, which sets the frequency ranges over which LTD and LTP are induced (Yashiro and Philpot, 2008). However, it is unknown whether a similar mechanism could explain the effect of SD in hippocampus. We hence tested how pharmacologically augmenting or decreasing the NR2A/NR2B ratio at synapses from control undisturbed mice affected the MT. Application of CP to increase the NR2A/NR2B ratio augmented the probability of 5 Hz-LTD in slices from control mice (ACSF: 2 out of 15 slices showed an LTD; CP: 7 out of 12 slices showed an LTD, p < 0.03, χ2 test) (Fig. 5A). On average, CP induced a slight, but significant shift of the synaptic strength in response to 5 Hz stimulation toward an LTD (ACSF: 102.3 ± 2.5% of baseline, n = 15, p = 0.38; CP: 89.5 ± 5.4% of baseline, n = 12, p = 0.07; p < 0.02 vs ACSF). In contrast, NVP (50 nm), reducing the NR2A/NR2B ratio, left fEPSPs unaltered (ACSF: 108.0 ± 6.8% of baseline, n = 6, p = 0.29; NVP: 103.7 ± 6.5% of baseline, n = 8, p = 0.58; p = 0.33 vs ACSF) (Fig. 5B). Furthermore, bath application of a low concentration of d,l-APV (11 μm), which nonselectively blocked NMDAR-EPSCs by an extent similar to that of CP and NVP (42% of inhibition, as determined from a concentration-response curve of d,l-APV) (data not shown), yet preserved the balance between NR2A- and NR2B-containinag receptors, did not induce plasticity (ACSF: 102.2 ± 5.9% of baseline, n = 8, p = 0.71; d,l-APV: 98.7 ± 3.2% of baseline, n = 6, p = 0.70; p = 0.30 vs ACSF) (Fig. 5C). The susceptibility of CA1 pyramidal neurons to a 5 Hz pattern of presynaptic activity appeared thus uniquely sensitive to an increase, but not to a decrease, of the NR2A/NR2B ratio. This sensitivity was apparent despite a reduced total receptor number and manifested as an augmented probability for LTD.
Figure 5.

Pharmacologically enhancing the NR2A/NR2B ratio increases the probability to induce 5 Hz-LTD in control undisturbed mice. A–C, Field EPSP slopes recorded in slices from control undisturbed mice. In all figure panels, sample traces and their superposition are shown on the top, time course of 5 Hz conditioning experiments in the middle, and histograms showing mean values and relative changes in individual experiments on the bottom. A, Time course of average fEPSP slopes (percentage of baseline) for 5 Hz conditioning experiments, as recorded in ACSF (black circles and bars, n = 15) and in 10 μm CP (gray circles and bars, n = 12). 5 Hz-LTD was observed in 2 out of 15 experiments in ACSF (p = 0.38, paired t test) and in 7 out of 12 experiments in CP (p = 0.07, paired t test) (#p < 0.02 vs 900 pulses/5 Hz in ACSF, unpaired t test). B, As A, but the effects of 50 nm NVP were tested. 5 Hz-LTD was observed in none of the ACSF experiments (black circles and bars, n = 6, p = 0.29, paired t test) and in 1 out of 8 experiments after NVP application (gray circles and bars, p = 0.58, paired t test). C, As A, but the effects of 11 μm d,l-APV were tested. 5 Hz-LTD was observed in 1 out of 8 experiments in ACSF (black circles and bars, p = 0.71, paired t test) and in 1 out of 6 experiments after d,l-APV application (gray circles and bars, p = 0.70, paired t test).
One concern was that NVP blocks NR2A-NMDARs incompletely and could thus mask a possible leftward shift of the MT through insufficiently decreasing the NR2A/NR2B ratio. Therefore, we examined bidirectional synaptic plasticity at hippocampal CA3-CA1 synapses in NR2A KO mice, which show a dramatic leftward shift of the MT in visual cortex (Philpot et al., 2007). Surprisingly, the absence of the NR2A subunit protein did neither alter the susceptibility of CA1 pyramidal neurons to a 5 Hz conditioning pattern (WT: 100.7 ± 7.1% of baseline, n = 9, p = 0.92; NR2A KO: 95.0 ± 6.3% of baseline, n = 12, p = 0.35; p = 0.36 vs WT) (Fig. 6A) nor the probability of observing plasticity (∼33% LTD and 25% LTP, p = 0.20, χ2 test vs control undisturbed WT mice) (Fig. 6D). Moreover, at these synapses, both LTD and LTP could be induced by low and high frequencies of stimulation, respectively (1 Hz low-frequency stimulation: 85.4 ± 4.9% of baseline, n = 6, p < 0.03; 100 Hz high-frequency stimulation: 147.9 ± 5.1% of baseline, n = 6, p < 0.001) (Fig. 6B, C), with 5 Hz still representing the MT (Fig. 6E). In the adult hippocampus, NR2B-NMDARs are thus competent for inducing both LTP (Sakimura et al., 1995; Kiyama et al., 1998) and LTD, but they do not control the location of the MT along the frequency axis. In conclusion, the role of NR2A-NMDARs in controlling the MT of CA1 is dissociated from that of NR2B-NMDARs.
Figure 6.

In NR2A KO mice, 5 Hz plasticity is unaltered in undisturbed conditions, and bidirectional synaptic plasticity is no longer sensitive to SD. A, Time course of average fEPSP slopes before and after a 5 Hz conditioning protocol in WT (black circles, n = 9), control undisturbed NR2A KO (gray circles, n = 12) and sleep-deprived NR2A KO mice (SD_NR2A KO, white circles, n = 9). Representative traces are shown to the left. B, Time course of average fEPSP slopes (percentage of baseline) before and after a 1 Hz conditioning protocol (900 pulses) in control undisturbed NR2A KO mice (n = 6, p < 0.03, paired t test) and after SD (n = 7, p < 0.001, paired t test). C, Time course of average fEPSP slopes (percentage of baseline) before and after a 100 Hz conditioning protocol (two 1 s pulses at 100 Hz separated by 30 s) in control undisturbed NR2A KO mice (n = 6, p < 0.001, paired t test) and after SD (n = 6, p < 0.02, paired t test). D, Summary data showing the distribution of synaptic strengths for individual experiments (percentage of baseline) in the last 10 min of postconditioning after 5 Hz stimulation. Same color code as A. The lower and upper horizontal dashed lines are set at 10% change, the level for LTD and LTP induction. E, Frequency dependence of bidirectional synaptic plasticity in control undisturbed (gray circles) and sleep-deprived (white circles) NR2A KO mice. Note that bidirectional synaptic plasticity in NR2A KO mice was insensitive to sleep loss and that the MT lay at 5 Hz, similar to the value in WT.
Obligatory role for NR2A-NMDARs in the SD effects on the MT
The importance of NR2A-NMDARs in setting the MT predicted that the NR2A subunits were indispensable for the SD-induced shift of hippocampal MT. Accordingly, we tested the impact of SD on NR2A KO mouse behavior and plasticity. Previous electroencephalographic recordings showed unaltered slow-wave sleep duration and intensity in these mice (Miyamoto et al., 2003). We found that NR2A KO mice were well entrained to the light-dark cycle and showed an amount of resting time comparable to that of WT littermates that were monitored in the same session (Fig. 7A) (see Materials and Methods). The duration of SD, which is determined by the spontaneous behavior of the animals, was equal for NR2A KO (5.0 ± 0.2 h; n = 9) and WT littermates (4.6 ± 0.4 h; n = 6; p = 0.30). The level of activity, expressed as mean distance traveled per hour of SD, was also comparable (NR2A KO: 108.0 ± 6.6 m/h; WT: 112.8 ± 6.7 m/h, p = 0.63) (Fig. 7B). Once mice fell asleep, they were left completely undisturbed and resting time over the recovery period was monitored. Both sleep-deprived WT and NR2A KO mice showed enhanced resting time during the first hours of recovery compared with their own baseline rest (WT: hour 1, p < 0.02; hour 2, p = 0.26; hour 3, p = 0.39; NR2A KO: hour 1, p < 0.03; hour 2, p < 0.03; hour 3, p = 0.08) (Fig. 7C, D). Moreover, the total resting time during the recovery period was not different between WT and NR2A KO mice (p > 0.1), consistent with a comparable amount of recovery. Next, we measured the impact of SD on bidirectional synaptic plasticity in slices prepared from NR2A KO mice. SD did not unravel a 5 Hz-LTD (97.5 ± 4.4% of baseline, n = 9, p = 0.58; p = 0.76 vs NR2A KO in undisturbed conditions) (Fig. 6A, D). Moreover, 1 Hz-LTD and 100 Hz-LTP levels in sleep-deprived NR2A KO mice were similar to those of control undisturbed littermates (1 Hz low-frequency stimulation: 84.2 ± 3.8% of baseline, n = 7, p < 0.001; p = 0.85 vs NR2A KO in undisturbed conditions; 100 Hz high-frequency stimulation: 140.9 ± 10.5% of baseline, n = 6, p < 0.02; p = 0.56 vs NR2A KO in undisturbed conditions) (Fig. 6B, C). Therefore, the NR2A subunit is both necessary and sufficient for shifting the MT, and its deletion renders CA3 to CA1 bidirectional synaptic plasticity insensitive to SD (Fig. 6E). In contrast, genetic removal of NR2A did not prevent behavioral compensatory processes of sleep homeostasis, such as increased rest after SD (Kapfhamer et al., 2002; Kopp et al., 2006).
Figure 7.

NR2A KO mice show largely preserved behavioral response to SD. A, Hourly time course of home-cage resting behavior (percentage of recording time) during an undisturbed 24 h baseline in WT (black circles, n = 6) and NR2A KO (gray circles, n = 9) mice. The black bar at the top indicates the 12 h dark period of the light/dark cycle. B, Locomotor activity of WT and NR2A KO mice during the SD procedure, expressed as distance traveled in meters per unit of recording time (15 min). C, D, Resting time (percentage of recording time) during the recovery period after SD (white circles) and during baseline conditions in WT (C, black circles) and NR2A KO (D, gray circles) mice. *p < 0.05 (paired t test vs baseline conditions).
Elevated NR2A-NMDAR synaptic content alters the temporal profile of NMDAR-EPSC summation
CA3-CA1 hippocampal synaptic plasticity requires the repetitive activation of NMDARs. The characteristics of the corresponding temporally summated currents have been proposed to set the direction of synaptic plasticity (Philpot et al., 2001; Popescu et al., 2004; Erreger et al., 2005).
To define the role of NR2A-NMDARs during 5 Hz stimulation, we tracked NMDAR subtype activation during temporal summation of NMDAR-EPSCs by applying 5 Hz trains of stimuli (see Materials and Methods) (Fig. 8A). Pulse number was limited to 50, because all characteristics of summated responses stabilized at a steady-state level. Summated NMDAR-mediated currents showed two distinct components (Fig. 8B, C). A phasic current remained fairly constant during the train, except for a short-term depression at train onset. A persistent current started from the first stimulus but then increased gradually, reaching a steady-state after ∼20 stimuli (last 10 pulses average: 0.41 ± 0.20 when normalized to the first peak amplitude, n = 34). A slowly decaying current, which we are referring to as tail current, was observed at the end of the 5 Hz train of stimuli. In CP, minimizing NR2B-NMDAR contribution, total EPSC summation was moderately altered compared with drug-free recordings (last 10 pulses average in ACSF: 1.39 ± 0.13 of the first peak; CP: 1.24 ± 0.12, n = 9; p < 0.03) (Fig. 8D), whereas the persistent current component was clearly reduced (last 10 pulses average in ACSF: 0.44 ± 0.05 of the first peak; CP: 0.29 ± 0.04, n = 9; p < 0.0002). CP did not affect phasic NMDAR-EPSCs (second pulse/first pulse in ACSF: 0.81 ± 0.08; CP: 0.71 ± 0.06, n = 9; p = 0.11; last 10 pulses average in ACSF: 0.95 ± 0.09 of the first peak; CP: 0.95 ± 0.10, n = 9; p = 0.96). To study NR2B-NMDAR function, temporal summation of NMDAR-EPSCs was addressed in slices from NR2A KO mice (Fig. 8E). Here, persistent current components were >2-fold greater (last 10 pulses average: 0.92 ± 0.04 of the first peak, n = 11; p < 0.0001 vs WT), and total current summation strongly augmented (last 10 pulses average: 1.81 ± 0.07 of the first peak, n = 11; p < 0.0005 vs WT). The profile of phasic current components remained unaffected (second pulse/first pulse: 0.87 ± 0.04; last 10 pulses average: 0.89 ± 0.04 of the first peak, n = 11; p = 0.58 vs WT).
Across the two extremes of predominantly NR2A- to exclusively NR2B-containing synapses, the persistent current component of summated NMDAR-EPSCs was most sensitively regulated by the NR2A/NR2B ratio. A plot of the normalized persistent current amplitudes against the relative contribution of the NMDAR subtypes yielded a nonlinear relation between these two parameters, whereas phasic current components were independent of NMDAR subtype content (Fig. 8F).
This relation was used to predict the NR2A/NR2B ratio at CA1 synapses after SD. Total temporal summation remained unaffected compared with control undisturbed mice (last 10 min average in sleep-deprived mice: 1.37 ± 0.11 of the first peak, n = 16; control mice: 1.38 ± 0.09, n = 18; p = 0.96), but the contribution of the persistent current component was reduced to 78% of control undisturbed animals (last 10 pulses average, p < 0.03 vs control mice) (Fig. 8G), yielding an NR2A/NR2B ratio of ∼1.8 (64% and 36% for NR2A- and NR2B-containing receptors, respectively) (Fig. 8F). This value is in excellent agreement with that obtained from EM (NR2A/NR2B ratio of ∼1.6), strongly suggesting that the enriched NR2A proteins were integrated into functional NMDARs.
SD does not affect AMPAR-mediated responses evoked by 5 Hz stimulation trains
Experience-dependent changes in short-term plasticity of glutamatergic synaptic transmission have been described (Finnerty et al., 1999; Yashiro et al., 2005). To study the possible impact of SD on CA3 to CA1 short-term plasticity during near-threshold repetitive stimulation, we tracked the behavior of AMPAR-EPSCs in response to 5 Hz trains of 50 pulses (see Materials and Methods). In control undisturbed WT animals, AMPAR-mediated current amplitudes showed a minor paired-pulse facilitation (second pulse/first pulse: 1.13 ± 0.05, n = 10, p < 0.04) (Fig. 9), then progressively decreased, eventually reaching levels equal to those of the first pulse (last 10 pulses average: 0.95 ± 0.09 of the first peak, n = 10, p = 0.62). The behavior of AMPAR-EPSCs during 5 Hz repetitive stimulation was unaltered after SD (second pulse/first pulse: 1.00 ± 0.05, n = 11; p = 0.09 vs control mice; last 10 pulses average: 0.99 ± 0.14 of the first peak, n = 11, p = 0.78 vs control mice) (Fig. 9). These data indicate that the temporal profile of AMPAR-EPSC summation in response to 5 Hz stimulation was not altered by SD and argue against major alterations in presynaptic release characteristics.
SD alters the balanced activation of synaptically located NR2A-NMDARs and of slowly recruited NR2B-NMDARs during repeated 5 Hz stimulation
The mechanistic basis rendering persistent currents exquisitely sensitive to the NR2A/NR2B ratio and to SD was next addressed. Synaptic current components accruing during repetitive stimulation could arise from incomplete decay of NMDAR-EPSCs, thereby boosting slowly decaying (NR2B-type) EPSC components (Popescu et al., 2004; Erreger et al., 2005). Furthermore, recruitment of receptors located more distantly from the glutamate source could account for slowly rising NMDAR currents (Diamond, 2001; Arnth-Jensen et al., 2002; Lozovaya et al., 2004; Harris and Pettit, 2008). To study the role of current decay, the persistent current resulting from linear summation of NMDAR-EPSCs was calculated. A linear superposition of exponential fits to the decay of NMDAR-EPSCs recorded in a subset of experiments (WT, n = 8; NR2A KO, n = 8; see Materials and Methods) yielded a persistent current at the end of the train that equaled 0.18 ± 0.03 and 0.48 ± 0.02 of the amplitude of the first NMDAR-EPSC for WT and NR2A KO, respectively (Fig. 10A, B). These values were markedly smaller than those measured experimentally (last 10 pulses average in WT: 0.43 ± 0.04 of the first peak, p < 0.005 vs linear summation; NR2A KO: 0.88 ± 0.05, p < 0.0002 vs linear summation; n = 8 each) (Fig. 10A, B). Reaction rate models of NMDAR subtypes (Popescu, 2005) (S. A. Amico-Rubio and G. K. Popescu, unpublished data) (Fig. 10C) were next used to model the behavior of NMDAR-mediated currents (see Materials and Methods). In response to a single glutamate pulse, the NR2A- and NR2B-NMDAR reaction schemes generated 44.0% and 56.0% of an NMDAR-EPSC, respectively. These values are in reasonable agreement with those obtained experimentally (NR2A-NMDAR, 52%; NR2B-NMDAR, 48%) (Fig. 2). However, these models did not reproduce NMDAR-mediated currents arising from 5 Hz trains of glutamate pulses (Fig. 10D–F). The NR2A-NMDAR model generated a negligible persistent current (Fig. 10D), whereas the NR2B-NMDAR model gave rise to an instantaneous, step-like, persistent current (Fig. 10E) that was comparable to that predicted by linear summation of decay kinetics of NMDAR-EPSCs recorded in NR2A KO mice (Fig. 10B). When the responses of receptor subtypes were added at the experimentally determined ratio (52% and 48% for NR2A- and NR2B-NMDARs, respectively), a minor and time-invariant persistent current was obtained (Fig. 10F). These findings indicate that incomplete current decay could neither account for extent nor gradual nature of persistent currents in the 5 Hz train.
Figure 10.

Linear summation of NMDAR-EPSCs and computational models of NMDAR subtypes do not reproduce slowly rising persistent currents during 5 Hz stimulation. A, B, Summation of biexponential fits of NMDAR-EPSC decay times, scaled according to the amplitudes of experimentally measured phasic currents for WT (A) and NR2A KO (B) mice. Top traces represent experimentally measured currents, middle trace linear summation of NMDAR-EPSC exponential fits, and bottom traces the superposition of the two. Time plots present the temporal summation of persistent currents measured from experimental traces (filled circles) and from linearly summated decay of NMDAR-EPSCs (open circles). *p < 0.005 (paired t test). C, Reaction models of NR2A- and NR2B-NMDARs according to Popescu [Popescu (2005) and S. A. Amico-Rubio and G. K. Popescu, unpublished data]. Two glutamate binding steps (B1, B2) are followed by three sequential closed states (C1–C3) before receptor opening (O1, O2). Closed state inactivation (C4, C5) is also included in the model. Reaction rates are in s−1 with the exception of the forward rates between B1, B2, and C3, which are in m−1s−1. D–F, Current responses of reaction models of NR2A- and NR2B-containing NMDARs to repeated 5 Hz glutamate transients. Note the complete lack of a persistent current for NR2A-NMDARs (D), and the instantaneous presence of a slow persistent current for NR2B (E) and for the sum of the two receptor subtypes (F).
We thus evaluated the possibility that additional receptor pools accessible by the released glutamate, but recruited on slower time scales, could contribute to the persistent current. First, the pharmacological profile of current components over the course of a train was assessed (Fig. 11A). The effect of CP on the phasic current amplitudes remained stable during the train (first pulse: 43.2 ± 4.7% of inhibition; last 10 pulses average: 40.7 ± 6.5% of inhibition, n = 9, p = 0.53) (Fig. 11A, B), but persistent currents displayed a linearly increasing sensitivity to CP (first pulse: 42.6 ± 7.0% of inhibition; last 10 pulses average: 63.8 ± 3.7% of inhibition, p < 0.03; p < 0.02 vs inhibition of phasic current). This incremental difference (Fig. 11A–C) pointed to a gradual recruitment of NR2B-NMDARs that specifically contributed to the late component of each pulse. Second, the stimulation train was followed by a tail current (Fig. 11D) and (Lozovaya et al., 2004), which reflects the decay of NMDARs activated by the glutamate accumulated during the train, including those contributing to the persistent current. The tail current decayed more slowly than NMDAR-EPSCs (decay time: single pulse, 71.6 ± 2.7 ms; tail current, 180.7 ± 5.3 ms, n = 34, p < 0.0001) (Fig. 11D) and was markedly accelerated by CP (decay time of tail current: ACSF, 175.8 ± 7.3 ms; CP, 92.6 ± 12.6 ms, n = 6, p < 0.002) (Fig. 11E). Therefore, NR2B-NMDARs dominated tail current properties. Third, we exploited the effects of the low-affinity competitive NMDAR antagonist d-aminoadipic acid (d-AA), whose efficacy depends on the glutamate concentration (Clements et al., 1992; Diamond, 2001). d-AA (70 μm) reduced both amplitude (ACSF: 127.8 ± 11.6 pA; d-AA: 59.2 ± 5.5 pA, n = 7, p < 0.001) and decay time (ACSF: 83.2 ± 3.4 ms; d-AA: 60.1 ± 4.5 ms, n = 7, p < 0.001) (Fig. 11F) of NMDAR-EPSCs evoked by a single synaptic response, consistent with the idea that NMDARs activated by small, slow glutamate transients contributed to the late component of NMDAR-EPSCs (Diamond, 2001). d-AA reduced tail current amplitudes by the same extent as NMDAR-EPSCs (single pulse: 52.7 ± 4.8% of inhibition; tail current: 55.5 ± 7.4% of inhibition, n = 6, p = 0.58), but it no longer affected decay time (ACSF: 193.4 ± 7.4 ms; d-AA: 186.3 ± 5.0 ms, n = 6, p = 0.41) (Fig. 11G). This suggests that 5 Hz repetitive stimulation produced a more homogeneous profile of glutamate levels across different populations of NMDARs recruited during the train, enforcing in particular the contribution of NR2B-NMDARs involved in the generation of persistent currents.
Figure 11.

NMDAR pools recruited on distinct time scales contribute to temporal summation of NMDAR-EPSCs. A–G, All data in this figure were collected in slices from control undisturbed WT mice. A–C, The effects of CP on persistent, but not on phasic currents, increase in the course of the train. A, Top, Sample traces represent sections of the first and last parts of the train in drug-free conditions (ACSF, black trace) and in CP (gray trace). The horizontal dashed line indicates the baseline holding current before the stimulation. Bottom, Amplitudes (in pA) of the total (upper panel), persistent (middle panel) and phasic (lower panel) currents in ACSF (black circles) and after bath application of 10 μm CP (gray circles) (n = 9). Bar charts to the right of each time plot represent steady-state amplitudes (average of responses to the last 10 pulses). Amplitudes of total, persistent and phasic currents were all significantly reduced by CP (**p < 0.005, paired t test). The percentage inhibition by CP is indicated above each bar chart. Note that absolute current values are given in the plot rendering effects of CP evident on all current components. B, CP-mediated inhibition of the phasic current component versus pulse number in the train. C, CP-mediated inhibition of the persistent current in the course of the train, expressed as the difference from the percentage inhibition of the phasic current. A linear fit (y = y0 + ax) to the values yielded: y0 = 9.3 ± 0.7%, a = 0.24 ± 0.03% (black line), with r = 0.79. D, Top left, Representative NMDAR-EPSC (Single pulse). Top right, The first EPSC (first pulse) and the tail current (50th pulse) of the 5 Hz train. Decay times are indicated next to the traces. Scaled traces are shown superimposed below. Bar chart depicts average decay times of NMDAR-EPSCs (Single) and tail currents (Train) recorded in the same cells (n = 34; **p < 0.0001, paired t test). E, Effects of CP on tail current decay time. Sample scaled traces of NMDAR-currents are shown superimposed (ACSF, black trace; CP, gray trace). Bars denote mean decay time values and vertical scatter plot depicts data from individual experiments (n = 6). **p < 0.0001 (paired t test vs Single); #p < 0.002 (paired t test vs Train). F, Effect of d-AA (70 μm), a low-affinity competitive NMDAR antagonist, on decay time of NMDAR-EPSCs (Single). Superimposed traces are shown to the left (ACSF, black trace; d-AA, gray trace), bars representing mean decay time values, and vertical scatter plot showing individual experiments (n = 7) are superimposed on the right. **p < 0.01 (paired t test vs Single). G, Effect of d-AA (70 μm) on decay time of tail currents (Train). Superimposed traces are shown to the left, bars representative of mean decay time values and vertical scatter plot from individual experiments (n = 6) are superimposed on the right. **p < 0.0001 (paired t test vs Single).
When these experiments were repeated in sleep-deprived mice, it became clear that SD altered the balance of receptor subtypes recruited into the train response. First, the effect of CP on the persistent current components of the train was now comparable to that of phasic components (last 10 pulses average persistent current: 35.6 ± 9.2% of inhibition; phasic current: 30.5 ± 8.5%, n = 9, p = 0.39) (Fig. 12A), and was lower compared with control mice (p < 0.02). Second, tail currents at the end of the train were strongly accelerated compared with control (SD: 136.2 ± 8.6 ms, n = 14; control: 179.2 ± 5.8 ms, n = 13, p < 0.0005) (Fig. 12B), consistent with an enhanced NR2A contribution. Third, decay kinetics of tail currents had largely lost CP sensitivity (ACSF: 136.2 ± 11.4 ms; CP: 129.6 ± 14.4 ms, n = 7, p = 0.60) (Fig. 12C). We conclude that SD altered the properties of these summated currents by attenuating the incremental involvement of NR2B-NMDARs during repeated stimulation, while increasing the contribution of NR2A-NMDARs.
Figure 12.

SD disrupts the balanced recruitment of NMDAR pools during 5 Hz repetitive stimulation. A, Top, Sample traces represent sections of the first and last parts of the train in drug-free conditions (ACSF, black trace) and in CP (gray trace) obtained from sleep-deprived mice. The horizontal dashed line indicates the baseline value of the holding current before the stimulation protocol was applied. Bottom, Amplitudes (in pA) of the total (upper panel), persistent (middle panel) and phasic (lower panel) currents in ACSF (white circles) and after bath application of 10 μm CP (gray circles) in n = 9 sleep-deprived WT mice. Bar charts to the right of each time plot represent steady-state amplitudes (average of responses to the last 10 pulses). Amplitudes of total, persistent and phasic currents were all significantly reduced by CP (*p < 0.05, paired t test). The percentage inhibition by CP is indicated above each bar chart. B, Top left, Representative NMDAR-EPSC (Single pulse). Top right, The first EPSC of the 5 Hz train (first pulse), and the tail current (50th pulse) recorded in the same cell for each condition, with decay times indicated next to the traces. Scaled traces from control undisturbed (Ctrl) and from sleep-deprived mice (SD) are shown superimposed. Bar chart depicts average decay times in Ctrl (black bars, n = 13) and after SD (white bars, n = 14). **p < 0.0001 (paired t test vs Ctrl Single); #p < 0.0005 (unpaired t test vs Ctrl Train). C, Effects of CP on tail current decay time in slices from sleep-deprived mice. Sample scaled traces are shown superimposed (ACSF, black trace; CP, gray trace). Bars denote mean decay time values and vertical scatter plot depicts data from individual experiments (n = 7). **p < 0.001 (paired t test vs Single).
Discussion
We demonstrate here that the NR2A subunit of NMDARs is indispensable for the effects of a mild SD on hippocampal synaptic plasticity in the theta stimulation range. Conversely, its ablation renders hippocampal plasticity unresponsive to sleep loss. This function of NR2A is caused by its selective enrichment at postsynaptic densities of adult hippocampal synapses. The dominance of NR2A-NMDARs interferes with the recruitment of different receptor pools during repeated glutamate release. The results indicate that altered trafficking of NR2A subunits in hippocampus is a mechanistic link between sleep loss and cellular correlates of learning and memory. Notably, rightward shifts in the MT, and in particular the appearance of LTD in the range of the theta rhythm, have been linked to an impairment of spatial reference memory (Bach et al., 1995; Migaud et al., 1998) and could hence underlie some of the detrimental effects of sleep loss on cognitive abilities (Graves et al., 2003). Conversely, spatial reference memory is unaffected in NR2A KO mice (Bannerman et al., 2008), consistent with the preserved hippocampal MT. Finally, the largely unaltered sleep-wake behavior in NR2A KO mice suggests that the NR2A subunit is not a primary determinant of post-deprivation sleep behavior. The consequences of sleep loss on hippocampal synaptic plasticity appear thus conveyed through mechanisms distinct from those underlying sleep homeostasis.
Specific and rapid enrichment of NR2A synaptic content after SD
The alteration in NMDA receptor subunit composition after sleep loss is unique in specificity, restricted subcellular localization and rapid onset compared with other examples of NMDAR regulation through experience (Quinlan et al., 2004; Yashiro et al., 2005; Chen and Bear, 2007). EM revealed that SD effects were confined to a single NMDAR subtype, provoking a selective increase of NR2A expression by 1.6-fold, while not affecting synapse size. This value is in agreement with that derived from studying temporal summation of NMDAR-EPSCs, strongly suggesting that the newly inserted protein was integrated into physiologically functional receptors. Although, the multiplicity of sleep loss effects on proteins involved in neuronal function (Cirelli, 2006; Vyazovskiy et al., 2008) does not exclude additional alterations downstream of or in parallel to NMDARs, we demonstrate here that the dominant effects of sleep loss on synaptic plasticity were obligatorily conveyed through the regulation of NR2A synaptic content.
Specific control of the hippocampal plasticity threshold through NR2A-NMDARs
The impact of experience-dependent increases in NR2A expression on hippocampal bidirectional synaptic plasticity is, at first glance, congruent with that described previously in visual cortex (Kirkwood et al., 1996; Philpot et al., 2001, 2007), including the shift of the MT toward higher frequencies and the preserved dynamic range of plasticity, delineated by the magnitude of the expressed LTD and LTP (Kirkwood et al., 1996; Philpot et al., 2001, 2007; Kopp et al., 2006).
Nevertheless, the role of NMDAR subtypes in hippocampal synaptic plasticity displayed features most distinctive from plasticity in developing visual cortex, but also from mature cortex (Quinlan et al., 2004). Most strikingly, neither partial block nor genetic deletion of the NR2A-NMDARs affected the MT of hippocampal bidirectional synaptic plasticity, in contrast to the extreme leftward shift observed in visual cortex of NR2A KO mice (Philpot et al., 2007). An important caveat in this comparison is the fact that the NMDAR component of CA1 synaptic responses appears to be reduced both in young and adult NR2A KO mice (Sakimura et al., 1995; Ito et al., 1996), whereas it is unaltered in visual cortex (Fagiolini et al., 2003). This could attenuate NMDAR-dependent hippocampal plasticity and thus obscure an NR2B dependence of the MT position. Several experimental observations argue against this possibility. First, LTD amplitudes at 1 Hz were unaltered in the NR2A KO mice (Fig. 6B). Moreover, the probabilities of inducing LTD or LTP after 5 Hz conditioning remained at control levels (Fig. 6D), indicating that the reduced NMDA receptor component at CA1 synapses did not compromise plasticity at low stimulation frequencies. Furthermore, overexpression of NR2B only weakly shifted the hippocampal MT to the left (Tang et al., 1999). Altogether, in adult mice, the hippocampal MT appears largely independent of the dominant or exclusive presence of NR2B-NMDARs. However, it showed a clear rightward shift once NR2A/NR2B substantially >1 (NR2A/NR2B ∼1.6 in the case of SD). As a corollary, the well documented hypothesis of a bidirectionally sliding MT, determined by a graded dependence on the NR2A/NR2B ratio in visual cortex (Philpot et al., 2001; Yashiro and Philpot, 2008), does not seem to hold for CA3 to CA1 MT, which instead shifts in a unidirectional manner. Our observations thus suggest that distinctive functional coupling of NR2A-NMDARs to LTD-promoting mechanisms at near-threshold frequencies, and a specific antagonism of these through NR2B-NMDARs, needs to be implemented to account for the unidirectional shift of hippocampal MT. Such subtype-specific actions have been described in the context of NMDAR-dependent activation of Ras-Erk signaling (Kim et al., 2005), recruitment of protein phosphatases (Thomas et al., 1996), or CaMKII binding (Barria and Malinow, 2005).
Involvement of functionally different NMDAR populations in temporal summation of NMDAR-EPSCs
Changes in the NR2A/NR2B ratio and associated alterations in current decay kinetics have been previously shown to alter temporal summation of NMDAR-EPSCs at frequencies >40 Hz (Philpot et al., 2001). Here, the temporal summation of NMDAR-EPSCs induced by a near-threshold frequency of stimulation could not be explained via a linear summation of current decay, as evident using superposition of exponential fits or repeated activation of kinetic reaction schemes for NMDARs. Instead, we found that alterations in the NR2A/NR2B ratio achieved following SD, but also pharmacologically or genetically, sensitively affected a persistent current component that slowly accrued during repeated stimulation to levels greater than those expected from linear summation and that was predominantly carried by NR2B-containing receptors.
Slowly rising NMDAR-currents can result from delayed activation of NMDARs by gradually rising glutamate levels at peri- and extrasynaptic sites (Arnth-Jensen et al., 2002; Scimemi et al., 2004), and can be recruited even at low stimulation rates via intersynaptic cross talk (Diamond, 2001; Scimemi et al., 2004). Here, the late component of NMDAR-EPSCs was mediated by NMDARs activated by a low glutamate level because it could be blocked by the low-affinity NMDAR antagonist d-AA. However, the prolonged decay kinetics of the tail current were d-AA-insensitive, suggesting that 5 Hz repetitive stimulation enforced a delayed recruitment of NMDARs through augmenting the amount of glutamate at their sites. The comparatively greater contribution of NR2B-NMDAR subtypes to persistent currents could be explained by a number of mechanisms. First, NR2B-NMDARs possess a higher sensitivity to glutamate compared with NR2A-NMDARs, suggesting that they could be preferentially recruited by slowly rising, low glutamate levels (Kutsuwada et al., 1992). Second, NR2B-containing receptors could be more accessible to glutamate escaped from the cleft, i.e., because of a higher presence at peri/extrasynaptic sites (Köhr, 2006). Finally, intersynaptic cross talk could involve small spines where NR2B receptors are preferentially expressed (Sobczyk et al., 2005). Consequently, a disrupted balance in favor of synaptic NR2A- over NR2B-containing receptors, such as that induced by SD, could substantially alter the contribution of those subtypes to synaptic currents, reduce the development of the persistent currents and result in a dominance of NR2A-NMDAR-dependent effects on synaptic plasticity.
Conclusions
This study offers a mechanistically elaborated link between NR2A, a molecular correlate of sleep loss, and its role in the susceptibility of synaptic plasticity to SD. It also provides the basis for further research on the link between sleep and learning by showing that important determinants of hippocampal synaptic plasticity can be rendered insensitive to sleep loss through ablating NR2A or by pharmacologically attenuating NR2A-NMDAR activation. For example, a next important step will be to test whether hippocampally driven forms of learning that are NR2A-dependent (Bannerman et al., 2008) could be selectively vulnerable to SD, whereas NR2A-independent learning paradigms remain relatively unaffected.
Our study integrates into a series of reports documenting that SD affects expression and function of neurotransmitter receptors in brain areas implicated in the control of waking, attention and cognition (Grivel et al., 2005; Modirrousta et al., 2007). An important aspect of sleep's beneficial functions could hence consist in maintaining and regulating protein redistribution and ion channel trafficking at central synapses (Longordo et al., 2009). In the case of hippocampal synapses, we propose that sleep could help to ensure or reset a synaptic NR2A/NR2B ratio that guarantees maximal flexibility of synapses in response to plasticity-promoting stimuli.
Footnotes
This work was supported by grants from the Swiss National Science Foundation to A.L. (No. 3100A0-116006) and from the Consejería de Educación y Ciencia, Junta de Comunidades de Castilla-La Mancha (PAI08-0174-6967) to R.L. A.L. was supported by the Prof. Dr. Max Cloetta Foundation. The monoclonal anti-NR2B glutamate receptor antibody (NeuroMab clone N59/20) was obtained from the University of California, Davis/National Institutes of Health (NIH) NeuroMab Facility, supported by NIH Grant U24NS050606 and maintained by the Department of Neurobiology, Physiology and Behavior, College of Biological Sciences, University of California, Davis (Davis, CA). We thank Dr. Delpire for making the NR2A-knock-out mice available to us. We are indebted to Prof. G. K. Popescu for providing us with the reaction rate models of NR2A- and NR2B-NMDA receptor subtypes. The constructive input of Profs. L. Acsády, M. Scanziani, and K. Vogt in the course of the experiments is greatly appreciated. We thank Prof. U. Gerber and Drs. S. Astori and A. Scimemi for critical reading of this manuscript. Dr. Y. Auberson (Novartis, Basel) kindly provided us with the NVP-AAM077. CP-101,606 was made available through Pfizer (Groton, CT). We thank C. Haeberli for excellent technical assistance.
The authors declare no conflict of interest.
References
- Al-Hallaq RA, Conrads TP, Veenstra TD, Wenthold RJ. NMDA di-heteromeric receptor populations and associated proteins in rat hippocampus. J Neurosci. 2007;27:8334–8343. doi: 10.1523/JNEUROSCI.2155-07.2007. [DOI] [PMC free article] [PubMed] [Google Scholar]
- Arnth-Jensen N, Jabaudon D, Scanziani M. Cooperation between independent hippocampal synapses is controlled by glutamate uptake. Nat Neurosci. 2002;5:325–331. doi: 10.1038/nn825. [DOI] [PubMed] [Google Scholar]
- Bach ME, Hawkins RD, Osman M, Kandel ER, Mayford M. Impairment of spatial but not contextual memory in CaMKII mutant mice with a selective loss of hippocampal LTP in the range of the theta frequency. Cell. 1995;81:905–915. doi: 10.1016/0092-8674(95)90010-1. [DOI] [PubMed] [Google Scholar]
- Bannerman DM, Niewoehner B, Lyon L, Romberg C, Schmitt WB, Taylor A, Sanderson DJ, Cottam J, Sprengel R, Seeburg PH, Köhr G, Rawlins JN. NMDA receptor subunit NR2A is required for rapidly acquired spatial working memory but not incremental spatial reference memory. J Neurosci. 2008;28:3623–3630. doi: 10.1523/JNEUROSCI.3639-07.2008. [DOI] [PMC free article] [PubMed] [Google Scholar]
- Barria A, Malinow R. NMDA receptor subunit composition controls synaptic plasticity by regulating binding to CaMKII. Neuron. 2005;48:289–301. doi: 10.1016/j.neuron.2005.08.034. [DOI] [PubMed] [Google Scholar]
- Bartlett TE, Bannister NJ, Collett VJ, Dargan SL, Massey PV, Bortolotto ZA, Fitzjohn SM, Bashir ZI, Collingridge GL, Lodge D. Differential roles of NR2A and NR2B-containing NMDA receptors in LTP and LTD in the CA1 region of two-week old rat hippocampus. Neuropharmacology. 2007;52:60–70. doi: 10.1016/j.neuropharm.2006.07.013. [DOI] [PubMed] [Google Scholar]
- Bellone C, Nicoll RA. Rapid bidirectional switching of synaptic NMDA receptors. Neuron. 2007;55:779–785. doi: 10.1016/j.neuron.2007.07.035. [DOI] [PubMed] [Google Scholar]
- Berberich S, Punnakkal P, Jensen V, Pawlak V, Seeburg PH, Hvalby Ø, Köhr G. Lack of NMDA receptor subtype selectivity for hippocampal long-term potentiation. J Neurosci. 2005;25:6907–6910. doi: 10.1523/JNEUROSCI.1905-05.2005. [DOI] [PMC free article] [PubMed] [Google Scholar]
- Campbell IG, Guinan MJ, Horowitz JM. Sleep deprivation impairs long-term potentiation in rat hippocampal slices. J Neurophysiol. 2002;88:1073–1076. doi: 10.1152/jn.2002.88.2.1073. [DOI] [PubMed] [Google Scholar]
- Chazot PL, Lawrence S, Thompson CL. Studies on the subtype selectivity of CP-101,606: evidence for two classes of NR2B-selective NMDA receptor antagonists. Neuropharmacology. 2002;42:319–324. doi: 10.1016/s0028-3908(01)00191-5. [DOI] [PubMed] [Google Scholar]
- Chen C, Hardy M, Zhang J, LaHoste GJ, Bazan NG. Altered NMDA receptor trafficking contributes to sleep deprivation-induced hippocampal synaptic and cognitive impairments. Biochem Biophys Res Commun. 2006;340:435–440. doi: 10.1016/j.bbrc.2005.12.021. [DOI] [PubMed] [Google Scholar]
- Chen WS, Bear MF. Activity-dependent regulation of NR2B translation contributes to metaplasticity in mouse visual cortex. Neuropharmacology. 2007;52:200–214. doi: 10.1016/j.neuropharm.2006.07.003. [DOI] [PubMed] [Google Scholar]
- Cirelli C. Cellular consequences of sleep deprivation in the brain. Sleep Med Rev. 2006;10:307–321. doi: 10.1016/j.smrv.2006.04.001. [DOI] [PubMed] [Google Scholar]
- Clements JD, Lester RA, Tong G, Jahr CE, Westbrook GL. The time course of glutamate in the synaptic cleft. Science. 1992;258:1498–1501. doi: 10.1126/science.1359647. [DOI] [PubMed] [Google Scholar]
- Cull-Candy SG, Leszkiewicz DN. Role of distinct NMDA receptor subtypes at central synapses. Sci STKE. 2004;2004:re16. doi: 10.1126/stke.2552004re16. [DOI] [PubMed] [Google Scholar]
- Dang-Vu TT, Desseilles M, Peigneux P, Maquet P. A role for sleep in brain plasticity. Pediatr Rehabil. 2006;9:98–118. doi: 10.1080/13638490500138702. [DOI] [PubMed] [Google Scholar]
- Davis CJ, Harding JW, Wright JW. REM sleep deprivation-induced deficits in the latency-to-peak induction and maintenance of long-term potentiation within the CA1 region of the hippocampus. Brain Res. 2003;973:293–297. doi: 10.1016/s0006-8993(03)02508-3. [DOI] [PubMed] [Google Scholar]
- Diamond JS. Neuronal glutamate transporters limit activation of NMDA receptors by neurotransmitter spillover on CA1 pyramidal cells. J Neurosci. 2001;21:8328–8338. doi: 10.1523/JNEUROSCI.21-21-08328.2001. [DOI] [PMC free article] [PubMed] [Google Scholar]
- Diamond JS, Jahr CE. Transporters buffer synaptically released glutamate on a submillisecond time scale. J Neurosci. 1997;17:4672–4687. doi: 10.1523/JNEUROSCI.17-12-04672.1997. [DOI] [PMC free article] [PubMed] [Google Scholar]
- Erreger K, Dravid SM, Banke TG, Wyllie DJ, Traynelis SF. Subunit-specific gating controls rat NR1/NR2A and NR1/NR2B NMDA channel kinetics and synaptic signalling profiles. J Physiol. 2005;563:345–358. doi: 10.1113/jphysiol.2004.080028. [DOI] [PMC free article] [PubMed] [Google Scholar]
- Fagiolini M, Katagiri H, Miyamoto H, Mori H, Grant SG, Mishina M, Hensch TK. Separable features of visual cortical plasticity revealed by N-methyl-D-aspartate receptor 2A signaling. Proc Natl Acad Sci U S A. 2003;100:2854–2859. doi: 10.1073/pnas.0536089100. [DOI] [PMC free article] [PubMed] [Google Scholar]
- Finnerty GT, Roberts LS, Connors BW. Sensory experience modifies the short-term dynamics of neocortical synapses. Nature. 1999;400:367–371. doi: 10.1038/22553. [DOI] [PubMed] [Google Scholar]
- Frank MG, Issa NP, Stryker MP. Sleep enhances plasticity in the developing visual cortex. Neuron. 2001;30:275–287. doi: 10.1016/s0896-6273(01)00279-3. [DOI] [PubMed] [Google Scholar]
- Graves LA, Heller EA, Pack AI, Abel T. Sleep deprivation selectively impairs memory consolidation for contextual fear conditioning. Learn Mem. 2003;10:168–176. doi: 10.1101/lm.48803. [DOI] [PMC free article] [PubMed] [Google Scholar]
- Grivel J, Cvetkovic V, Bayer L, Machard D, Tobler I, Mühlethaler M, Serafin M. The wake-promoting hypocretin/orexin neurons change their response to noradrenaline after sleep deprivation. J Neurosci. 2005;25:4127–4130. doi: 10.1523/JNEUROSCI.0666-05.2005. [DOI] [PMC free article] [PubMed] [Google Scholar]
- Harris AZ, Pettit DL. Recruiting extrasynaptic NMDA receptors augments synaptic signaling. J Neurophysiol. 2008;99:524–533. doi: 10.1152/jn.01169.2007. [DOI] [PubMed] [Google Scholar]
- Hennevin E, Huetz C, Edeline JM. Neural representations during sleep: from sensory processing to memory traces. Neurobiol Learn Mem. 2007;87:416–440. doi: 10.1016/j.nlm.2006.10.006. [DOI] [PubMed] [Google Scholar]
- Ito I, Sakimura K, Mishina M, Sugiyama H. Age-dependent reduction of hippocampal LTP in mice lacking N-methyl-D-aspartate receptor epsilon 1 subunit. Neurosci Lett. 1996;203:69–71. doi: 10.1016/0304-3940(95)12258-3. [DOI] [PubMed] [Google Scholar]
- Kapfhamer D, Valladares O, Sun Y, Nolan PM, Rux JJ, Arnold SE, Veasey SC, Bućan M. Mutations in Rab3a alter circadian period and homeostatic response to sleep loss in the mouse. Nat Genet. 2002;32:290–295. doi: 10.1038/ng991. [DOI] [PubMed] [Google Scholar]
- Kim MJ, Dunah AW, Wang YT, Sheng M. Differential roles of NR2A- and NR2B-containing NMDA receptors in Ras-ERK signaling and AMPA receptor trafficking. Neuron. 2005;46:745–760. doi: 10.1016/j.neuron.2005.04.031. [DOI] [PubMed] [Google Scholar]
- Kirkwood A, Rioult MC, Bear MF. Experience-dependent modification of synaptic plasticity in visual cortex. Nature. 1996;381:526–528. doi: 10.1038/381526a0. [DOI] [PubMed] [Google Scholar]
- Kiyama Y, Manabe T, Sakimura K, Kawakami F, Mori H, Mishina M. Increased thresholds for long-term potentiation and contextual learning in mice lacking the NMDA-type glutamate receptor epsilon1 subunit. J Neurosci. 1998;18:6704–6712. doi: 10.1523/JNEUROSCI.18-17-06704.1998. [DOI] [PMC free article] [PubMed] [Google Scholar]
- Köhr G. NMDA receptor function: subunit composition versus spatial distribution. Cell Tissue Res. 2006;326:439–446. doi: 10.1007/s00441-006-0273-6. [DOI] [PubMed] [Google Scholar]
- Kopp C, Longordo F, Nicholson JR, Lüthi A. Insufficient sleep reversibly alters bidirectional synaptic plasticity and NMDA receptor function. J Neurosci. 2006;26:12456–12465. doi: 10.1523/JNEUROSCI.2702-06.2006. [DOI] [PMC free article] [PubMed] [Google Scholar]
- Kutsuwada T, Kashiwabuchi N, Mori H, Sakimura K, Kushiya E, Araki K, Meguro H, Masaki H, Kumanishi T, Arakawa M, et al. Molecular diversity of the NMDA receptor channel. Nature. 1992;358:36–41. doi: 10.1038/358036a0. [DOI] [PubMed] [Google Scholar]
- Lin MT, Luján R, Watanabe M, Adelman JP, Maylie J. SK2 channel plasticity contributes to LTP at Schaffer collateral-CA1 synapses. Nat Neurosci. 2008;11:170–177. doi: 10.1038/nn2041. [DOI] [PMC free article] [PubMed] [Google Scholar]
- Longordo F, Kopp C, Lüthi A. Consequences of sleep deprivation on neurotransmitter receptor expression and function. Eur J Neurosci. 2009;29:1810–1819. doi: 10.1111/j.1460-9568.2009.06719.x. [DOI] [PubMed] [Google Scholar]
- Lozovaya NA, Grebenyuk SE, Tsintsadze TSh, Feng B, Monaghan DT, Krishtal OA. Extrasynaptic NR2B and NR2D subunits of NMDA receptors shape ‘superslow’ afterburst EPSC in rat hippocampus. J Physiol. 2004;558:451–463. doi: 10.1113/jphysiol.2004.063792. [DOI] [PMC free article] [PubMed] [Google Scholar]
- Malenka RC, Bear MF. LTP and LTD: an embarrassment of riches. Neuron. 2004;44:5–21. doi: 10.1016/j.neuron.2004.09.012. [DOI] [PubMed] [Google Scholar]
- McDermott CM, LaHoste GJ, Chen C, Musto A, Bazan NG, Magee JC. Sleep deprivation causes behavioral, synaptic, and membrane excitability alterations in hippocampal neurons. J Neurosci. 2003;23:9687–9695. doi: 10.1523/JNEUROSCI.23-29-09687.2003. [DOI] [PMC free article] [PubMed] [Google Scholar]
- McDermott CM, Hardy MN, Bazan NG, Magee JC. Sleep deprivation-induced alterations in excitatory synaptic transmission in the CA1 region of the rat hippocampus. J Physiol. 2006;570:553–565. doi: 10.1113/jphysiol.2005.093781. [DOI] [PMC free article] [PubMed] [Google Scholar]
- Migaud M, Charlesworth P, Dempster M, Webster LC, Watabe AM, Makhinson M, He Y, Ramsay MF, Morris RG, Morrison JH, O'Dell TJ, Grant SG. Enhanced long-term potentiation and impaired learning in mice with mutant postsynaptic density-95 protein. Nature. 1998;396:433–439. doi: 10.1038/24790. [DOI] [PubMed] [Google Scholar]
- Miyamoto H, Hensch TK. Reciprocal interaction of sleep and synaptic plasticity. Mol Interv. 2003;3:404–417. doi: 10.1124/mi.3.7.404. [DOI] [PubMed] [Google Scholar]
- Miyamoto H, Katagiri H, Hensch T. Experience-dependent slow-wave sleep development. Nat Neurosci. 2003;6:553–554. doi: 10.1038/nn1064. [DOI] [PubMed] [Google Scholar]
- Modirrousta M, Mainville L, Jones BE. Dynamic changes in GABAA receptors on basal forebrain cholinergic neurons following sleep deprivation and recovery. BMC Neurosci. 2007;8:15. doi: 10.1186/1471-2202-8-15. [DOI] [PMC free article] [PubMed] [Google Scholar]
- Monyer H, Burnashev N, Laurie DJ, Sakmann B, Seeburg PH. Developmental and regional expression in the rat brain and functional properties of four NMDA receptors. Neuron. 1994;12:529–540. doi: 10.1016/0896-6273(94)90210-0. [DOI] [PubMed] [Google Scholar]
- Philpot BD, Sekhar AK, Shouval HZ, Bear MF. Visual experience and deprivation bidirectionally modify the composition and function of NMDA receptors in visual cortex. Neuron. 2001;29:157–169. doi: 10.1016/s0896-6273(01)00187-8. [DOI] [PubMed] [Google Scholar]
- Philpot BD, Cho KK, Bear MF. Obligatory role of NR2A for metaplasticity in visual cortex. Neuron. 2007;53:495–502. doi: 10.1016/j.neuron.2007.01.027. [DOI] [PMC free article] [PubMed] [Google Scholar]
- Popescu G. Mechanism-based targeting of NMDA receptor functions. Cell Mol Life Sci. 2005;62:2100–2111. doi: 10.1007/s00018-005-5227-8. [DOI] [PMC free article] [PubMed] [Google Scholar]
- Popescu G, Robert A, Howe JR, Auerbach A. Reaction mechanism determines NMDA receptor response to repetitive stimulation. Nature. 2004;430:790–793. doi: 10.1038/nature02775. [DOI] [PubMed] [Google Scholar]
- Quinlan EM, Lebel D, Brosh I, Barkai E. A molecular mechanism for stabilization of learning-induced synaptic modifications. Neuron. 2004;41:185–192. doi: 10.1016/s0896-6273(03)00874-2. [DOI] [PubMed] [Google Scholar]
- Racca C, Stephenson FA, Streit P, Roberts JD, Somogyi P. NMDA receptor content of synapses in stratum radiatum of the hippocampal CA1 area. J Neurosci. 2000;20:2512–2522. doi: 10.1523/JNEUROSCI.20-07-02512.2000. [DOI] [PMC free article] [PubMed] [Google Scholar]
- Rumbaugh G, Vicini S. Distinct synaptic and extrasynaptic NMDA receptors in developing cerebellar granule neurons. J Neurosci. 1999;19:10603–10610. doi: 10.1523/JNEUROSCI.19-24-10603.1999. [DOI] [PMC free article] [PubMed] [Google Scholar]
- Sakimura K, Kutsuwada T, Ito I, Manabe T, Takayama C, Kushiya E, Yagi T, Aizawa S, Inoue Y, Sugiyama H, et al. Reduced hippocampal LTP and spatial learning in mice lacking NMDA receptor epsilon 1 subunit. Nature. 1995;373:151–155. doi: 10.1038/373151a0. [DOI] [PubMed] [Google Scholar]
- Scimemi A, Fine A, Kullmann DM, Rusakov DA. NR2B-containing receptors mediate cross talk among hippocampal synapses. J Neurosci. 2004;24:4767–4777. doi: 10.1523/JNEUROSCI.0364-04.2004. [DOI] [PMC free article] [PubMed] [Google Scholar]
- Sobczyk A, Scheuss V, Svoboda K. NMDA receptor subunit-dependent [Ca2+] signaling in individual hippocampal dendritic spines. J Neurosci. 2005;25:6037–6046. doi: 10.1523/JNEUROSCI.1221-05.2005. [DOI] [PMC free article] [PubMed] [Google Scholar]
- Tang YP, Shimizu E, Dube GR, Rampon C, Kerchner GA, Zhuo M, Liu G, Tsien JZ. Genetic enhancement of learning and memory in mice. Nature. 1999;401:63–69. doi: 10.1038/43432. [DOI] [PubMed] [Google Scholar]
- Thomas MJ, Moody TD, Makhinson M, O'Dell TJ. Activity-dependent beta-adrenergic modulation of low frequency stimulation induced LTP in the hippocampal CA1 region. Neuron. 1996;17:475–482. doi: 10.1016/s0896-6273(00)80179-8. [DOI] [PubMed] [Google Scholar]
- Vyazovskiy VV, Cirelli C, Pfister-Genskow M, Faraguna U, Tononi G. Molecular and electrophysiological evidence for net synaptic potentiation in wake and depression in sleep. Nat Neurosci. 2008;11:200–208. doi: 10.1038/nn2035. [DOI] [PubMed] [Google Scholar]
- Walker MP, Stickgold R. Sleep-dependent learning and memory consolidation. Neuron. 2004;44:121–133. doi: 10.1016/j.neuron.2004.08.031. [DOI] [PubMed] [Google Scholar]
- Yashiro K, Philpot BD. Regulation of NMDA receptor subunit expression and its implications for LTD, LTP, and metaplasticity. Neuropharmacology. 2008;55:1081–1094. doi: 10.1016/j.neuropharm.2008.07.046. [DOI] [PMC free article] [PubMed] [Google Scholar]
- Yashiro K, Corlew R, Philpot BD. Visual deprivation modifies both presynaptic glutamate release and the composition of perisynaptic/extrasynaptic NMDA receptors in adult visual cortex. J Neurosci. 2005;25:11684–11692. doi: 10.1523/JNEUROSCI.4362-05.2005. [DOI] [PMC free article] [PubMed] [Google Scholar]
- Zeng H, Chattarji S, Barbarosie M, Rondi-Reig L, Philpot BD, Miyakawa T, Bear MF, Tonegawa S. Forebrain-specific calcineurin knockout selectively impairs bidirectional synaptic plasticity and working/episodic-like memory. Cell. 2001;107:617–629. doi: 10.1016/s0092-8674(01)00585-2. [DOI] [PubMed] [Google Scholar]