To the Editor:
Our recent article (DeWan et al. 2001) reported suggestive, but not statistically significant, results of a genomewide quantitative-linkage analysis for creatinine clearance (CRCL), a common measure of renal function. The strongest signals were in regions on chromosomes 1, 3, and 6 in whites and in two regions on chromosome 3 in African Americans. The sample that we studied included every genotyped family from the first half of the HyperGEN study sample, a total of 215 African American sibships (n=466) and 265 white sibships (n=634).
To confirm these findings, once the remaining sibships were genotyped, we repeated, on the entire HyperGEN study sample, the analysis of linkage to CRCL. All recruiting, phenotyping, genotyping, and linkage-analysis methods were performed as previously reported (DeWan et al. 2001)—by using adjusted CRCL levels in a multipoint variance-components linkage analysis in GENEHUNTER2 and allowing for dominance at the trait locus—except that 11 new markers were added to the chromosome 3 region near that having the highest LOD score. Table 1 presents the results for linkage on chromosome 3 in African Americans, both for the smaller sample of the previous study and for the complete HyperGEN genotyped sample. In the complete sample, we found significant linkage, in African Americans (n=1,124 in 503 sibships), between chromosome 3p (LOD score 4.66 at 66 cM) and CRCL in our minimally adjusted residual-phenotype model (i.e., CRCL adjusted for age and age2). In the maximally adjusted residual-phenotype model (i.e., CRCL adjusted for age, age2, lean body mass, pulse rate, pulse pressure, hormone-replacement therapy, educational status, and physical activity), the evidence for linkage was slightly weaker (LOD score 3.82 at 65 cM). In our previous report, the LOD scores in this region were 2.50 and 1.78 for the minimally and maximally adjusted phenotypes, respectively.
Table 1.
Peak Multipoint LOD Scores in African Americans
|
LOD Score (Position [cM]) ina |
||||
| Sample 1 |
Sample 2 |
|||
| Chromosome | Minimally Adjusted | Maximally Adjusted | Minimally Adjusted | Maximally Adjusted |
| 3p | 2.50 (58) | 1.78 (58) | 4.66 (66) | 3.82 (65) |
| 3q | 2.31 (213) | 3.61 (215) | 1.35 (191) | 1.03 (191) |
Sample 1 was used in the previously published report (DeWan et al. 2001) and consists of one half of the total HyperGEN sample; sample 2 is the complete HyperGEN sample available for the genome scan; “Minimally Adjusted” and “Maximally Adjusted” refer to the type of residual-phenotype model used for the analysis.
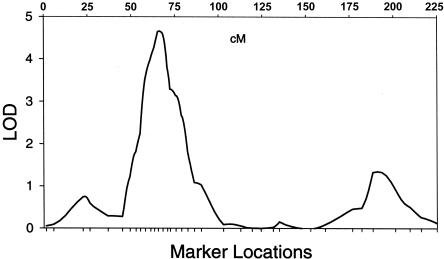
To narrow the region, we added 11 new linkage markers between 49 cM and 86 cM and conducted both single-point and multipoint linkage analyses on the combined marker panel. The highest single-point LOD score (3.72) was obtained at 71 cM for the minimally adjusted CRCL, and, with the addition of the 11 markers, the highest multipoint LOD score increased from 4.31 at 67 cM to 4.57 at 66 cM, in the complete African American sample (see fig. 1).
Figure 1.
Multipoint linkage results from chromosome 3 in African Americans, showing a peak LOD score of 4.66 at 66 cM.
In the original genome scan, our best result for linkage was on the q arm of chromosome 3 in African Americans (LOD score 3.61 at 215 cM), for the maximally adjusted residual-phenotype model. In this complete sample, the LOD score was reduced in this region (LOD score 1.03 at 191 cM). There were no other regions, throughout the genome, that exceeded a LOD score of 2.0 (the Lander and Kruglyak [1995] threshold for suggestive linkage). We were also unable to replicate any of the linkage results on chromosomes 1, 3, or 6 that were observed in the original genome scan in whites.
Our LOD score of 4.66 for the confirmation of linkage to chromosome 3p exceeds the statistically significant threshold of 3.7 implied by Morton (1998) for 2-df tests of linkage (ours was a 2-df test, because we estimated both additive and dominance effects at the QTL). In the original, smaller sample, the LOD score of 2.50 was merely suggestive of linkage. As with any complex genetic trait, it is encouraging to observe replication of a linkage finding. Replication by an independent team—with a different population, sampling method, or analysis technique—would further strengthen the evidence that a locus on chromosome 3p contributes to variation in CRCL.
Acknowledgments
The HyperGEN Network is funded by National Heart, Lung, and Blood Institute grant R01 HL55673 and by cooperative agreements (U10) with the National Heart, Lung, and Blood Institute: HL54471 (Utah field center), HL54472 (Minnesota laboratory), HL54473 (data-coordinating center), HL54495 (Alabama field center), HL54496 (Minnesota field center), HL54509 (North Carolina), HL54515 (Utah DNA laboratory).
References
- DeWan AT, Arnett DK, Atwood LD, Province MA, Lewis CE, Hunt SC, Eckfeldt J (2001) A genome scan for renal function among hypertensives: the HyperGEN study. Am J Hum Genet 68:136–144 [DOI] [PMC free article] [PubMed] [Google Scholar]
- Lander E, Kruglyak L (1995) Genetic dissection of complex traits: guidelines for interpreting and reporting linkage results. Nat Genet 11:241–247 [DOI] [PubMed] [Google Scholar]
- Morton N (1998) Significance levels in complex inheritance. Am J Hum Genet 62:690–697 [DOI] [PMC free article] [PubMed] [Google Scholar]


