Abstract
Five different samples of table olives, two regular Spanish table olives and three “bright green table olives”, have been analyzed by HPLC–MS/MS to determine their pigment profile. Typical pigment profiles of almost all table olives show primarily chlorophyll derivatives lacking metals (e.g., pheophytin a/b and 152-Me-phytol-chlorin e6). Bright green table olives have a unique profile including metallo–chlorophyll complexes (Cu-152-Me-phytol-chlorin e6 with 26–48% and Cu-pheophytin a with 3–18%) as their major pigments. New tentative structures have been identified by MS such as 152-Me-phytol-rhodin g7, 152-Me-phytol-chlorin e6, 152-Me-phytol-isochlorin e4, Cu-152-Me-phytol-rhodin g7, Cu-152-Me-phytol-chlorin e6, and Cu-152-Me-phytol-isochlorin e4, and new MS/MS fragmentation patterns are reported for Cu-152-Me-phytol-rhodin g7, Cu-152-Me-phytol-chlorin e6, Cu-pheophytin b, Cu-pheophytin a, Cu-pyropheophytin b, and Cu-pyropheophytin a. The presence of metallo–chlorophyll derivatives is responsible for the intense color of bright green table olives, but these metallo–chlorophyll complexes may be regarded as a “green staining” defect that is unacceptable to consumers.
Keywords: high-perfomance liquid chromatography, mass spectrometry, table olives, Cu-pheophytin, metallo–chlorophylls, green staining alteration, regreening
INTRODUCTION
The color of vegetable products is one of the most important sensory attributes evaluated by consumers worldwide, and, in green fresh vegetables and fruits, the green color is due to the presence of chlorophylls a and b. For table olives, color is a very critical attribute.
The most common color changes of fresh vegetables during cooking, freeze preservation, storage, or heat processing are due to the conversion of chlorophylls (a and b), responsible for bright green color, into their respective pheophytins (a and b) that are responsible for yellow-brown olive color. This dramatic change in color involves the release of the magnesium from the porphyrin ring. However, the insertion of metals within the porphyrin ring, such as zinc (Zn2+) or copper (Cu2+), produces a regreening effect. These metallo–chlorophyll complexes are more stable, due to higher metal–porphyrin bond energies, and more resistant to acid and heat than are naturally occurring magnesium (Mg2+) chlorophyll complexes.1 In addition, the formation of copper complexes is much more rapid than zinc complexes.2,3 Regreening via the formation of metallo – chlorophyll complexes has been used to preserve the desirable fresh green color of vegetables by the food industry,4,5 including several patents.4–7
In the traditional processing of Spanish style of table olives, chlorophylls a and b are degraded completely to pheophytins and pheophorbides during the fermentation process by two different and coexisting mechanisms. In the initial treatment of the olives with NaOH, at alkaline pH, the chlorophyllase is active, but in the fermentation process, pH turns acidic followed by the loss of Mg2+. The pigment transformation brought about by lactic fermentation produces olives that are highly valuable for their characteristic golden color.8
The innovations introduced in the traditional system of processing (elimination of the short washing, addition of acids, reuse of brines, etc.) have changed the previously described mechanism of chlorophyll degradation, with the detection of oxidative reactions that affects the chlorophyll isocyclic ring and production of allomerized chlorophylls.9
Nevertheless, the Gordal variety, used almost exclusively to produce table olives, develops an alteration in color, known as “green staining” (GS) that is undesirable to consumers.10 This common defect is observed as bluish-green zones distributed over the skin that contrasts with its natural olive color. This alteration most likely occurs through the formation of endogenous metal porphyrin complexes to create GS.11 The formation of metallo–chlorophyll complexes is thought to arise from the fruit’s endogenous Cu and may involve degradation of cell integrity allowing contact of the metal with the chlorophyll derivatives, which under normal conditions are protected in their natural lipophilic environment. Endogenous metal such as Cu may arise from the pectin chain that can serve as a reservoir of copper that is captured by chlorophyll pigments separated from the thylakoid membrane to form the copper chlorophyll complexes.12
The most common technique to analyze these pigments is RP-HPLC-DAD, although HPLC–MS has also been employed for the determination of chlorophylls and their derivatives because it provides structural information, and, in addition, it is a very sensitive and selective technique. Methods based on HPLC–MS include atmospheric pressure ionization (APCI)13,14 and electrospray ionization (ESI)15,16 interfaces.
Previously, GS alteration has been studied,8,11 although those studies did not utilize HPLC–MS and tandem MS with accurate mass as an identification tool. In this study, metallo–chlorophyll complexes responsible for green staining are identified by HPLC mass spectrometry and quantified by HPLC in three commercial samples. In addition, their pigment profiles are compared to typical table olives (yellow-brown olive color).
MATERIALS AND METHODS
Samples
The study was carried out with five different commercial green table olives bought at different markets: sample A, “Italian Castelvetrano Whole Green Olives” (product of Italy) packed by Mezzetta Inc.; sample B, “Olives Castelvetrano Divina” packed by Whole Foods Market; sample C, “Green Table Olives” packed by Vincenzo’s; sample D, “Spanish Olives” (var. Manzanilla); and sample E, “Spanish Queen Olives” (var. Gordal) (both Spanish products) distributed by Kroger Co.
Chemicals and Standards
Ammonium acetate was supplied by Fluka (Zwijndrecht, The Netherlands). HPLC/MS and HPLC reagent grade solvents were purchased from Fisher Scientific Inc. (Pittsburgh, PA). Standards of pheophorbide a, Cu-pheophorbide a, rhodin g7, chlorin e6, and Cu-chlorin e6 were supplied by Porphyrin Product Inc. (Logan, UT). Chlorophylls a (chl a) and b (chl b) were supplied by Sigma-Aldrich Co. (St. Louis, MO). Standards of pheophytin a (phy a) and b (phy b) were obtained from their respective chlorophyll by acidification.17 Standards of Cu-pheophytin a and b were obtained from their respective chlorophyll by reaction with an excess of copper(II) ions as chloride.10
Extraction of Pigments
Fifty depitted fruits (ca. 40 g) were ground and homogenized. Triplicate extractions were prepared by accurately weighing 5–15 g for each sample. Pigment extraction was performed with N,N-dimethylformamide (DMF), according to the method proposed by Mínguez-Mosquera and Garrido-Fernádez18 that allows the selective separation of pigments in oil free pigment solutions. Thus, DMF retains chlorophyll and xanthophylls, while the hexane phase retains the carotene fraction. All of the analytical procedures were performed under red lighting to avoid any photooxidation of the chlorophyllic compounds.
HPLC–MS and HPLC–MS/MS
HPLC–MS analysis was carried out on a Waters 2695 gradient HPLC separation module (Waters Corp., Milford, MA) equipped with an auto injector and a 996-photodiode array detector (PDA). Chromatographic separations were performed on a HALO C18 Symmetry column (75 mm × 4.6 mm i.d., 2.7 µm) (MAC-MOD Analytical, Inc.). The mobile phase consisted of (1/1/8) (v/v/v) water/ammonium acetate 1 M/methanol (solvent A), acetonitrile (solvent B), and reagent alcohol (solvent C) at a flow rate of 1.25 mL/min. Column temperature was kept at 25 °C. Table 1 shows the gradient scheme for eluting the pigments.
Table 1.
Gradient Used for Elution of Pigments by HPLC Reverse Phasea
| time (min) | solvent A | solvent B | solvent C | flow (mL/min) | curve |
|---|---|---|---|---|---|
| 0.00 | 75.0 | 25.0 | 0.0 | 1.25 | 1 |
| 8.00 | 25.0 | 75.0 | 0.0 | 1.25 | 6 |
| 10.00 | 25.0 | 0.0 | 75.0 | 1.25 | 6 |
| 11.00 | 19.0 | 0.0 | 81.0 | 1.25 | 6 |
| 13.00 | 14.0 | 0.0 | 86.0 | 1.25 | 6 |
| 15.00 | 11.0 | 0.0 | 89.0 | 1.25 | 6 |
| 16.00 | 0.0 | 0.0 | 100.0 | 1.25 | 6 |
| 18.00 | 0.0 | 0.0 | 100.0 | 1.25 | 6 |
| 20.00 | 75.0 | 25.0 | 0.0 | 1.25 | 1 |
(1/1/8) (v/v/v) water/ammonium acetate 1 M/methanol (solvent A), acetonitrile (solvent B), and reagent alcohol (solvent C).
Mass spectrometric studies were performed on a Quadrupole/ time-of-flight mass spectrometer (QToF Premier, Micromass Limited, Manchester, U.K.) equipped with an atmospheric pressure chemical ionization interface (APCI). Positive ion APCI conditions for chlorophyll analyses were: 30 µA corona current, collision energy 8 eV, cone voltage 35 V, source temperature at 110 °C, 50 L/h of cone gas, and the flow of nitrogen desolvation gas was 400 L/h, at 450 °C. Daughter ions spectra were obtained by APCI negative using various collision energies (8–35 eV). Sodium formate solution was used to calibrate the mass spectrometer from m/z 100–1500 with mass accuracy of <2 ppm. Detection and tentative identification of all of the chlorophyll derivatives were accomplished using in-line electronic absorption spectra recorded every 1.2 nm from 200 to 800 nm with a Waters model 996-PDA (Milford, MA). Quantification of all of the chlorophyll derivatives was based on PDA data from calibration curves with external standards at the respective λmax of each compound.
Color Measurement
The color analysis has been made with a Minolta colorimeter (CR-300) using CIE L*a*b* scale with illuminants C.
Statistical Analysis
Data were analyzed for differences between means using one-way analysis of variance (ANOVA). The Brown and Forsythe test19 was used as a post hoc comparison of statistical significance (p values < 0.05) using Statistica 6.0 (StatSoft, Inc., 2001).
RESULTS AND DISCUSSION
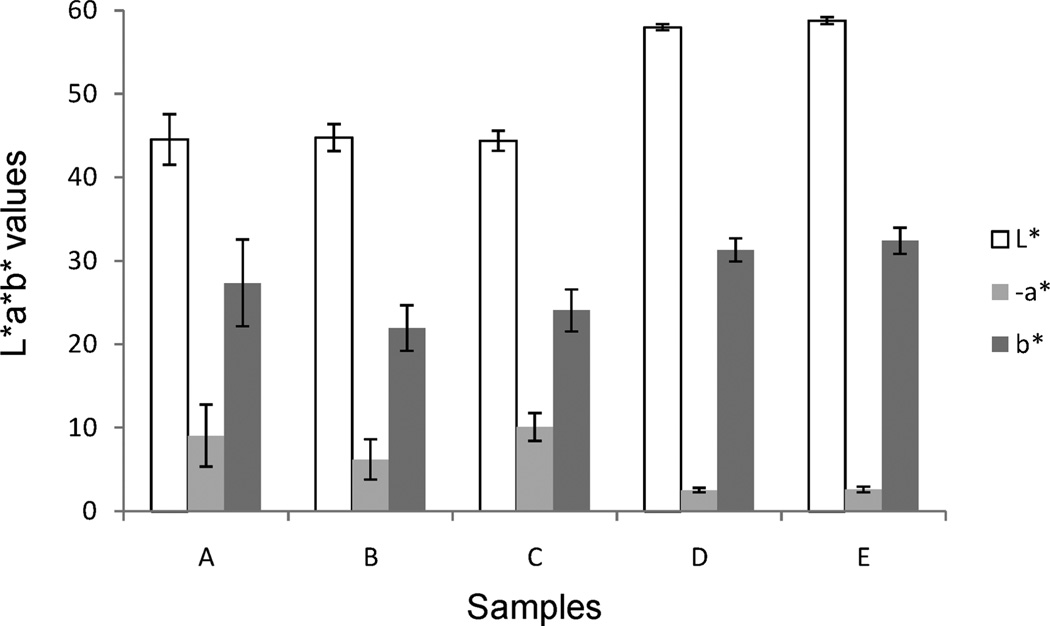
As color is the variable that should distinguish bright green table olives from regular table olives with a yellow-brown olive color, a Minolta colorimeter using CIE Lab scale was used. Figure 1 displays L*a*b* values of all of the samples showing that bright green table olives are statistically different (p values < 0.05) from the regular table olives with all of the coordinates (−8.4 ± 2.6 vs −2.6 ± 0.3), with coordinate a* (a*, negative values indicate green, while positive values indicate magenta) being the most remarkable. In addition, there are no statistical differences (p values < 0.05) in L*a*b coordinates within the samples of the two sets.
Figure 1.
Color measurement L*a*b* coordinates of five samples of table olives.
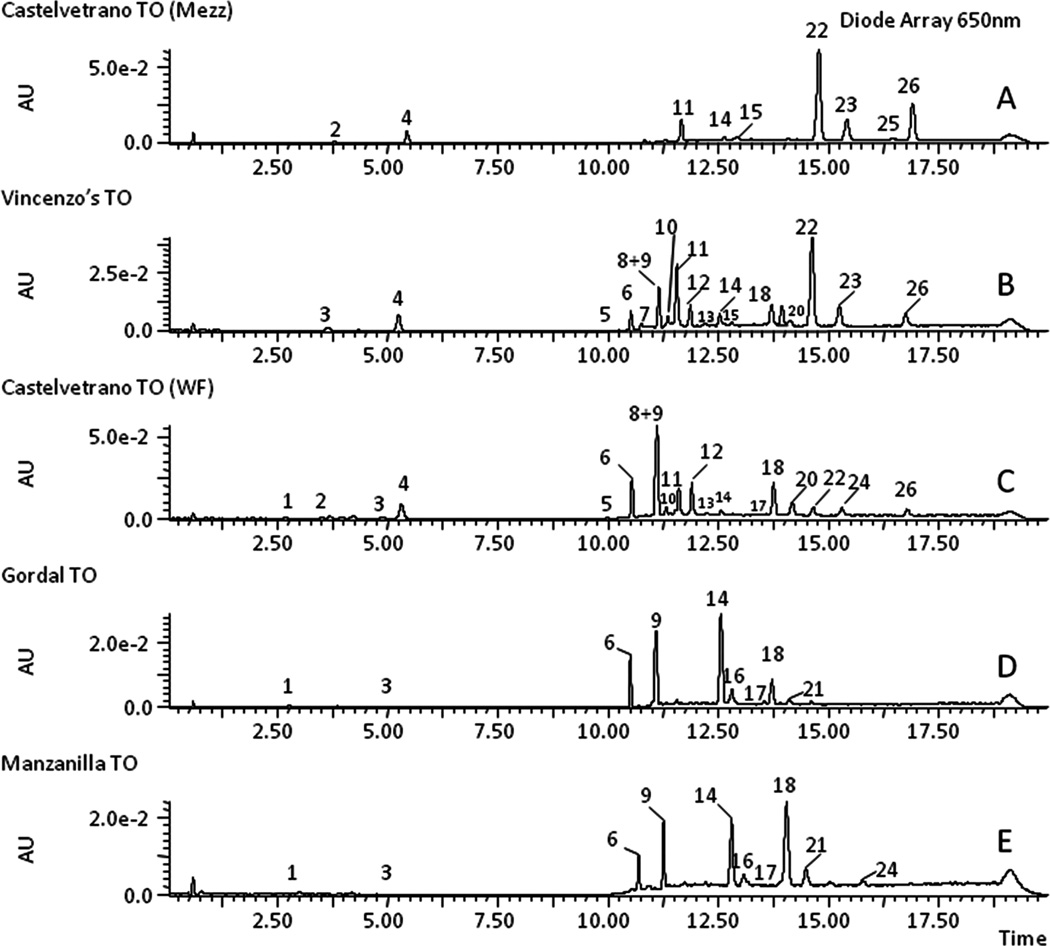
Once it was established that color was a determinant variable distinguishing the two sets of samples, the chemical compounds responsible for the color difference were identified and quantified by HPLC–MS/MS. Thus, Figure 2 shows the HPLC chromatograms, recorded at 650 nm, of chlorophylls, chlorophyll derivatives, and metallo–chlorophylls complexes (Table 2) determined in the five samples studied. Table 3 lists all of the pigments identified in Figure 2 with their chromatographic, spectroscopic, and mass characteristics. The information from the spectral data agrees basically with the published information. Although many of these pigments observed herein have been identified20–22 by mass spectrometry, nine pigment components (peaks numbered 6, 7, 9, 11, 15, 19, 22, 23, and 26) were not yet characterized by MS/MS.
Figure 2.
HPLC chromatograms of five samples, coded A–E, recorded at 650 nm. Note: AU, absorption units; TO, table olives.
Table 2.
Different Structures of Pigments
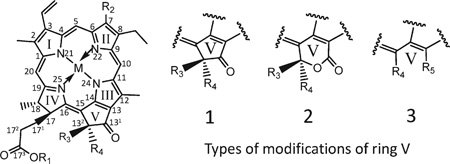 | |||||||
|---|---|---|---|---|---|---|---|
| pigment | I. ringa | R1 | R2 | R3 | R4 | R5 | M |
| pheophorbide a | 1 | H | CH3 | H | COOCH3 | 2H | |
| pyropheophorbide a | 1 | H | CH3 | H | H | 2H | |
| Cu-pheophorbide a | 1 | H | CH3 | H | COOCH3 | Cu | |
| Cu-pyropheophorbide a | 1 | H | CH3 | H | H | Cu | |
| 152-Me-phytol-rhodin g7 ester | 3 | phytyl | CHO | CH2COOCH3 | COOH | 2H | |
| Cu-152-Me-phytol-rhodin g7 ester | 3 | phytyl | CHO | CH2COOCH3 | COOH | Cu | |
| chlorophyll b | 1 | phytyl | CHO | H | COOCH3 | Mg | |
| 152-Me-phytol-chlorin e6 ester | 3 | phytyl | CH3 | CH2COOCH3 | COOH | 2H | |
| Cu-152-Me-phytol-chlorin e6 ester | 3 | phytyl | CH3 | CH2COOCH3 | COOH | Cu | |
| chlorophyll a | 1 | phytyl | CH3 | H | COOCH3 | Mg | |
| pheophytin b | 1 | phytyl | CHO | H | COOCH3 | 2H | |
| Cu-pheophytin b | 1 | phytyl | CHO | H | COOCH3 | Cu | |
| pyropheophytin b | 1 | phytyl | CHO | H | H | 2H | |
| Cu-pyropheophytin b | 1 | phytyl | CHO | H | H | Cu | |
| pheophytin a | 1 | phytyl | CH3 | H | COOCH3 | 2H | |
| Cu-pheophytin a | 1 | phytyl | CH3 | H | COOCH3 | Cu | |
| pyropheophytin a | 1 | phytyl | CH3 | H | H | 2H | |
| 152-Me-phytol-isochlorin e4 | 3 | phytyl | CH3 | CH2COOCH3 | H | 2H | |
| 152-Et-phytol-chlorin e4 | 3 | phytyl | CH3 | CH2CH3 | COOH | 2H | |
| Cu-152-Me-phytol-isochlorin e4 | 3 | phytyl | CH3 | CH2COOCH3 | H | Cu | |
| Cu-152-Et-phytol-chlorin e4 | 3 | phytyl | CH3 | CH2CH3 | COOH | Cu | |
| Cu-pyropheophytin a | 1 | phytyl | CH3 | H | H | Cu | |
I. ring: Isocyclic ring (ring V).
Table 3.
Spectroscopic and Chromatographic Information of Pigments Quantified by HPLC–MS and Identified in the Samplesa
| spectral data in the eluent |
published data |
|||||||||||||
|---|---|---|---|---|---|---|---|---|---|---|---|---|---|---|
| maxima (nm) |
calcdc |
obsd |
maxima (nm) |
|||||||||||
| peak no | pigment | K′c | I | II | III | peak ratio | [M + H]+ | [M + H]+ | I | II | III | peak ratio | solvent | ref |
| 1 | pheophorbide a | 2.05 | 410b | 666 | 1.94 | 593.276 | 593.277 | 409 | 666 | 1.85 | MP | 23 | ||
| 2 | Cu-pheophorbide a | 2.76 | 400 | 425b | 651 | 1.10 | 654.190 | 654.193 | 400 | 424b | 654 | 1.00 | MP | 34 |
| 3 | pyropheophorbide a | 3.27 | 410b | 666 | 2.03 | 535.270 | 535.272 | 409 | 666 | 1.85 | MP | 11 | ||
| 4 | Cu-pyropheophorbide a | 4.63 | 400 | 425b | 651 | 1.10 | 596.184 | 596.182 | 404 | 422b | 653 | MP | 27 | |
| 5 | unknown | 9.14 | 447b | 577 | 626 | 10.98 | ||||||||
| 6 | 152-Me-phytol-rhodin g7 ester | 9.60 | 427b | 561 | 649 | 8.65 | 903.563 | 903.565 | 429b | 656 | MP | 21e | ||
| 7 | Cu-152-Me-phytol-rhodin g7 ester | 9.80 | 429b | 565 | 613 | 6.54 | 964.477 | 964.475 | 430b | 614 | MP | 21e | ||
| 8 | chlorophyll a | 10.10 | 464b | 598 | 649 | 2.52 | 907.522 | 907.520 | 453b | 593 | 642 | 2.89 | DE | 35 |
| 9 | 152-Me-phytol-chlorin e6 ester | 10.20 | 400b | 662 | 3.90 | 889.584 | 889.586 | 404b | 642 | 660 | MP | 21e | ||
| 10 | chlorophyll b′ | 10.35 | 464b | 598 | 649 | 2.52 | 907.522 | 907.520 | 453b | 593 | 642 | 2.89 | DE | 35 |
| 11 | Cu-152-Me-phytol-chlorin e6 ester | 10.65 | 407b | 504 | 629 | 2.46 | 950.498 | 950.495 | 408b | 635 | MP | 21e | ||
| 12 | chlorophyll a | 10.95 | 432b | 662 | 1.14 | 893.543 | 893.545 | 430b | 615 | 661 | 1.32 | DE | 35 | |
| 13 | chlorophyll a′ | 11.29 | 432b | 662 | 1.14 | 893.543 | 893.545 | 430b | 615 | 661 | 1.32 | DE | 35 | |
| 14 | pheophytin b | 11.73 | 437b | 651 | 4.59 | 885.552 | 885.550 | 433b | 599 | 654 | 4.81 | DE | 35 | |
| 15 | Cu-pheophytin b | 11.97 | 445b | 633 | 2.52 | 946.466 | 946.469 | 443b | 633 | 2.38 | MP | 34 | ||
| 16 | pheophytin b′ | 12.01 | 437b | 651 | 4.59 | 885.552 | 885.550 | 433b | 599 | 654 | 4.81 | DE | 35 | |
| 17 | pyropheophytin b | 12.35 | 437b | 651 | 4.34 | 827.547 | 827.549 | 435b | 654 | 3.83 | MP | 34 | ||
| 18 | pheophytin a | 12.97 | 410b | 505 | 666 | 2.10 | 871.573 | 871.575 | 408b | 503 | 667 | 2.14 | DE | 35 |
| 19 | Cu-pyropheophytin b | 13.12 | 444b | 633 | 2.02 | 888.461 | 888.463 | 443b | 633 | 2.38 | MP | 34 | ||
| 20 | 152-Me-phytol-isochlorin e4 | 13.27 | 400b | 667 | 2.94 | 845.594 | 845.595 | 399b | 662 | 2.92 | MP | 27f | ||
| 21 | pheophytin a′ | 13.39 | 410b | 505 | 666 | 2.10 | 871.573 | 871.575 | 408b | 503 | 667 | 2.14 | DE | 35 |
| 22 | Cu-pheophytin a | 13.91 | 400 | 425b | 651 | 0.97 | 932.487 | 932.489 | 400 | 424b | 654 | 1.00 | MP | 34 |
| 23 | Cu-pheophytin a′ | 14.57 | 400 | 425b | 651 | 0.97 | 932.487 | 932.489 | 400 | 424b | 654 | 1.00 | MP | 34 |
| 24 | pyropheophytin a | 14.63 | 410b | 505 | 666 | 1.97 | 813.568 | 813.565 | 409b | 666 | 1.85 | MP | 34 | |
| 25 | Cu-152-Me-phytol-isochlorin e4 | 15.50 | 408b | 630 | 2.34 | 906.508 | 906.510 | 406b | 630 | 2.55 | MP | 21e | ||
| 26 | Cu-pyropheophytin a | 15.94 | 400 | 425b | 651 | 1.02 | 874.482 | 874.484 | 400 | 424b | 654 | 1.00 | MP | 34 |
K′c = (tr – tm)/tm, where tr is the retention time of the peak and tm is the retention time of the unretained component. MP, mobile phase. DE, diethyl ether.
Soret band.
Calculated mass (the mass given is for the most abundant isotope, i.e., 63Cu).
Observed mass, average Δppm < 2.5.
Compared to a similar structure without phytol.
Compared to formylpheophytin a.
Pigment profiles presented in Figure 2 show that bright green table olive samples (A, Castelvetrano-Mezzetta; B, Vincenzo’s; C, Castelvetrano-WF) can be easily distinguished from Spanish table olives (D, var. Gordal; E, var. Manzanilla). The chromatograms of the samples coded A–C showed the highest concentrations of Cu-152-Me-phytol-chlorin e6 ester (peak 11), Cu-pheophytin a (peaks 22–23), Cu-pyropheophytin a (peak 26), and chlorophylls a (peaks 12–13) and b (peaks 8 and 10).
Concerning the other two samples (coded D,E), the more representative compounds are pheophytin a (peaks 18 and 21) and b (peaks 14 and 16), 152-Me-phytol-rhodin g7 ester (peak 6), and 152-Me-phytol-chlorin e6 ester (peak 9), although minor pigments, such as pheophorbide a (peak 1) and pyropheophorbide a (peak 3), are also present. The most characteristic of the chlorophyll pigments in the Spanish style olive, processed by fermentation, is that all of the chlorophyll pigments have lost magnesium within the porphyrin ring, resulting in table olives with a yellow-brown olive color.
However, allomerized chlorophyll compounds detected in the Spanish style of table olives were identified primarily as phytol-chlorin e6 and phytol-rhodin g7 from their chromatographic characteristics and absorption spectral data.9 Subsequently, the nominal mass molecular ion obtained by MS led to its identification as 15-glyoxilic acid pheophytin a and 15-glyoxilic acid pheophytin b, compounds with similar chromatographic and spectral characteristics but different molecular mass.8 Finally, accurate mass MS/MS data from the ion fragmentation obtained in this work suggested a new structure such as 152-Me-phytol-rhodin g7 ester (peak 6) and 152-Me-phytol-chlorin e6 ester (peak 9). These pigments could be obtained by solvolysis of the isocyclic ring of the respective pheophytin according to the reaction scheme given by Hyninnen.23
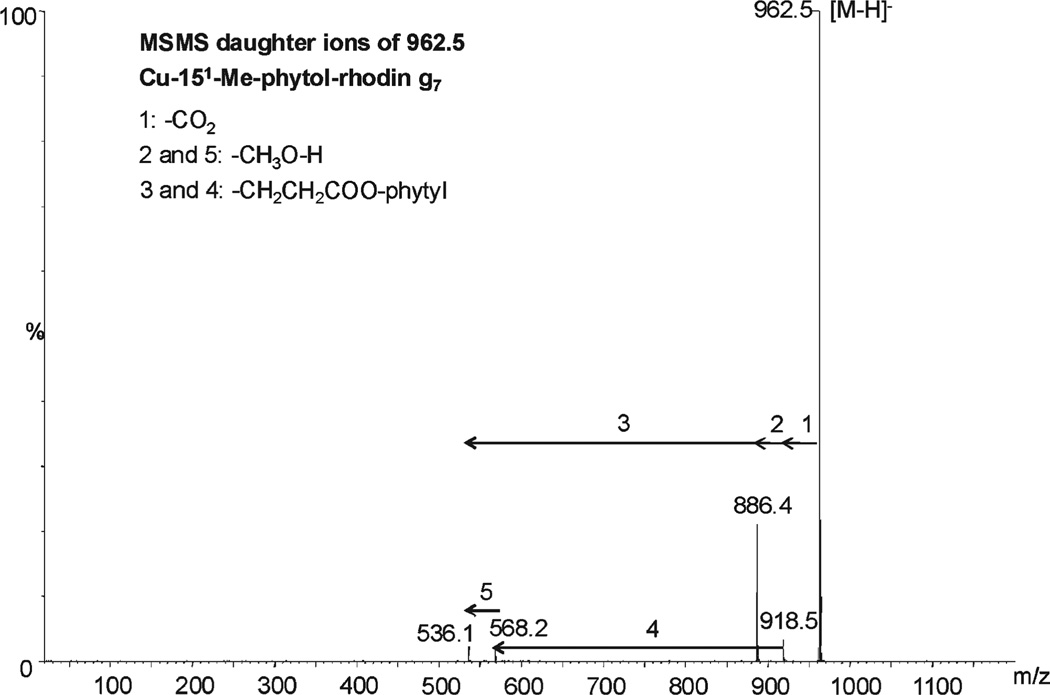
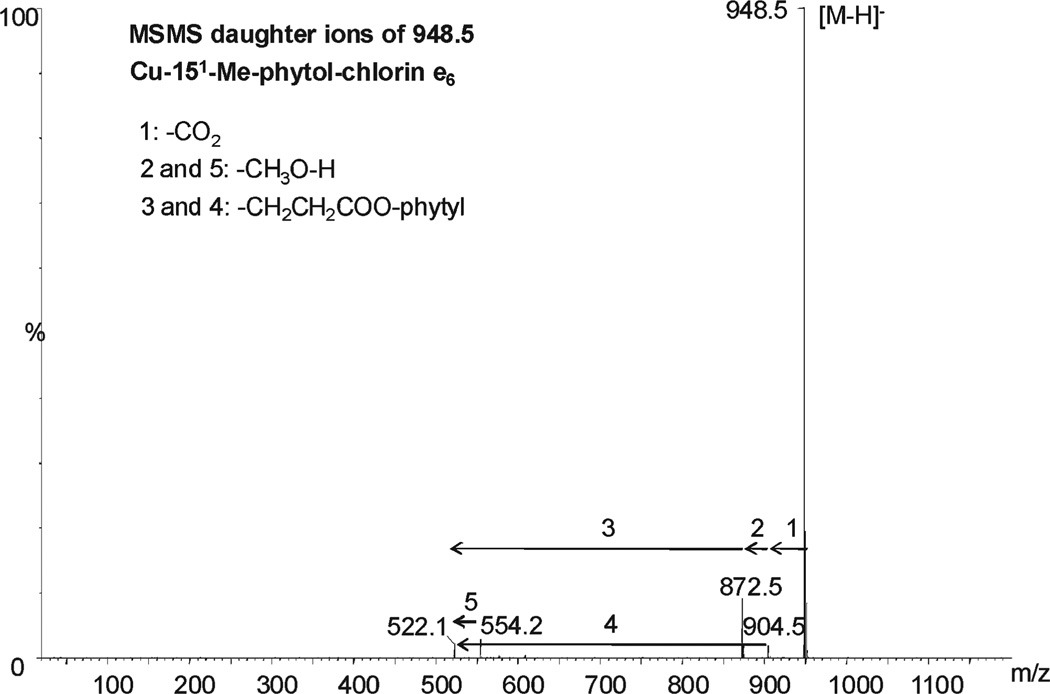
From the set of newly identified pigments, the most abundant in bright green table olives were Cu-152-Me-phytol-rhodin g7 ester, Cu-152-Me-phytol-chlorin e6 ester, Cu-pheophytin a, and Cu-pyropheophytin a, and also 152-Me-phytol-rhodin g7 ester and 152-Me-phytol-chlorin e6 ester in the Spanish table olives. The MS/MS fragmentation patterns of the first two pigments, using a ramped collision energy, revealed the following daughter ions (Figures 3 and 4): m/z 918.5, 886.4, 568.2, and 536.1 for Cu-152-Me-phytol-rhodin g7 ester ([M – H]−= 964.5) and 904.5, 872.5, 554.2, and 522.1 for Cu-152-Me-phytol-chlorin e6 ester ([M –H]− = 948.5). The ions 918.5 and 904.4 are consistent with the loss of a carboxylic group (M − CO2) from the respective molecular ion, while the loss of a methoxy group (M − CH3O−H) from ions 918.5 and 904.4 would yield ions with m/z 886.4 and 872.5, respectively. Similarly, the loss of the phytyl ester chain (M − CH2CH2COO-phytyl) from 886.4, 872.5, 918.5, and 904.4 would yield ions m/z 536.1, 522.1, 568.2, and 554.2, respectively. These pigments have been identified before as Cu-15-glyoxilic acid pheophytins a and b, respectively.11 However, these pigments differ from the new structures identified herein due to a glyoxilic acid (−COCOOH) in R4 (Table 4). No fragment such as M−CO or M−COCOOH has been found for the new structures, allowing the possibility of phytol-rhodin or phytol-chlorin structures.
Figure 3.
MS/MS daughter ions of Cu-152-Me-phytol-rhodin g7 ester.
Figure 4.
MS/MS daughter ions of Cu-152-Me-phytol-chlorin e6 ester.
Table 4.
MS/MS Fragmentation Pattern of Chlorophyll Derivatives
| (m/z)a |
|||
|---|---|---|---|
| pigment | calculatedb | observed | MS/MS (m/z) |
| 152-Me-phytol-rhodin g7 ester | 901.5 a | 901.5 | 857.6, 825.6, 507.2, 475.2 |
| 152-Me-phytol-chlorin e6 ester | 887.6 a | 887.6 | 843.6, 811.6, 493.2, 461.2 |
| Cu-152-Me-phytol-rhodin g7 ester | 962.5 a | 962.5 | 918.5, 886.4, 568.2, 536.1 |
| Cu-152-Me-phytol-chlorin e6 ester | 948.5 a | 948.5 | 904.5, 872.5, 554.2, 522.1 |
| Cu-pheophytin b | 945.5 b | 945.5 | 662.2, 590.1 |
| Cu-pyropheophytin b | 887.5 b | 887.5 | 608.1, 564.2, 536.1 |
| Cu-pheophytin a | 931.5 b | 931.5 | 652.2, 580.2, 576.2, 565.1 |
| Cu-pheophytin a′ | 931.5 b | 931.5 | 652.2, 580.2, 576.2, 565.1 |
| Cu-pyropheophytin a | 873.5 b | 873.5 | 594.2, 550.2, 522.2 |
[M – H]− is labeled with “a” and [M]•− is labeled with “b”.
The mass given is for the most abundant isotope, that is, 63Cu.
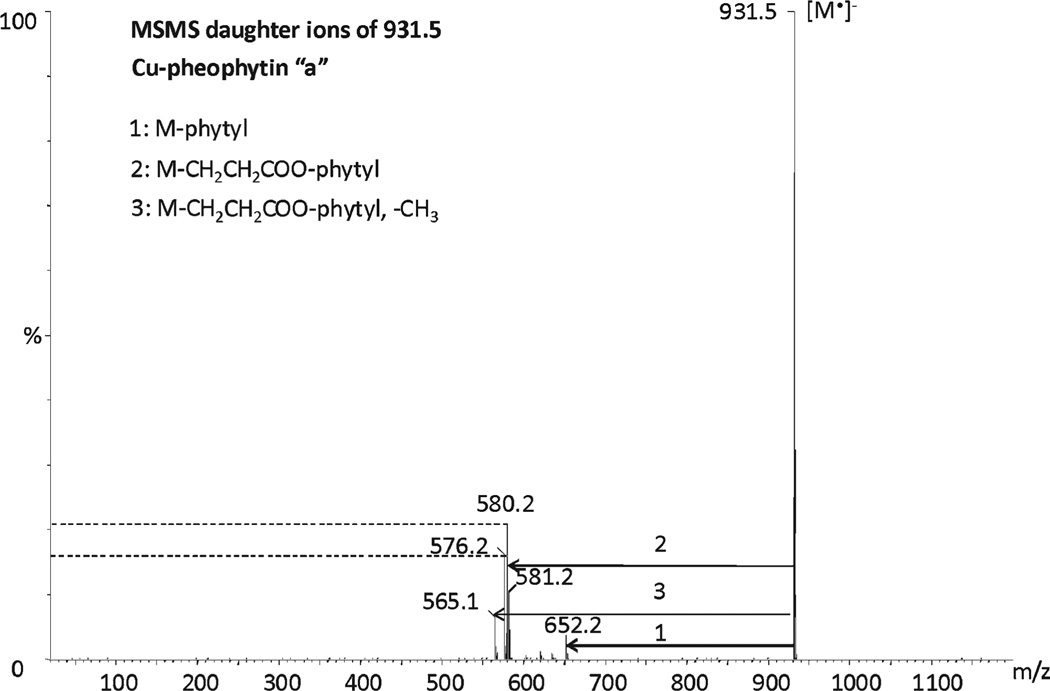
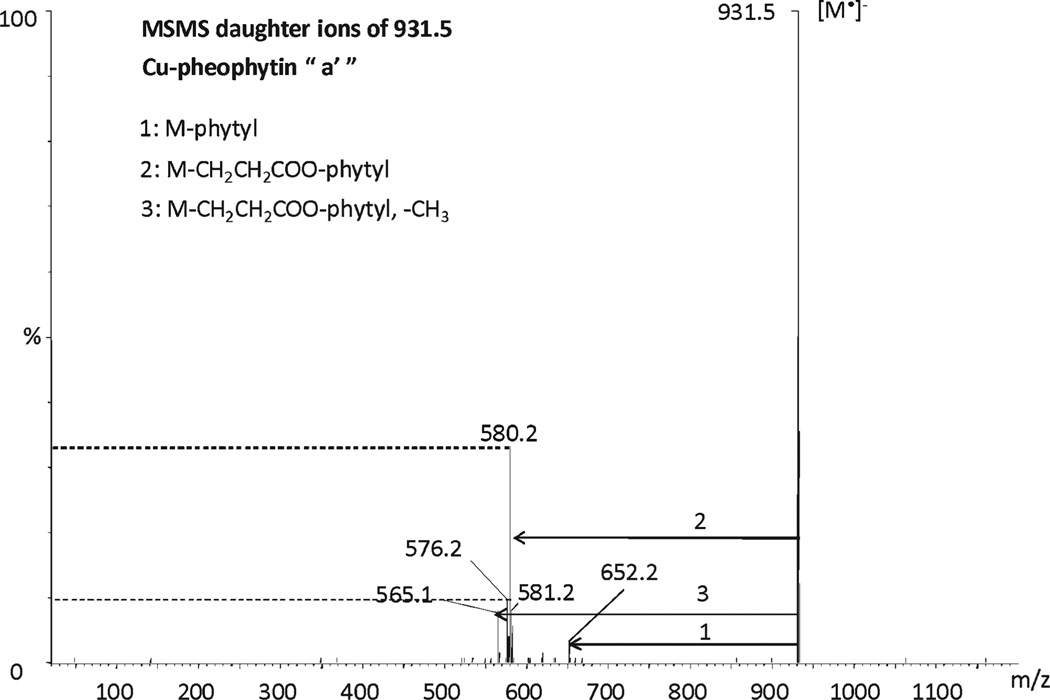
The MS/MS fragmentation patterns of Cu-pheophytin a and its epimer a′ using a fixed collision energy of 30 eV are shown in Figures 5 and 6. Both epimers yielded the same fragmentation patterns: the loss of phytyl yielding the fragment 652.2 (M − phytyl), the loss of the phytyl ester chain yielding the mass 580.2 (M − CH2CH2COO-phytyl), the loss of the phytol chain (M − O-phytyl) plus the loss of the methoxy carbonyl group (M − COOCH3) of R4 yields the mass 576.2, and the loss of the methyl group from the methoxycarbonyl group of R4 yields the mass 565.1. However, the abundance of fragment ions is different for Cu-pheophytin a and its respective epimer under identical conditions. A similar observation has been reported previously with pheophytins a and b.20 The Cu-pheophytin a epimer exhibited an abundant fragment of 580.2 (M − CH2CH2COO-Phytyl), approximately 10% greater than for a, whereas the fragment m/z 576.2 occurred with minor intensity.
Figure 5.
MS/MS daughter ions of Cu-pheophytin a.
Figure 6.
MS/MS daughter ions of Cu-pheophytin a′.
Table 4 shows MS/MS fragmentation patterns of 152-Me-phytol-rhodin g7 ester and 152-Me-phytol-chlorin e6 ester using fixed collision energy of 15 eV. The ions with m/z 857.6 and 843.6 represent the loss of a carboxylic group from the respective molecular ion, while the loss of a methoxy group from ions 857.6 and 843.6 yields the ions 825.5 and 811.6, respectively. The loss of the phytyl ester chain from 825.5, 811.6, 857.6, and 843.6 yields the ions 475.2, 461.2, 507.2, and 493.2, respectively. MS/ MS fragmentation patterns of Cu-pyropheophytin a used a fixed collision energy of 30 eV. The loss of phytyl yielded the fragment 594.2 (M − phytyl), the loss of the carboxy phytyl yielded the mass 550.2 (M − COO-phytyl), and the loss of the phytyl ester chain yielded the mass 522.2 (M − CH2CH2COO-phytyl). Less relevant due to their low concentration in bright green table olives are Cu-pheophytin b and Cu-pyropheophytin b. The MS/ MS fragmentation pattern of Cu-pheophytin b is 945.5 and of Cu-pyropheophytin b is 887.5. The main daughter fragments obtained for Cu-pheophytin b (Table 4) are 666.2 (M − phytyl) and 590.1 due to the loss of −COO-phytyl and −COOCH3 of the R4, while the main fragments obtained for Cu-pyropheophytin b (Table 4) are 608.1 (M − phytyl), 564.2 (M − COO-phytyl), and 536.1 (M − CH2CH2COO-phytyl).
In regard to 152-Me-phytol-isochlorin e4 and Cu-152-Me-phytol-isochlorin e4, these compounds were identified previously as formylpheophytin a and its Cu derivative by their respective molecular ions.11,27 However, both mass accurate m/z values obtained herein are consistent with a structure with a −CH2COOCH3 group in R4 and −H in R5 (152-Me-phytol-isochlorin e4 and Cu-152-Me-phytol-isochlorin e4, respectively) or with an ethyl group (−CH2CH3) and a carboxylic group (−COOH) in R5 (152-Et-phytol-chlorin e4 and Cu-152-Et-phytol-chlorin e4, respectively) (Table 4). The two first options (152-Me-phytol-isochlorin e4 and Cu-152-Me-phytol-isochlorin e4) are more likely to occur from the loss of the carboxylic group of the respective chlorin e6. Nevertheless, we could not acquire an appropriate MS/MS fragmentation pattern for these pigments that gave us a confident identification. Further MS/MS characterization is needed.
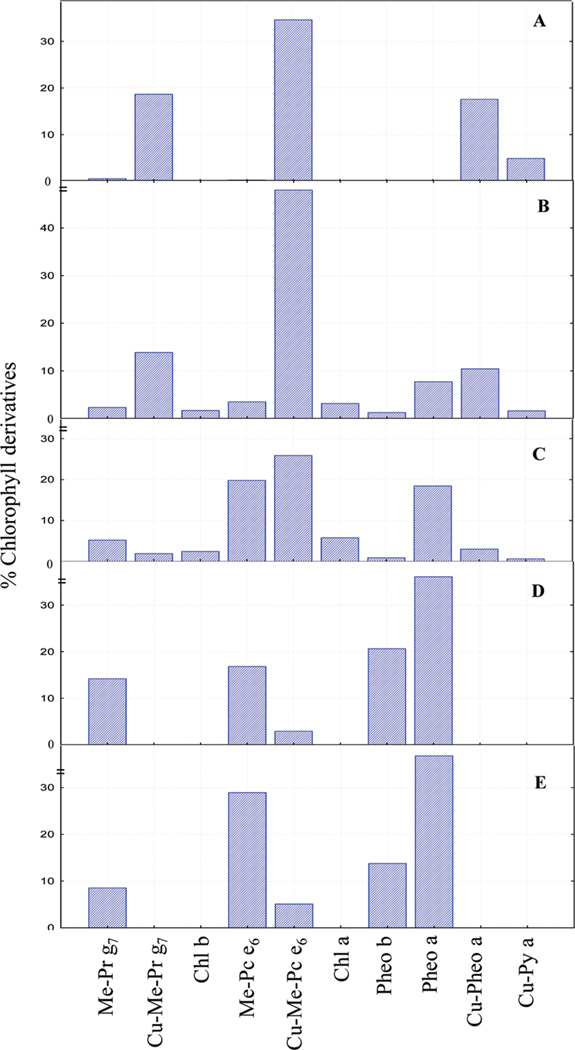
The quantitative analysis of the pigments present in the table olive samples (Figure 7) shows that the range of concentrations of the major pigments of bright green table olives were Cu-152-Me-phytol-chlorin e6 ester (26–48%), Cu-152-Me-phytol-rhodin g7 ester (2–18%), Cu-pheophytin a (3–18%), pheophytin a (0–18%), Cu-pyropheophytin a (1–5%), chlorophyll a (0–6%), 152-Me-phytol-rhodin g7 ester (1–2%), and chlorophyll b (0–2%). The major pigments present in the Spanish table olives, in terms of concentration, were pheophytin a (36–37%), pheophytin b (13–20%), 152-Me-phytol-chlorin e6 ester (17–29%), and 152-Me-phytol-rhodin g7 ester (8–15%).
Figure 7.
Percent of major pigments present in the five samples, coded A–E. Note: Me-Pr g7, 152-Me-phytyl-rhodin g7 ester; Cu-Me-Pr g7, Cu-152-Me-phytyl-rhodin g7 ester; chl b, chlorophyll b; Me-Pc e6 ester, 152-Me-phytyl-chlorin e6 ester; Cu-Me-Pc e6, Cu-152-Me-phytyl-chlorin e6 ester; chl a, chlorophyll a; Pheo b, pheophytin b; Pheo a, pheophytin a; Cu-pheo a, Cu-pheophytin a; Cu-py a, Cu-pyropheophytin a.
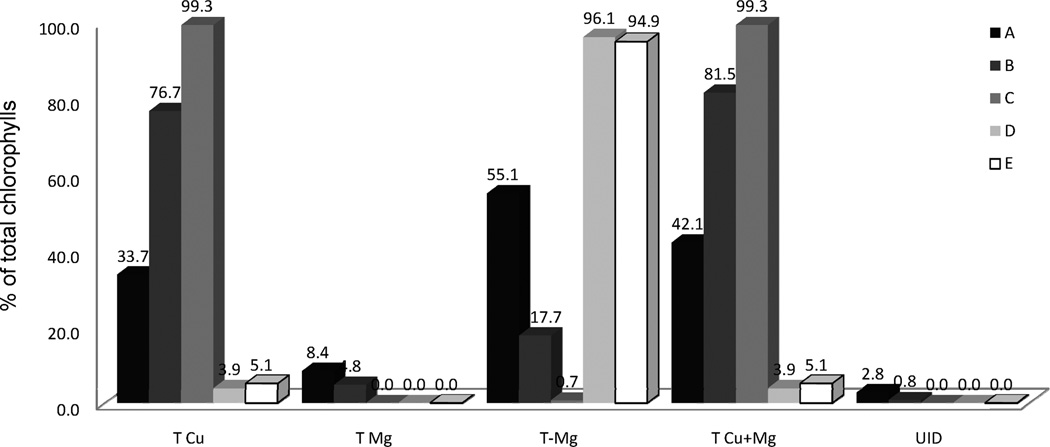
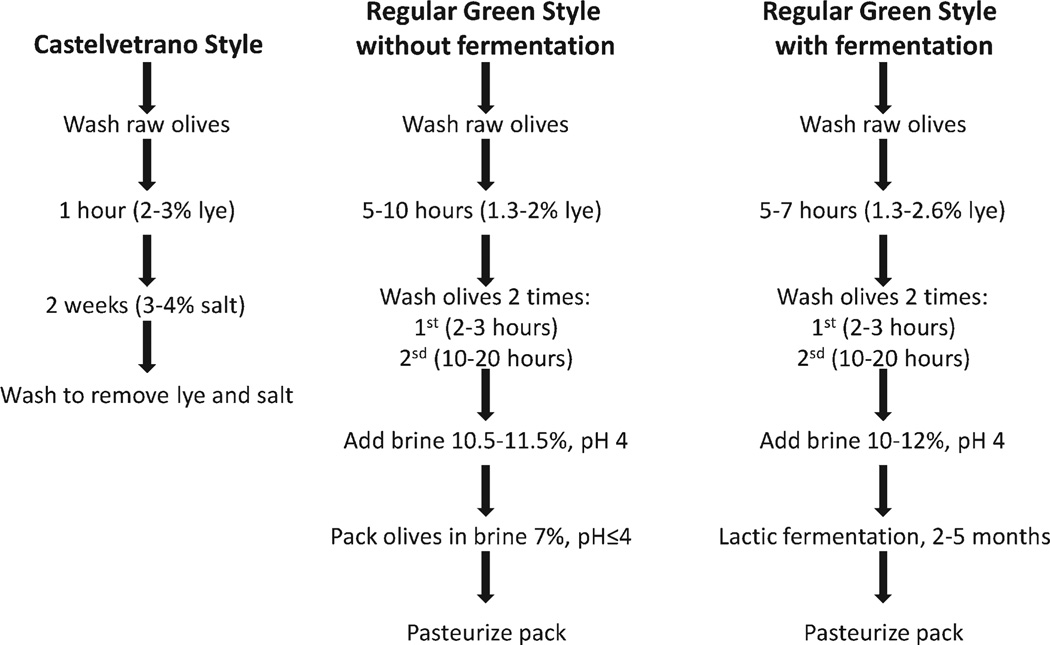
The relative amount of various chlorophyll derivatives, with or without metal within the porphyrin ring, allows differentiation among the samples. Thus, Figure 8 shows the percent of Cu-metallo–chlorophylls (T Cu), Mg-metallo–chlorophylls (T Mg), chlorophylls without magnesium (T-Mg), Cu-metallo–chlorophylls plus Mg-metallo–chlorophylls (T Cu+Mg), and an unknown compound (UID). From this comparison, we have observed that bright green table olives contain 33–99% of Cu-metallo–chlorophyll complexes, while Spanish table olives have approximately 95% of chlorophyll derivatives without the magnesium porphyrin complex and approximately 5% of Cu–porphyrin complex. Furthermore, bright green table olives contain small quantities of Mg-metallo–chlorophylls (0–8% due to chlorophylls a and b) in contrast to Spanish table olives that do not contain detectable levels of these compounds. The differences may be attributed to the different methods of the industrial processing of table olives (Figure 9). The Castelvetrano style (samples coded A and C) is manufactured without fermentation and requires approximately 2 weeks for processing, although the shelf life of its table olives is only a few weeks under warm storage conditions.24 The presence of Mg-metallo–chlorophylls (5–8%) in samples B and C implies that the processing style was Castelvetrano. Sample A, however, does not contain Mg-metallo–chlorophylls, which can be due to a modification of the Castelvetrano processing style to prolong the shelf life such as pasteurization. In contrast, the Spanish style olive, based on a lactic fermentation process (Figure 9), requires 2–5 months24,25 and results in the disappearance of chlorophylls a and b in less than 120 days.26
Figure 8.
Percents of total Cu-metallo–chlorophylls (T Cu), total Mg-metallo–chlorophylls (T Mg), total chlorophylls without magnesium (T-Mg), and total Cu-metallo–chlorophylls plus Mg-metallo–chlorophylls (T Cu+Mg) and the unknown peak (UID) for each sample studied.
Figure 9.
Scheme of the three different processing styles for table olives. Note: Source, refs 24, 25.
Previous researchers10–12,27,28 have reported a GS alteration of the Gordal variety of table olives where the color alteration is due to Cu-metallo–chlorophylls derivatives. One report shows the percent of total Cu-metallo–chlorophylls a with respect to the total of a series after the lactic fermentation with amounts ranging from 2% to 11%.27 These data are lower than our observation for three commercially available bright green table olive samples (36.1–99.8%).
We have found that the total elemental Cu from the quantification of Cu-metallo–chlorophyll complexes present in the three bright green table olive samples varies between 1.3 mg and 4.7 mg/kg, and within the range of mineral Cu (1.7–11.0 mg/ kg) quantified in different varietal table olives29 and fresh olives (3.5–7.2 mg/kg).30 Thus, there appears to be adequate quantities of Cu native to the fruit to allow for regreening to occur.10
The copper absorbed by the olive fruit could arise from copper in the soil but most likely derives from the content of copper in the pesticides applied to prevent soapy olive (fungus infection by Gloeosporium olivarum) and “repilo” (fungus infection by Cycloconium oleaginum).
As such, the bright green color of table olives is mostly due to the existence of Cu within porphyrin ring, but the presence of Cu-metallo–chlorophylls has not been reported in fresh olives, fruits, or leaves. However, these compounds can be generated using copper salts (CuCl2, CuSO4) during the industrial processing of food4–7 or generated during the commercial processing of table olives with endogenous copper absorbed by the fruit.27 We assume that the Cu–chlorophyll compounds are produced without adding copper salts and that the industrial processing has been carried out according to international rules and regulations.31,32
Olives with GS alteration might be a defect created by the partial formation of metallo–chlorophyll pigments during the manufacture of green table olives resulting in a color that is not uniform. Although color is important for consumer acceptance, the bright green table olives provide a source of metallo– chlorophyll derivatives (Cu-Me-phytol-chlorin e6, 26–48%; and Cu-pheophytin a, 3–18%) that have been reported to possess an inhibitory activity against mutagenesis and higher antioxidant activity as well.33 Further investigation is needed to understand the processing method for regreening table olives that will result in optimal uniformity in color and consumer acceptance.
ACKNOWLEDGMENT
We thank Dr. Gandul-Rojas for reviewing this manuscript.
Funding Sources
We wish to thank the “Ministerio de Educación y Ciencia (MEC)” and “Fundación Española para la Ciencia y la Tecnología (FECYT)” (Spain) for the fellowship EX2008-0106.
REFERENCES
- 1.Humphrey AM. Chlorophyll. Food Chem. 1980;5:57–67. [Google Scholar]
- 2.Jones ID, White RC, Gibbs E, Butler LS, Nelson LA. Experimental formation of zinc and copper complexes of chlorophylls derivatives in vegetables tissue by thermal processing. J. Agric. Food Chem. 1977;25:149–143. doi: 10.1021/jf60209a030. [DOI] [PubMed] [Google Scholar]
- 3.Von Elbe JH, Huang AS, Attoe EL, Nank WK. Pigment composition and color of conventional Veri-Green canned beans. J. Agric. Food Chem. 1986;34:52–54. [Google Scholar]
- 4.Segner WP, Ragusa TJ, Nank WK, Hoyle WC. Process for the preservation of green color in canned vegetables. U.S. patent 4,473,591. 1984 [Google Scholar]
- 5.Hekal IM, Erlandson PM. Coating and container for retention of green vegetables. U.S. patent 4,615,924. 1986 [Google Scholar]
- 6.Leake LH, Kirk LK. Method for color preservation in canned vegetables. U.S. patent 5,114,724. 1992 [Google Scholar]
- 7.LaBorde LF, von Elbe JH. Method for improving the color of containerized green vegetables. U.S. patent 5,482,727. 1996 [Google Scholar]
- 8.Minguez-Mosquera MI, Gandul-Rojas B, Garrido-Fernandez J. Preparation of Cu (II) complexes of oxidized chlorophylls and their determination by thin-layer and high-performance liquid chromatography. J. Chromatogr., A. 1996;731:261–271. [Google Scholar]
- 9.Minguez-Mosquera MI, Gallardo-Guerrero L. Anomalous transformation of chloroplastic pigments in gordal variety olives during processing for table olives. J. Food Prot. 1995;58:1241–1248. doi: 10.4315/0362-028X-58.11.1241. [DOI] [PubMed] [Google Scholar]
- 10.Minguez-Mosquera MI, Gallardo-Guerrero L, Hornero-Mendez D, Garrido-Fernandez J. Involvement of copper and zinc ions in green staining of table olives of the variety Gordal. J. Food Prot. 1995;58:564–569. doi: 10.4315/0362-028X-58.5.564. [DOI] [PubMed] [Google Scholar]
- 11.Gandul-Rojas B, Gallardo-Guerrero L, Minguez-Mosquera MI. Identification of oxidized chlorophylls and metallochlorophyllic complexes of copper in table olives (var. Gordal) with green staining alteration. J. Food Prot. 1999;62:1172–1177. doi: 10.4315/0362-028x-62.10.1172. [DOI] [PubMed] [Google Scholar]
- 12.Gallardo-Guerrero L, Hornero-Mendez D, Minguez-Mosquera MI. Pectin as possible source of the copper involved in the green staining alteration of cv. Gordal table olives. J. Agric. Food Chem. 2002;50:6746–6751. doi: 10.1021/jf025682j. [DOI] [PubMed] [Google Scholar]
- 13.Huang SC, Hung CF, Wu WB, et al. Determination of chlorophylls and their derivatives in Gynostemma pentaphyllum Makino by liquid chromatography-mass spectrometry. J. Pharm. Biomed. Anal. 2008;48:105–112. doi: 10.1016/j.jpba.2008.05.009. [DOI] [PubMed] [Google Scholar]
- 14.Pickering MD, Keely BJ. Alkyl sulfur chlorophyll derivatives: Preparation and liquid chromatography-multistage tandem mass spectrometric characterisation of analogues of naturally occurring sedimentary species. Org. Geochem. 2007;39:1046–1050. [Google Scholar]
- 15.Egner PA, Stansbury KH, Snyder EP, et al. Identification and characterization of chlorin e(4) ethyl ester in sera of individuals participating in the chlorophyllin chemoprevention trial. Chem. Res. Toxicol. 2000;13:900–906. doi: 10.1021/tx000069k. [DOI] [PubMed] [Google Scholar]
- 16.Mendes-Pinto MM, Ferreira ACS, Caris-Veyrat C, et al. Carotenoid, chlorophyll, and chlorophyll-derived compounds in grapes and Port wines. J. Agric. Food Chem. 2005;53:10034–10041. doi: 10.1021/jf0503513. [DOI] [PubMed] [Google Scholar]
- 17.Sievers G, Hynninen PH. Thin-layer chromatography of chlorophylls and their derivatives on cellulose layers. J. Chromatogr. 1977;134:359. doi: 10.1016/s0021-9673(00)88534-9. [DOI] [PubMed] [Google Scholar]
- 18.Mínguez-Mosquera MI, Garrido-Fernández J. Chlorophyll and carotenoid presence in olive fruit (Olea Europaea L.) J. Agric. Food Chem. 1989;37:1–7. [Google Scholar]
- 19.Brown MB, Forsythe AB. Robust tests for the equality of variances. J. Am. Stat. Assoc. 1974;69:364–367. [Google Scholar]
- 20.Gauthier-Jaques A, Borltlik K, Hau J, Fay LB. Improved method to track chlorophyll degradation. J. Agric. Food Chem. 2001;49:1117–1122. doi: 10.1021/jf000384c. [DOI] [PubMed] [Google Scholar]
- 21.Mortensen A, Geppel A. HPLC-MS analysis of green food colorant sodium copper chlorophyllin. Innovative Food Sci. Emerging Technol. 2007;8:419–425. [Google Scholar]
- 22.Van Breemen RB, Canjura FL, Schwartz SJ. Identification of chlorophyll derivatives by mass spectrometry. J. Agric. Food Chem. 1991;39:1452–1456. [Google Scholar]
- 23.Hynninen PH. Chlorophylls. IV. Preparation and purification of some derivatives of chlorophylls a and b. Acta Chem. Scand. 1973;27:1771–1780. [Google Scholar]
- 24.Kailis SG, Harris D. Producing Table Olives. Collingwood VIC (Victoria), Australia: Edit Landlinks Press; 2007. ISBN 9780643092037. [Google Scholar]
- 25.Garrido Fernández A, Fernández Díez MJ, Adams MR. Table Olives: Production and Processing. Technology & Engineering. New York: Springer; 1997. ISBN 0412718103. [Google Scholar]
- 26.Mínguez-Mosquera MI, Gandul-Rojas B, Mínguez-Mosquera J. Mechanism and kinetics of the degradation of chlorophylls during the processing of green table olives. J. Agric. Food Chem. 1994;42:1089–1095. [Google Scholar]
- 27.Gallardo-Guerrero L, Minguez-Mosquera MI, Gandul-Rojas B. Physicochemical conditions modulating the pigment profile in fresh fruit (Olea europea var. Gordal) and favoring interaction between oxidized chlorophylls and endogenous Cu. J. Agric. Food Chem. 2007;55:1823–1831. doi: 10.1021/jf0630771. [DOI] [PubMed] [Google Scholar]
- 28.Gallardo-Guerrero L, Milicua JCG, Salvador AM, Jaren-Galan M, Minguez-Mosquera MI. Pigment-lipoprotein complexes in table olives (Cv. Gordal) with green staining alteration. J. Agric. Food Chem. 2003;51:1724–1727. doi: 10.1021/jf025965b. [DOI] [PubMed] [Google Scholar]
- 29.Lopez A, Garcia P, Garrido A. Multivariate characterization of table olives according to their mineral nutrient composition. Food Chem. 2008;106:369–378. [Google Scholar]
- 30.Biricik GF, Basoglu F. Determination of mineral contents in some olives (Samanli, Domat, Manzanilla, Ascolana) varieties. Gida. 2006;3:67–75. [Google Scholar]
- 31.International Olive Oil Council (IOOC) Trade standards applying to table olives. COI/OT/NC No. 1. Spain: Madrid; 2004. [Google Scholar]
- 32.IOOC/CODEX. Codex standard for table olives (CODEX STAN 66-1981) 1981 [Google Scholar]
- 33.Ferruzzi MG, Bohm V, Courtney PD, Schwartz SJ. Antioxidant and antimutagenic activity of dietary chlorophyll derivatives determined by radical scavenging and bacterial reverse mutagenesis assays. Food Chem. Toxicol. 2002;67:2589–2595. [Google Scholar]
- 34.Roca M, Mínguez-Mosquera MI, Gallardo-Guerrero L, Gandul-Rojas B. Control of olive oil adulteration with copper-chlorophyll derivatives. J. Agric. Food Chem. 2010;58:51–56. doi: 10.1021/jf902084d. [DOI] [PubMed] [Google Scholar]
- 35.Hynninen PH, Ellfolk N, Chlorophylls I. Separation and isolation of chlorophylls a and b by multiple liquid-liquid partition. Acta Chem. Scand. 1973;27:1463–1477. [Google Scholar]


