Abstract
Background
L1 cell adhesion molecule (L1CAM) and epithelial cell adhesion molecule (EPCAM) have been implicated in the development and progression of gastric cancer. The present study investigated the clinical significance of L1CAM and EPCAM in the development, progression and prognosis of gastric cancer.
Methods
Expression of L1CAM and EPCAM were examined immunochemically in 601 clinicopathologically characterized gastric cancer cases.
Results
L1CAM protein was detected in 23.9% of human non-tumor mucosa samples. All samples expressed L1CAM protein at low levels. High expression of L1CAM protein was detected in 163 (27.1%) tumors. Expression of L1CAM correlated with age, tumor location, size of tumors, Lauren’s classification, depth of invasion, lymph node and distant metastases, regional lymph node stage, Tumor-Node-Metastasis (TNM) stage and prognosis. EPCAM protein was detected in 45.7% of human non-tumor mucosa samples. All samples expressed EPCAM protein at low levels. High expression of EPCAM protein was detected in 247 (41.1%) tumors. Expression of EPCAM correlated with age, tumor location, size of tumors, Lauren’s classification, depth of invasion, lymph node and distant metastases, regional lymph node stage, TNM stage and prognosis. Cumulative 5-year survival rates of patients with high expression of both L1CAM and EPCAM were significantly lower than in patients with low expression of both.
Conclusions
Expression of L1CAM and EPCAM in gastric cancer was significantly associated with lymph node and distant metastasis, and poor prognosis. L1CAM and EPCAM proteins could be useful markers to predict tumor progression and prognosis.
Keywords: Gastric carcinoma, L1CAM, EPCAM, Immunohistochemistry, Progression, Prognosis
Introduction
Although global incidence of gastric cancer has decreased in recent years, its mortality rate in China is the highest among all tumors. The main cause of death is invasion and metastasis of tumor. Tumor invasion and metastasis is a very complicated and continuous process involving multiple steps, regulated at the molecular level by adhesion molecules, protein catabolic enzymes, cellular growth factors and various angiogenic factors. L1 cell adhesion molecule (L1CAM) is a cell adhesion molecule of the immunoglobulin superfamily of cell adhesion molecules (IgCAM), initially identified in the nervous system. Recent studies demonstrated L1CAM expression in various types of cancer, predominantly at the invasive front of tumors and metastases. Overexpression of L1CAM in normal and cancer cells increased motility, enhanced growth rate and promoted cell transformation and tumorigenicity. The epithelial cell adhesion molecule (EPCAM) is a glycoprotein of approximately 40 kD that was originally identified as a marker for carcinoma. EPCAM’s effects are not limited to cell adhesion; they include diverse processes such as signaling, cell migration, proliferation, and differentiation. Cell surface expression of EPCAM may actually prevent cell–cell adhesion.
The current study examined expression of L1CAM and EPCAM in surgical specimens of gastric carcinoma, to explore possible correlations between L1CAM and EPCAM expression and clinicopathological variables and prognosis.
Materials and methods
Cell culture and frozen tissues
Human gastric cancer cell lines AGS, MKN-28, BGC-823, HCG-27, SGC-7901, 9811P, MKN-45 and non-malignant gastric epithelial cell line GES-1 were obtained from Key Laboratory of Gastroenterology of Zhejiang Province (Hangzhou, China), and cultured in RPMI1640 containing 10% foetal bovine serum (FBS), 50U/ml penicillin and 50 μg/ml streptomycin. All cells were maintained at 37°C under an atmosphere of 5% CO2.
Patients and frozen tissue samples
Our study included 42 patients (29 male, 13 female; mean age: 59 years; range: 30–86) collected from gastrectomy specimens from the Department of Surgery, Zhejiang Provincial People’s Hospital from January 2010 and January 2011. None of the patients were treated with radiotherapy or perioperative chemotherapy, and all had undergone total gastrectomies. Resected specimens were studied pathologically according to the criteria described in the AJCC classification (2009). There were 24 tubular adenocarcinomas, 3 papillary adenocarcinomas, 10 mucinous adenocarcinomas, 5 signet-ring cell carcinomas. Two cases were categorized as stage I, 8 as stage II, 29 as stage III, and 3 as stage IV. The study items included age, sex, tumor location, tumor size, gross (Borrmann) type, gastric wall invasion, resection margin, histological type, lymph node metastasis, vascular invasion, lymphatic invasion, and perineural invasion. Fresh samples of tumor tissue, and matched normal gastric mucosa were obtained immediately after gastric resection. The samples were dissected carefully from resected specimens by a pathologist, and immediately snap-frozen in separate vials using liquid nitrogen. These frozen specimens were stored at −80°C in a tumor bank before use.
Patients and paraffin-embedded tissue samples
Gastric cancer tissues were collected from gastrectomy specimens of 601 patients from the Department of Surgery, Zhejiang Provincial People’s Hospital from January 1998 to January 2004. Tissues had been formalin-fixed and paraffin-embedded, and clinically and histopathologically diagnosed at the Departments of Gastrointestinal Surgery and Pathology. All patients had follow-up records over at least 5 years. The follow-up deadline was December 2008. Survival times were counted from the dates of surgery to the follow-up deadline or dates of death, which were mostly caused by carcinoma recurrence or metastasis. Ninety-two noncancerous human gastric tissues were obtained from gastrectomies of adjacent gastric cancers beyond margins >5 cm. Routine chemotherapy was given to patients with advanced-stage disease after operation, but no radiation treatment was administered to any patients included in our study.
Real-time quantitative RT-PCR
Expressions of L1CAM and EPCAM in 42 tumor tissue samples and matched normal gastric mucosa were confirmed by RT-PCR. Total RNA was extracted by TRIzol and cDNAs were reverse-transcribed by RevertAid TM reverse transcriptase. Real-time PCR was carried out using the ABI PRISM 7700 Sequence Detection System (Applied Biosystems) at 50°C for 2 min, 95°C for 10 min, followed by 50 cycles at 95°C for 15 s, and at 60°C for 1 min. The primers for GAPDH (224 bp) were 5′-TGAAGGTCGGAGTCAACGG-3′ (sense) and 5′- CTGGAAGATGGTGATGGGATT-3′ (antisense). The primers for L1CAM (187 bp) were 5′-TGTCCTTCCCTTTACGCCAC-3′ (sense) and 5′- GACCAAGCACAGGCATACAGG-3′ (antisense). The primers for EPCAM (101 bp) were 5′-ATAATAATCGTCAATGCCAGTG-3′ (sense) and 5′- ATTCATTTCTGCCTTCATCAC-3′ (antisense). The expression of GAPDH was used to normalize that of the target genes. Each assay was done in triplicate and the average calculated. The expression level of L1CAM/EPCAM was expressed as 2–ΔΔCt, ΔCt = Ct(Target) – Ct(GAPDH).
Tissue microarray
Blocks containing a total of 693 cases (601 cancer samples and 92 non-cancer tissue samples) were prepared as described previously [1,2].
Immunohistochemistry
Immunohistochemical analysis was used to study altered protein expression in 92 noncancerous human gastric tissue controls and 601 human gastric cancer tissues [3,4]. In brief, slides were baked at 60°C for 2 h, followed by deparaffinization with xylene and rehydration. The sections were submerged into EDTA antigenic retrieval buffer and microwaved for antigenic retrieval, after which they were treated with 3% hydrogen peroxide in methanol to quench endogenous peroxidase activity, followed by incubation with 1% bovine serum albumin to block nonspecific binding. Sections were incubated with rabbit anti-EPCAM(Epitomics), and with mouse anti-L1CAM (Abcam), overnight at 4°C. Normal goat serum was used as a negative control. After washing, tissue sections were treated with secondary antibody. Tissue sections were then counterstained with hematoxylin, dehydrated, and mounted. Cytoplasm with L1CAM and EPCAM was stained as buffy. The degree of immunostaining was reviewed and scored independently by two observers based on the proportion of positively stained tumor cells and intensity of staining [5-7].
Statistical analysis
All statistical analyses were performed using SPSS16.0 software. Measurement data were analyzed using Student’s t test, while categorical data were studied using χ2 or Fisher exact tests. Survival curves were estimated using the Kaplan–Meier method; the log-rank test was used to compute differences between curves. Multivariate analysis using the Cox proportional hazards regression model was performed to assess prognostic values of protein expression. Correlation coefficients between protein expression and clinicopathological findings were estimated using the Pearson correlation method. Statistical significance was set at P < 0.05.
Results
Expression of L1CAM and EPCAM mRNA in gastric tumor tissue and cell lines
L1CAM and EPCAM mRNA were significantly upregulated in AGS, MKN-28, BGC-823, HCG-27, SGC-7901, 9811P and MKN-45 cell lines compared with the non-malignant gastric epithelial cell line GES-1 (P < 0.05, Figure 1, Figure 2). In 42 gastric tumor tissue samples and matched normal gastric mucosa, average expressions of L1CAM were 0.0403 ± 0.0069 and 0.0093 ± 0.0010, respectively, and were significant different (t = 2.845, P = 0.006). L1CAM was over-expressed in 25 gastric tumor tissue samples compared with matched normal gastric mucosa. In 42 gastric tumor tissue samples and matched normal gastric mucosa, the average expressions of EPCAM were 0.4199 ± 0.0485 and 0.1759 ± 0.0144, respectively, and were significantly different (t = 3.122, P = 0.002). EPCAM was over-expressed in 27 gastric tumor tissue samples compared with matched normal gastric mucosa.
Figure 1.
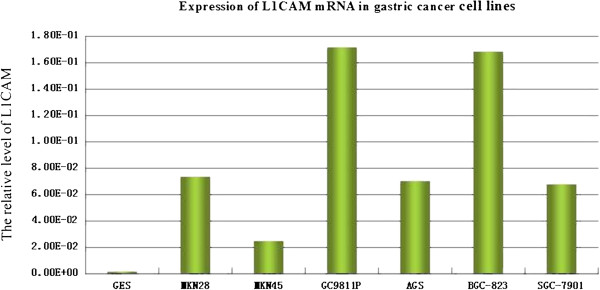
Expression of L1CAM mRNA in gastric cancer cell lines.
Figure 2.

Expression of EPCAM mRNA in gastric cancer cell lines.
Expression of L1CAM and EPCAM in archived gastric cancer tissue and non-cancer mucosa
L1CAM protein was detected in 22/92 (23.9%) human non-tumor mucosa samples; all samples expressed L1CAM protein at low levels. High L1CAM protein expression was detected in 163 (27.1%) tumors. L1CAM was localized mainly in the cytoplasm of primary cancer cells (Figure 3).
Figure 3.

Immunohistochemical staining for L1CAM in gastric cancer lesions (601 case) and noncancerous tissues (92 case). A: L1CAM was negative in noncancerous tissues, B: L1CAM was highly expressed in well differentiated adenocarcinoma, C: L1CAM was highly expressed in moderately differentiated adenocarcinoma, D: L1CAM was highly expressed in poorly differentiated adenocarcinoma.
EPCAM protein was detected in 42/92 (45.7%) human non-tumor mucosa samples; all samples expressed EPCAM protein at a low level. High EPCAM protein expression was detected in 247 (41.1%) tumors, EPCAM was localized mainly in the cytoplasm of primary cancer cells (Figure 4).
Figure 4.

Immunohistochemical staining for EPCAM in gastric cancer lesions (601 case) and noncancerous tissues (92 case). A: EPCAM was negative in noncancerous tissues, B: EPCAM was highly expressed in well differentiated adenocarcinoma, C: EPCAM was highly expressed in moderately differentiated adenocarcinoma, D: EPCAM was highly expressed in poorly differentiated adenocarcinoma.
L1CAM and EPCAM overexpression and clinicopathological features
Expression of L1CAM correlated with age, tumor location, tumor size, Lauren’s classification, depth of invasion, lymph node and distant metastases, regional lymph node stage and TNM stage (P < 0.05). L1CAM expression did not correlate with sex, differentiation, or histological classification (P>0.05; Table 1).
Table 1.
Relationship of L1CAM expression with pathological parameters of tumor
|
Clinical parameters |
L1CAM |
|||
|---|---|---|---|---|
| Low | High | t/χ2/r | P | |
| Age(yrs) |
57.86 ± 11.88 |
61.20 ± 11.85 |
3.065 |
0.002 |
| Gender |
|
|
3.386 |
0.066 |
| Male |
321 (75.0%) |
107 (25.0%) |
|
|
| Female |
117 (67.6%) |
56 (32.4%) |
|
|
| Location |
|
|
13.39 |
0.001 |
| Proximal |
54 (64.3%) |
30 (35.7%) |
|
|
| Middle |
150 (67.3%) |
73 (32.7%) |
|
|
| Distal |
234 (79.6%) |
60 (20.4%) |
|
|
| Size |
|
|
26.99 |
0.0001 |
| <5 cm |
283 (80.9%) |
67 (19.1%) |
|
|
| ≥5 cm |
155 (61.8%) |
96 (38.2%) |
|
|
| Lauren classification |
|
|
94.92 |
0.0001 |
| Intestinal |
271 (90.6%) |
28 (9.4%) |
|
|
| Diffuse |
167 (55.3%) |
135 (44.7%) |
|
|
| Histology |
|
|
5.623 |
0.131 |
| Papillary adenocarcinoma |
26 (89.7%) |
3 (10.3%) |
|
|
| Tubular adenocarcinoma |
317 (72.2%) |
122 (27.8%) |
|
|
| Mucinous adenocarcinoma |
29 (78.4%) |
8 (21.6%) |
|
|
| Signet-ring cell carcinoma |
66 (68.8%) |
30 (31.2%) |
|
|
| Histologic differentiation |
|
|
7.67 |
0.053 |
| Well |
17 (100%) |
0 (0.0%) |
|
|
| Moderately |
129 (73.7%) |
46 (26.3%) |
|
|
| Poorly |
290 (71.3%) |
117 (28.7%) |
|
|
| Others |
2 (100.0%) |
0 (0.0%) |
|
|
| Invasion depth |
|
|
46.55 |
0.0001 |
| T1 |
72 (90.0%) |
8 (10.0%) |
|
|
| T2 |
123 (87.2%) |
18 (12.8%) |
|
|
| T3 |
222 (65.7%) |
116 (34.3%) |
|
|
| T4 |
21 (50.0%) |
21 (50.0%) |
|
|
| TNM stages |
|
|
85.48 |
0.0001 |
| I |
119 (93.7%) |
8 (6.3%) |
|
|
| II |
121 (89.6%) |
14 (10.4%) |
|
|
| III |
141 (61.0%) |
90 (39.0%) |
|
|
| IV |
57 (52.8%) |
51 (47.2%) |
|
|
| Lymphatic metastasis |
|
|
43.59 |
0.0001 |
| No |
195 (88.6%) |
25 (11.4%) |
|
|
| Yes |
243 (63.8%) |
138 (36.2%) |
|
|
| Regional lymph nodes |
|
|
59.62 |
0.0001 |
| PN0 |
195 (88.6%) |
25 (11.4%) |
|
|
| PN1 |
142 (71.7%) |
56 (28.3%) |
|
|
| PN2 |
79 (58.5%) |
56 (41.5%) |
|
|
| PN3 |
22 (45.8%) |
26 (54.2%) |
|
|
| Distant metastasis |
|
|
15.376 |
0.0001 |
| No |
387 (75.9%) |
123 (24.1%) |
|
|
| Yes | 51 (56.0%) | 40 (44.0%) | ||
Expression of EPCAM correlated with age, tumor location, tumor size, Lauren’s classification, depth of invasion, lymph node and distant metastases, regional lymph node stage and TNM stage (P < 0.05). EPCAM expression did not correlate with sex, differentiation, or histological classification (P > 0.05; Table 2).
Table 2.
Relationship of EPCAM expression with pathological parameters of tumor
|
Clinical parameters |
EPCAM |
|||
|---|---|---|---|---|
| Low | High | t/χ2/r | P | |
| Age(yrs) |
56.85 ± 11.4 |
61.51 ± 12.22 |
4.787 |
0.0001 |
| Gender |
|
|
0.805 |
0.370 |
| Male |
257 (60.0%) |
171 (40.0%) |
|
|
| Female |
97 (56.1%) |
76 (43.9%) |
|
|
| Location |
|
|
10.37 |
0.006 |
| Proximal |
37 (44.0%) |
47 (56.0%) |
|
|
| Middle |
130 (58.3%) |
93 (41.7%) |
|
|
| Distal |
187 (63.6%) |
107 (36.4%) |
|
|
| Size |
|
|
40.47 |
0.0001 |
| <5 cm |
244 (69.7%) |
106 (30.3%) |
|
|
| ≥5 cm |
110 (43.8%) |
141 (56.2%) |
|
|
| Lauren classification |
|
|
198.1 |
0.0001 |
| Intestinal |
261 (87.3%) |
38 (12.7%) |
|
|
| Diffuse |
93 (30.8%) |
209 (69.2%) |
|
|
| Histology |
|
|
3.136 |
0.371 |
| Papillary adenocarcinoma |
20 (69.0%) |
9 (31.0%) |
|
|
| Tubular adenocarcinoma |
254 (57.9%) |
185 (42.1%) |
|
|
| Mucinous adenocarcinoma |
19 (51.4%) |
18 (48.6%) |
|
|
| Signet-ring cell carcinoma |
61 (63.5%) |
35 (36.5%) |
|
|
| Histologic differentiation |
|
|
6.323 |
0.097 |
| Well |
12 (70.6%) |
5 (29.4%) |
|
|
| Moderately |
113 (64.6%) |
62 (35.4%) |
|
|
| Poorly |
227 (55.8%) |
180 (44.2%) |
|
|
| Others |
2 (100.0%) |
0 (0.0%) |
|
|
| Invasion depth |
|
|
107.1 |
0.0001 |
| T1 |
73 (91.2%) |
7 (8.8%) |
|
|
| T2 |
113 (80.1%) |
28 (19.9%) |
|
|
| T3 |
160 (47.3%) |
178 (52.7%) |
|
|
| T4 |
8 (19.0%) |
34 (81.0%) |
|
|
| TNM stages |
|
|
201.6 |
0.0001 |
| I |
119 (93.7%) |
8 (6.3%) |
|
|
| II |
116 (85.9%) |
19 (14.1%) |
|
|
| III |
99 (42.9%) |
132 (57.1%) |
|
|
| IV |
20 (18.5%) |
88 (81.5%) |
|
|
| Lymphatic metastasis |
|
|
119.1 |
0.0001 |
| No |
193 (87.7%) |
27 (12.3%) |
|
|
| Yes |
161 (42.3%) |
220 (57.5%) |
|
|
| Regional lymph nodes |
|
|
182.6 |
0.0001 |
| PN0 |
193 (87.7%) |
27 (12.3%) |
|
|
| PN1 |
118 (59.6%) |
80 (40.4%) |
|
|
| PN2 |
42 (31.1%) |
93 (68.9%) |
|
|
| PN3 |
1 (2.1%) |
47 (97.9%) |
|
|
| Distant metastasis |
|
|
53.42 |
0.0001 |
| No |
332 (65.1%) |
178 (34.9%) |
|
|
| Yes | 22 (24.2%) | 69 (75.8%) | ||
Correlation between L1CAM and EPCAM expression and patient prognosis
As TNM stage, lymph node and distant metastasis are used as prognostic factors for gastric cancer [8], we further analyzed the correlation between L1CAM/EPCAM expression and patient prognosis according to Lauren classification, TNM stage and regional lymph nodes.
Kaplan–Meier curves with univariate analyses (log-rank) for patients with low L1CAM expression versus high L1CAM expression tumors according to Lauren classification, showed significant differences (Table 3, Figure 5), as did Kaplan–Meier curves with univariate analyses (log-rank) for patients with low L1CAM expression versus high L1CAM expression tumors according to regional lymph nodes. Cumulative 5-year survival rates for patients with low L1CAM were significantly higher than in patients with high L1CAM expression among those in PN0 and PN1 stages (Table 3, Figure 6). Kaplan–Meier curves with univariate analyses (log-rank) for patients with low L1CAM expression versus high L1CAM expression tumors according to TNM stage, showed cumulative 5-year survival rates for patients with low L1CAM were significantly higher than in patients with high L1CAM expression among those in stage I , stage II and stage III (Table 3, Figure 7).
Table 3.
Correlation between the expression of L1CAM and prognosis
| Low expression of L1CAM | High expression of L1CAM | χ2 | P | |
|---|---|---|---|---|
| Intestinal-type |
68.3% |
35.7% |
22.83 |
0.001 |
| Diffuse-type |
10.8% |
8.9% |
7.86 |
0.005 |
| PN0 |
79.5% |
28.0% |
59.06 |
0.0001 |
| PN1 |
29.6% |
16.1% |
19.1 |
0.0001 |
| PN2 |
12.7% |
10.7% |
2.47 |
0.116 |
| PN3 |
9.1% |
0% |
2.16 |
0.14 |
| Stage I |
89.1% |
62.5% |
6.95 |
0.008 |
| Stage II |
62.0% |
33.3% |
21.86 |
0.0001 |
| Stage III |
18.6% |
15.9% |
8.45 |
0.004 |
| Stage IV | 3.5% | 0% | 7.003 | 0.08 |
Figure 5.
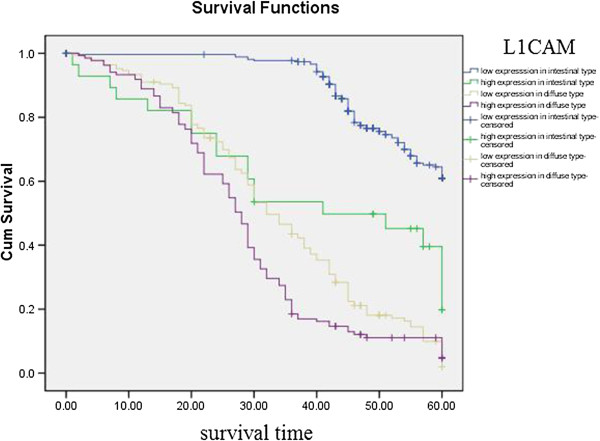
Kaplan-Meier curves with univariate analyses (log-rank) for patients with low L1CAM expression versus high L1CAM expression tumors according to Lauren classification.
Figure 6.
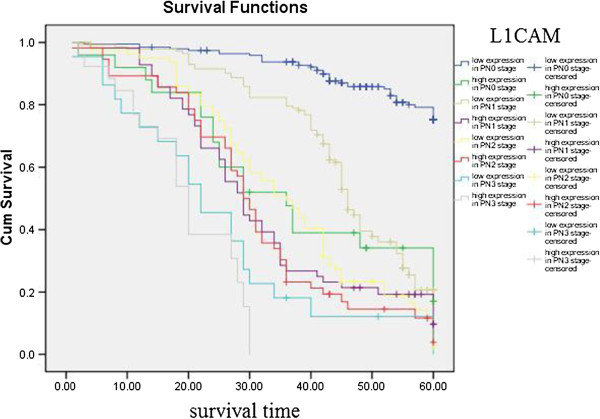
Kaplan-Meier curves with univariate analyses (log-rank) for patients with low L1CAM expression versus high L1CAM expression tumors according to regional lymph nodes.
Figure 7.
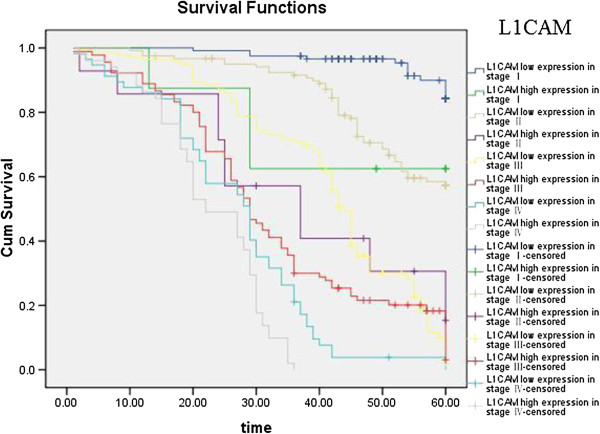
Kaplan-Meier curves with univariate analyses (log-rank) for patients with low L1CAM expression versus high L1CAM expression tumors according to TNM stage.
Kaplan–Meier curves with univariate analyses (log-rank) for patients with low EPCAM expression versus high EPCAM expression tumors according to Lauren classification and regional lymph nodes showed cumulative 5-year survival rates for patients with low EPCAM was significantly higher than for patients with high EPCAM expression (Figures 8, 9; Table 4). Kaplan–Meier curves with univariate analyses (log-rank) for patients with low EPCAM expression versus high EPCAM expression tumors according to TNM stage, showed cumulative 5-year survival rates for patients with low EPCAM were significantly higher than in patients with high EPCAM expression among those in stage I , stage II and stage III (Table 4, Figure 10).
Figure 8.
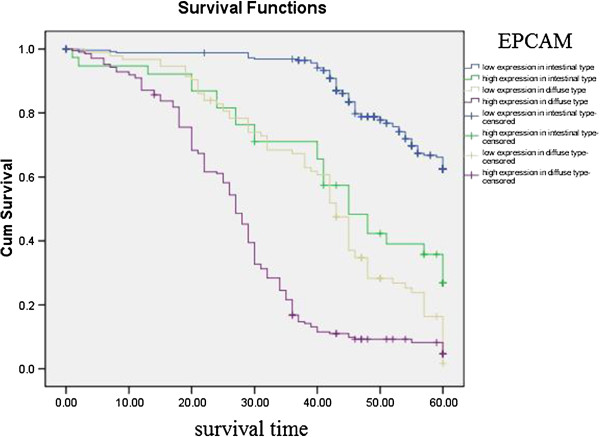
Kaplan-Meier curves with univariate analyses (log-rank) for patients with low EPCAM expression versus high EPCAM expression tumors according to Lauren classification.
Figure 9.
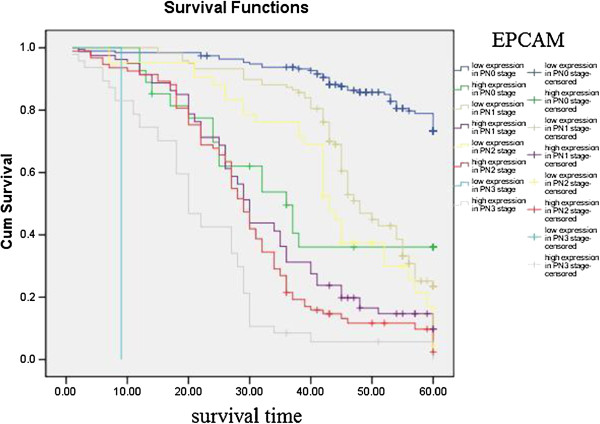
Kaplan-Meier curves with univariate analyses (log-rank) for patients with low EPCAM expression versus high EPCAM expression tumors according to regional lymph nodes.
Table 4.
Correlation between the expression of EPCAM and prognosis
| Low expression of EPCAM | High expression of EPCAM | χ2 | P | |
|---|---|---|---|---|
| Intestinal-type |
6.9.7% |
34.2% |
29.15 |
0.001 |
| Diffuse-type |
12.9% |
8.6% |
37.11 |
0.001 |
| PN0 |
78.2% |
40.7% |
35.77 |
0.001 |
| PN1 |
33.1% |
15.0% |
37.72 |
0.001 |
| PN2 |
19.0% |
8.6% |
17.31 |
0.001 |
| PN3 |
4.3% |
0% |
3.21 |
0.073 |
| Stage I |
89.1% |
62.5% |
4.89 |
0.027 |
| Stage II |
60.3% |
47.4% |
7.648 |
0.006 |
| Stage III |
22.2% |
12.9% |
35.58 |
0.0001 |
| Stage IV | 0% | 2.3% | 0.268 | 0.605 |
Figure 10.

Kaplan-Meier curves with univariate analyses (log-rank) for patients with low EPCAM expression versus high EPCAM expression tumors according to TNM stage.
Factors with possible prognostic effects in gastric carcinoma were analyzed by Cox regression analysis. The study revealed that depth of invasion (P=0.007), lymph node (P = 0.009) and distant metastasis (P = 0.01), TNM stage (P = 0.008), expression of L1CAM (P = 0.007), and of EPCAM (P = 0.009) were independent prognostic factors in patients with gastric carcinoma. However, the location of the tumor, tumor size, histological type, differentiation, and vessel invasion had no prognostic value.
Association among expression of L1CAM and EPCAM
Three hundred and sixteen gastric cancer cases had low expression of both L1CAM and EPCAM; 125 gastric cancer cases had high expression of both L1CAM and EPCAM. L1CAM and EPCAM expressions were significantly correlated (χ2 = 117.0, P = 0.0001). Cumulative 5-year survival rates of patients with high expression of both L1CAM and EPCAM were significantly lower than in patients with low expression of both (60.1% vs 11.2%, χ2 = 261.52, P = 0.0001).
Discussion
Tumor invasion and metastasis is a very complicated and continuous process involving multiple steps, regulated at the molecular level by adhesion molecules, protein catabolic enzymes, cellular growth factors and various angiogenic factors.
The L1 cell adhesion molecule (L1CAM) belongs to the immunoglobulin superfamily and was originally identified in the nervous system. Recent studies demonstrated L1CAM expression in various types of cancer, predominantly at the invasive front of tumors and in metastases, which indicates its involvement in advanced stages of tumor progression. Overexpression of L1CAM in normal and cancer cells increases motility, enhances growth rate and promotes cell transformation and tumorigenicity. Moreover, L1CAM expression in tumor cells conferred the capacity to form metastases [9,10]. L1CAM was overexpressed in esophageal adenocarcinoma [11], pancreatic cancer [12,13], colorectal cancer [14], gallbladder carcinoma [15], extrahepatic cholangiocarcinoma [16], gastric cancer [17], and cholangiocarcinoma [18], notably at the invasive front of the tumors. Our study indicated L1CAM protein was highly expressed in 163 (27.1%) tumors. L1CAM was localized mainly in the cytoplasm of primary cancer cells. The present study shows L1CAM expression in tumors correlated with histologic grade, Lauren’s classification, depth of invasion, lymph node and distant metastases, and prognosis. Kodera detected L1CAM expression in 15 of 72 pT3-stage gastric cancer specimens with L1CAM expression more common in intestinal cancer types. Prognosis of patients with L1CAM+ cancer was significantly inferior, particularly among those with diffuse-type cancers [17]. Positive L1CAM expression was significantly correlated with histological grade, lymph node involvement, distant metastasis and survival [19]. Positive L1CAM expression in pancreatic ductal adenocarcinoma was associated with node involvement, vascular invasion, perineural invasion, higher degree of pain, and poor survival [13]. L1CAM expression in gallbladder carcinomas was significantly associated with high histologic grade, advanced pathologic T stage and clinical stage, and positive venous/lymphatic invasion. Multivariate analyses showed that L1CAM expression and clinical stage were independent risk factor for disease-free survival [15]. High expression of L1CAM in extrahepatic cholangiocarcinoma was detected at the invasive front of tumors and was significantly associated with perineural invasion. Univariate analysis indicated that various prognostic factors such as histologic grade 3, advanced pathologic T stage and clinical stage, perineural invasion, nodal metastasis, and high L1CAM expression were risk factors predicting poorer patient survival. Multivariate analyses using Cox’s proportional hazards model showed that high L1CAM expression and nodal metastasis were independent risk factors for patient death [16]. Aberrant L1CAM expression in colorectal cancer correlated with advanced stage and presence of lymph node and distant metastases [20].
Epithelial cell adhesion molecule (EPCAM) is overexpressed in most solid cancers and it has recently been identified as a cancer stem cell marker [21]. EPCAM overexpression was observed in esophageal cancer [22], pancreatic cancer and ampullary cancer samples [23], colon cancers, gastric cancers, prostate cancers, and lung cancers [24]. Our study showed high expression of EPCAM protein was detected in 247(41.1%) gastric cancers. Further study revealed EPCAM expression correlated with age, tumor location, tumor size, Lauren’s classification, depth of invasion, lymph node and distant metastases, regional lymph node stage, TNM stage and prognosis. EPCAM was found to be overexpressed in gastric cancer tissues [25]. Patients with EPCAM expression had a significantly better 10-year survival than patients with no EPCAM expression: 42% vs 22%. Loss of EPCAM expression identifies aggressive tumors, especially in patients with stage I and II disease [26]. The high EPCAM expression group showed significantly good prognosis in both overall survival and disease-free survival compared with the low-expression group. In multivariate analysis, EPCAM expression was an independent prognostic factor, along with histology and lymph node metastasis [27]. EPCAM overexpression correlated with shorter overall survival among patients with ampullary cancer and advanced stage pancreatic cancer, and was found to correlate with tumor stage of ampullary cancer [23]. EPCAM expression in human esophageal cancer correlated with tumor depth, stage, blood-vessel invasion and infiltrative growth pattern. Survival rates for patients with tumors with high EPCAM expression was significantly higher than for patients with tumors with low EPCAM expression [22].
The most important prognostic factor for gastric cancer is lymph node metastasis [28,29]. We did not find literature about the relationship between expression of EPCAM/L1CAM and prognosis of patients according to regional lymph nodes. We therefore analyzed the relationship between expression of EPCAM/L1CAM and prognosis of patients with gastric cancer according to regional lymph nodes. Cumulative 5-year survival rates for patients with low L1CAM was significantly higher than for patients with high L1CAM expression in PN1. Cumulative 5-year survival rates for patients with low EPCAM was significantly higher than for patients with high EPCAM expression in PN0, in PN1, and in PN2. Lauren classification is helpful from an epidemiological standpoint [30], Lauren classification has been useful in evaluating the natural history of gastric carcinoma, especially with regard to incidence trends, clinicopathological correlations, and etiological precursors [31]. We investigated the intestinal and diffuse types in our study. Patients with the mixed and unclassified types were not investigated because we did not have these patients. We analyze the relationship between the expression of EPCAM/L1CAM and the prognosis of patients with gastric cancer according to Lauren classification. The cumulative 5-year survival rates for both the low-L1CAM expression group and the low-EPCAM expression group were higher than for their respective high-expression groups in intestinal-type gastric cancer and diffuse-type gastric cancer. There was no literature about the relationship between expression of EPCAM/L1CAM and prognosis of patients according to Lauren classification. To avoid biasing the prognostic value of EPCAM/L1CAM by tumor stage, we analyzed the relationship between expression of EPCAM/L1CAM and prognosis of patients with gastric cancer according to TNM stage. The cumulative 5-year survival rates for both the low-L1CAM expression group and the low-EPCAM expression group were higher than for their respective high-expression groups in stages I–III.
Our study suggests that overexpression of EPCAM and L1CAM is common in gastric cancer, and plays an important role in the progression and metastasis of gastric cancer. These results imply that EPCAM and L1CAM could be useful prognostic and survival indicators. Our study provides a basis for the development of a novel biomarker for the diagnosis and prognosis of gastric cancer.
Competing interests
The authors declared that they have no competing interests.
Authors’ contributions
Z-SZ, Z-YY and Y-YW design the study, LL, Y-XW, and H-QT carried out the Realtime quantitative RT-PCR and immunohistochemistry, Y-SS drafted the manuscript. All authors read and approved the final manuscript.
Contributor Information
Yuan-Yu Wang, Email: lywyy1979@126.com.
Li Li, Email: lilideshy@126.com.
Zhong-Sheng Zhao, Email: zhaozhongsheng50@126.com.
Yong-Xiang Wang, Email: wangyongxiang@126.com.
Zai-Yuan Ye, Email: zaiyuanye@126.com.
Hou-Quan Tao, Email: taohouquan@126.com.
Acknowledgments
Work was supported by Zhejiang Provincial Department of Science and Technology Research Foundation (2008C33040), and Zhejiang Provincial Medical Science Research Foundation (201337120).
References
- Lee HS, Lee HK, Kim HS. et al. Tumour suppressor gene expression correlates with gastric cancer prognosis. J Pathol. 2003;200:39–46. doi: 10.1002/path.1288. [DOI] [PubMed] [Google Scholar]
- Lee HS, Lee HK, Kim HS. et al. MUC1, MUC2, MUC5AC, and MUC6 expressions in gastric carcinomas: their roles as prognostic indicators. Cancer. 2001;92:1427–34. doi: 10.1002/1097-0142(20010915)92:6<1427::AID-CNCR1466>3.0.CO;2-L. [DOI] [PubMed] [Google Scholar]
- Kolev Y, Uetake H, Iida S. et al. Prognostic significance of VEGF expression in correlation with COX-2, microvessel density and clinicopathological characteristics in human gastric carcinoma. Ann Surg Oncol. 2007;14:2738–47. doi: 10.1245/s10434-007-9484-7. [DOI] [PubMed] [Google Scholar]
- Mizokami K, Kakeji Y, Oda S. et al. Clinicopathologic significance of hypoxia-inducible factor 1 alpha overexpression in gastric carcinomas. J Surg Oncol. 2006;94:149–154. doi: 10.1002/jso.20568. [DOI] [PubMed] [Google Scholar]
- Song LB, Liao WT, Mai HQ. et al. The clinical significance of twist expression in nasopharyngeal carcinoma. Cancer Lett. 2006;242:258–65. doi: 10.1016/j.canlet.2005.11.013. [DOI] [PubMed] [Google Scholar]
- Geisler SA, Olshan AF, Weissler MC. et al. p16 and p53 protein expression as prognostic indicators of survival and disease recurrence from head and neck cancer. Clin Cancer Res. 2002;8:3445–53. [PubMed] [Google Scholar]
- Fukuoka J, Fujii T, Shih JH. et al. Chromatin remodeling factors and BRM/BRG1 expression as prognostic indicators in non-small cell lung cancer. Clin Cancer Res. 2004;10:4314–24. doi: 10.1158/1078-0432.CCR-03-0489. [DOI] [PubMed] [Google Scholar]
- Shiraishi N, Sato K, Yasuda K. et al. Multivariate prognostic study on large gastric cancer. J Surg Oncol. 2007;96:14–18. doi: 10.1002/jso.20631. [DOI] [PubMed] [Google Scholar]
- Raveh S, Gavert N, Ben-Ze’ev A. L1 cell adhesion molecule (L1CAM) in invasive tumors. Cancer Lett. 2009;282(2):137–45. doi: 10.1016/j.canlet.2008.12.021. [DOI] [PubMed] [Google Scholar]
- Gavert N, Ben-Shmuel A, Raveh S, Ben-Ze’ev A. L1-CAM in cancerous tissues. Expert Opin Biol Ther. 2008;8(11):1749–57. doi: 10.1517/14712598.8.11.1749. [DOI] [PubMed] [Google Scholar]
- Rawnaq T, Kleinhans H, Uto M. et al. Subset of esophageal adenocarcinoma expresses adhesion molecule l1 in contrast to squamous cell carcinoma. Anticancer Res. 2009;29(4):1195–9. [PubMed] [Google Scholar]
- Bergmann F, Wandschneider F, Sipos B. et al. Elevated L1CAM expression in precursor lesions and primary and metastastic tissues of pancreatic ductal adenocarcinoma. Oncol Rep. 2010;24(4):909–15. doi: 10.3892/or.2010.909. [DOI] [PubMed] [Google Scholar]
- Ben QW, Wang JC, Liu J. et al. Positive expression of L1-CAM is associated with perineural invasion and poor outcome in pancreatic ductal adenocarcinoma. Ann Surg Oncol. 2010;17(8):2213–21. doi: 10.1245/s10434-010-0955-x. [DOI] [PubMed] [Google Scholar]
- Kajiwara Y, Ueno H, Hashiguchi Y. et al. Expression of l1 cell adhesion molecule and morphologic features at the invasive front of colorectal cancer. Am J Clin Pathol. 2011;136(1):138–44. doi: 10.1309/AJCP63NRBNGCTXVF. [DOI] [PubMed] [Google Scholar]
- Choi SY, Jo YS, Huang SM. et al. L1 cell adhesion molecule as a novel independent poor prognostic factor in gallbladder carcinoma. Hum Pathol. 2011;42(10):1476–83. doi: 10.1016/j.humpath.2011.01.003. [DOI] [PubMed] [Google Scholar]
- Li S, Jo YS, Lee JH. et al. L1 cell adhesion molecule is a novel independent poor prognostic factor of extrahepatic cholangiocarcinoma. Clin Cancer Res. 2009;15(23):7345–51. doi: 10.1158/1078-0432.CCR-09-0959. [DOI] [PubMed] [Google Scholar]
- Kodera Y, Nakanishi H, Ito S. et al. Expression of L1 cell adhesion molecule is a significant prognostic factor in pT3-stage gastric cancer. Anticancer Res. 2009;29(10):4033–9. [PubMed] [Google Scholar]
- Min JK, Kim JM, Li S. et al. L1 cell adhesion molecule is a novel therapeutic target in intrahepatic cholangiocarcinoma. Clin Cancer Res. 2010;16(14):3571–80. doi: 10.1158/1078-0432.CCR-09-3075. [DOI] [PubMed] [Google Scholar]
- Tsutsumi S, Morohashi S, Kudo Y. et al. L1 Cell adhesion molecule (L1CAM) expression at the cancer invasive front is a novel prognostic marker of pancreatic ductal adenocarcinoma. J Surg Oncol. 2011;103(7):669–73. doi: 10.1002/jso.21880. [DOI] [PubMed] [Google Scholar]
- Kato K, Maesawa C, Itabashi T. et al. DNA hypomethylation at the CpG island is involved in aberrant expression of the L1 cell adhesion molecule gene in colorectal cancer. Int J Oncol. 2009;35(3):467–76. doi: 10.3892/ijo_00000358. [DOI] [PubMed] [Google Scholar]
- Shigdar S, Lin J, Yu Y. et al. RNA aptamer against a cancer stem cell marker epithelial cell adhesion molecule. Cancer Sci. 2011;102(5):991–8. doi: 10.1111/j.1349-7006.2011.01897.x. [DOI] [PubMed] [Google Scholar]
- Kimura H, Kato H, Faried A. et al. Prognostic significance of EpCAM expression in human esophageal cancer. Int J Oncol. 2007;30(1):171–9. [PubMed] [Google Scholar]
- Fong D, Steurer M, Obrist P. et al. Ep-CAM expression in pancreatic and ampullary carcinomas: frequency and prognostic relevance. J Clin Pathol. 2008;61(1):31–5. doi: 10.1136/jcp.2006.037333. [DOI] [PubMed] [Google Scholar]
- Went P, Vasei M, Bubendorf L. et al. Frequent high-level expression of the immunotherapeutic target Ep-CAM in colon, stomach, prostate and lung cancers. Br J Cancer. 2006;94(1):128–35. doi: 10.1038/sj.bjc.6602924. [DOI] [PMC free article] [PubMed] [Google Scholar]
- Wenqi D, Li W, Shanshan C. et al. EpCAM is overexpressed in gastric cancer and its downregulation suppresses proliferation of gastric cancer. J Cancer Res Clin Oncol. 2009;135(9):1277–85. doi: 10.1007/s00432-009-0569-5. [DOI] [PubMed] [Google Scholar]
- Songun I, Litvinov SV, van de Velde CJ. et al. Loss of Ep-CAM (CO17-1A) expression predicts survival in patients with gastric cancer. Br J Cancer. 2005;92(9):1767–72. doi: 10.1038/sj.bjc.6602519. [DOI] [PMC free article] [PubMed] [Google Scholar]
- Akita H, Nagano H, Takeda Y. et al. Ep-CAM is a significant prognostic factor in pancreatic cancer patients by suppressing cell activity. Oncogene. 2011;30(31):3468–76. doi: 10.1038/onc.2011.59. [DOI] [PubMed] [Google Scholar]
- Saito H, Fukumoto Y, Osaki T. et al. Prognostic significance of level and number of lymph node metastases in patients with gastric cancer. Ann Surg Oncol. 2007;14(5):1688–93. doi: 10.1245/s10434-006-9314-3. [DOI] [PubMed] [Google Scholar]
- Hidaka H, Eto T, Maehara N. et al. Comparative effect of lymph node metastasis classified by the anatomical site or by the number of nodes involved on prognosis of patients with gastric cancer. Hepatogastroenterology. 2008;55(88):2269–2272. [PubMed] [Google Scholar]
- Lauren P. The two histological main types of gastric cancer: diffuse and so-called intestinal type carcinoma. Acta Pathol Microbiol Scand. 1965;64:31–9. doi: 10.1111/apm.1965.64.1.31. [DOI] [PubMed] [Google Scholar]
- Fuchs CS, Mayer RJ. Gastric carcinoma. N Engl J Med. 1995;333(1):32–41. doi: 10.1056/NEJM199507063330107. [DOI] [PubMed] [Google Scholar]


