Abstract
An accurate representation of three-dimensional (3D) object orientation is essential for interacting with the environment. Where and how the brain visually encodes 3D object orientation remains unknown, but prior studies suggest the caudal intraparietal area (CIP) may be involved. Here, we develop rigorous analytical methods for quantifying 3D orientation tuning curves, and use these tools to the study the neural coding of surface orientation. Specifically, we show that single neurons in area CIP of the rhesus macaque jointly encode the slant and tilt of a planar surface, and that across the population, the distribution of preferred slant-tilts is not statistically different from uniform. This suggests that all slant-tilt combinations are equally represented in area CIP. Furthermore, some CIP neurons are found to also represent the third rotational degree of freedom that determines the orientation of the image pattern on the planar surface. Together, the present results suggest that CIP is a critical neural locus for the encoding of all three rotational degrees of freedom specifying an object's 3D spatial orientation.
Introduction
Interactions with objects often require determining their 3D spatial orientation based on visual information. Following Hubel and Wiesel's (1959) discovery of orientation selectivity in primary visual cortex (V1), a diverse range of mechanisms for encoding orientation in the two-dimensional (2D) frontoparallel plane was discovered (DeAngelis et al., 1993; Ringach et al., 1997; Rosenberg et al., 2010). However, extensions to the encoding of 3D object orientation remain surprisingly limited (Taira et al., 2000; Hinkle and Connor, 2002; Liu et al., 2004; Sanada et al., 2012). This reflects that the leap from 2D orientation (a single degree of freedom) to 3D orientation (up to 3 df) is complex for reasons beyond the gap in number of variables. For example, unlike translations, 3D rotations are noncommutative: changing the order of two successive rotations, R1 and R2, generally leads to different final orientations (R1 × R2 ≠ R2 × R1). Rotations in 3D are also nontrivial in that singularities (orientations where angular variables become locally undefined) are inescapable (Craig, 2005). The consequences of these considerations are far reaching, imposing fundamental limits on the control of the eyes, head, and limbs (Tweed et al., 1999; Crawford et al., 2003; Angelaki and Hess, 2004). Despite its clear behavioral relevance, several factors including inherent mathematical complexity, the use of stimuli confounding shape with orientation, and a lack of suitable analysis methods have greatly limited our understanding of how 3D object orientation is visually encoded.
Here, we investigate how 3D surface orientation is encoded by neurons in area CIP of the macaque monkey. Two angular variables called slant (rotation toward/away from the observer) and tilt (rotation about the line-of-sight) are widely used to parameterize the 3D orientation of a plane (Stevens, 1983). Previous work showed that CIP neurons are tuned for planar tilt, but did not measure slant tuning (Taira et al., 2000). Thus, it is currently unknown whether CIP indeed encodes 3D orientation. In this study, we show that CIP neurons jointly encode slant and tilt, and rigorous analytical methods are developed to provide a quantitative description of how these angular variables are visually encoded. Across the population, the distribution of slant-tilt preferences is found to be statistically indistinguishable from uniform, suggesting that all slant-tilt combinations are equally represented in area CIP. Importantly, we also find that some CIP neurons are sensitive to all three rotational degrees of freedom needed to fully specify an object's 3D orientation. This work thus suggests that CIP plays a fundamental role in the visual encoding of 3D object orientation, and develops tools necessary for properly characterizing how the brain creates an ecologically complete representation of 3D spatial orientation.
Materials and Methods
Animal preparation.
All surgeries and experimental procedures were approved by the Institutional Animal Care and Use Committee, and were in accordance with NIH guidelines. Three male rhesus monkeys (Macaca mulatta) weighing between 5.0 and 7.5 kg were surgically implanted with a lightweight delrin ring for head restraint and a removable recording grid for guiding electrode penetrations. In separate surgeries, each eye was implanted with a scleral search coil for monitoring eye position. After recovery, standard operant conditioning procedures were used to train the monkeys to fixate a visual target within 2° version and 1° vergence windows.
Localization of recording sites and data acquisition.
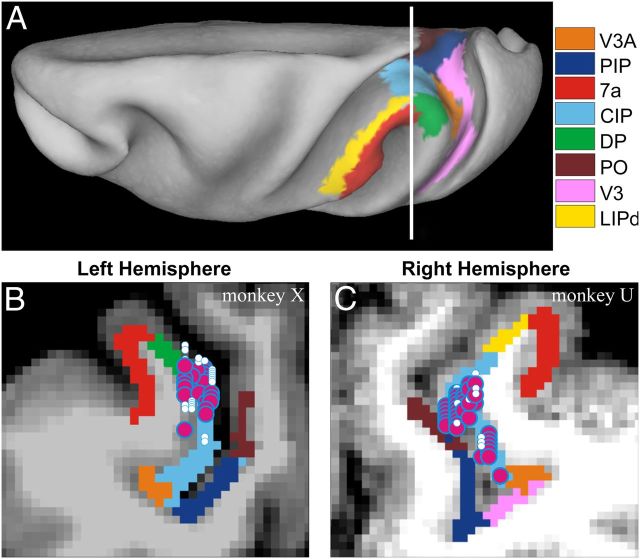
Recording locations were targeted to area CIP in four hemispheres of three monkeys using MRI atlases (Van Essen et al., 2001; Chen et al., 2010) (Fig. 1). The CARET software, used to segment visual areas, designates area CIP as the lateral occipitoparietal zone (Lewis and Van Essen, 2000; Katsuyama et al., 2010). Action potentials were recorded extracellularly with epoxy-coated tungsten microelectrodes (FHC) that were inserted into the cortex through a transdural guide tube using a hydraulic microdrive. Neural voltage signals were amplified, filtered (1 Hz to 10 kHz), and displayed on an oscilloscope to isolate single-units using a window discriminator (BAK Electronics). The same signals were digitized at a rate of 25 kHz using a CED Power 1401 (Cambridge Electronic Design) and stored for off-line analysis. Surface orientation selectivity was tested for 358 neurons, sampling slant-tilt at a relatively coarse grain (45° tilt and 20° slant steps). Visual responses were elicited from 171 neurons, but 10 were lost before additional data could be gathered; the responses of the remaining 161 neurons were further studied as described next.
Figure 1.
Anatomical localization of recording sites. A, Inflated cortical surface of monkey X illustrating the location of area CIP and neighboring regions. The vertical white line shows the approximate anterior–posterior location of the coronal section shown in B. B, C, Coronal MRI sections showing approximate recording locations in the left hemisphere of monkey X and the right hemisphere of monkey U. Recording locations were distributed over 2.4 mm (monkey X) or 3.2 mm (monkey U) anterior–posterior and projected onto a single section. White symbols indicate positions of unresponsive cells. Magenta symbols with blue borders indicate positions of surface orientation selective neurons (monkey X, N = 22; monkey U, N = 36).
Behavioral control and visual stimuli.
Behavioral control used custom Spike2 scripts. During an experiment, a monkey sat 30 cm from an LCD screen on which visual stimuli were displayed. An aperture constructed from a black nonreflective material was affixed to the screen such that the only viewable region was a disc with a 30 cm diameter. The same material was used to encase the setup such that the monkey could only see the stimulus. Visual stimuli were programmed using the OpenGL graphics library. Binocular disparity cues were generated by rendering the stimuli as red–green anaglyphs. Joint slant-tilt tuning curves were measured using stimuli subtending approximately 53° of visual angle. Tilt was varied between 0° and 330° in 30° steps and slant was varied between 0° and 60° in 15° steps. To not confound the degree of slant with the area of stimulated retina, all stimuli covered the same retinotopic area. This limited the maximum slant to 60°.
The fixation point (yellow in color) was always located directly in front of the monkey at screen distance. A single trial required 1350 ms of fixation. The screen was otherwise black for the first 300 and last 50 ms, and a planar stimulus was presented for the 1 s in between. These timing parameters are similar to those used in previous CIP studies (Taira et al., 2000; Tsutsui et al., 2001). The monkey was rewarded only if fixation was maintained throughout this duration, and data were discarded if fixation was broken prematurely. Typically, 5–8 trials of each stimulus were presented (median = 5), but as many as 12 were presented and a minimum of 3 (6 cells) was required. Stimulus-driven firing rates were calculated from the onset of the visual response to the end of the 1 s stimulus presentation, and baseline activity was calculated over the 250 ms preceding the stimulus onset. Consistent with the position of CIP in the dorsal visual stream and previously published results from the area (Taira et al., 2000; Tsutsui et al., 2001), the visual responses typically had both transient and sustained components. To calculate the visual response latency, an average spike density function across all trials and planar stimuli was created using a 10 ms Gaussian window and aligned to the onset of fixation using a photodiode pulse. The visual response latency was defined as the time after stimulus onset at which the value of the spike density function exceeded its average value over the 250 ms preceding the stimulus onset by 3 SDs for at least 30 ms.
Describing 3D surface orientation.
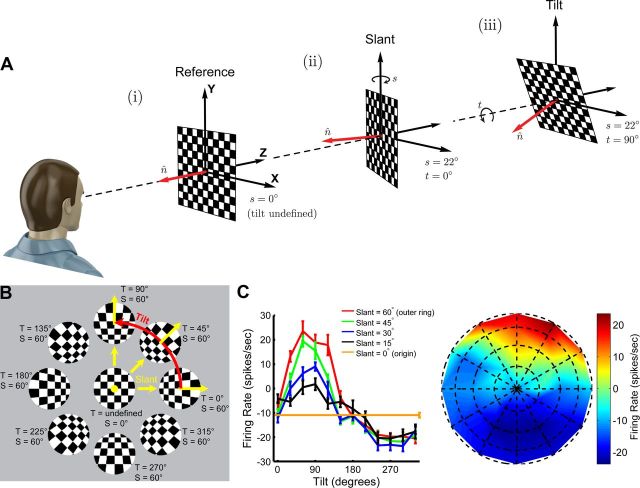
The spatial orientation of a planar surface is often parameterized by two angular variables called slant and tilt (Stevens, 1983) that describe the direction of the plane's unit normal vector (Fig. 2A). Because slant describes rotation toward/away and tilt describes rotation about the line-of-sight, slant-tilt distinguishes rotations that change the extent of an object's depth variation (slant) from those that do not (tilt). The visible configurations of planar slant-tilt may be visualized as a disc (Fig. 2B) in which slant is the radial variable (0° ≤ s < 90°) and tilt is the angular variable (0° ≤ t < 360°). Although the 3D orientation of a plane is often thought of as having only the two rotational degrees of freedom of slant and tilt (Stevens, 1983), like all objects, it actually has three (Craig, 2005). The third degree of freedom describes the orientation of the image on the plane's surface, and may be parameterized as a rotation about the surface normal (0° ≤ θ < 360°). A helpful analogy may be drawn here to 3D eye position (Haslwanter, 1995), where gaze is described by the direction of a 3D vector with two rotational degrees of freedom (like slant and tilt) and a third degree of freedom (torsion) rotates the eye about the gaze vector (analogous to the orientation of an image on the planar surface). Under limiting circumstances, such as if the plane lacks orientable texture cues or from the perspective of a neuron insensitive to such cues, this third degree of freedom may not be distinguishable. In such instances, a plane's 3D orientation is effectively constrained to having 2 df (e.g., slant and tilt).
Figure 2.
Slant–tilt representation of planar surface orientation. A, The slant and tilt of a planar surface describes the direction of its surface normal, n̂. i, A frontoparallel plane, whose normal is aligned with the Z axis, serves as a reference for describing spatial orientation. ii, Slant (s) describes the first rotation, which occurs about the Y axis and ranges between 0° and 90°. A slant of 22° is illustrated. iii, Tilt (t) describes the second rotation, which occurs about the Z axis and ranges between 0° and 360°. A tilt of 90° is illustrated. Note that tilt is undefined when s = 0° since rotations about the Z axis do not affect the normal. B, For the purpose of visualization, planar surface orientation can be organized on a disc where slant is the radial variable and tilt is the angular variable. C, Tilt-tuning curves measured at different slants for a single CIP neuron are plotted on the left. The response to the frontoparallel plane is plotted as a horizontal line with the error bar offset slightly to the right. Responses are baseline subtracted and error bars are SEM. On the right, the same data are organized as in B to construct a joint slant-tilt tuning curve with firing rate color coded. Dotted grid lines show the sampling of slant and tilt, with intersection points corresponding to presented 3D surface orientations.
Parameterizing 3D surface orientation.
To describe an object's 3D spatial orientation, rotations can be parameterized about the cardinal axes of a spatially fixed XYZ reference frame (Craig, 2005). It is standard convention for the Z axis to be oriented in depth (with larger positive values further from the observer), the X axis to be oriented horizontally (with larger positive values further to the observer's right), and the Y axis to be oriented vertically (with larger positive values further upward). Additionally, previous studies of 3D object orientation have defined positive rotations about the Y axis as bringing the object closer to the observer's right side (Taira et al., 2000; Hinkle and Connor, 2002). This arrangement describes a left-handed reference frame in which the rotation of a vector may be accomplished using the following rotation matrices:
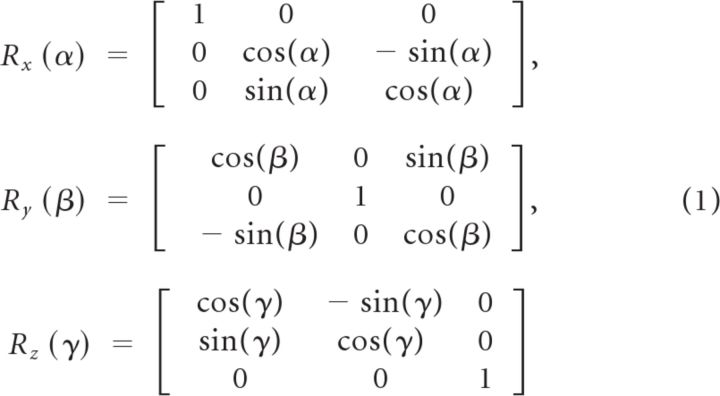 |
When describing an object's spatial orientation, it is important to distinguish between the dimensionality of the space in which the rotations occur and the number of rotational degrees of freedom. Most vision science studies to date focus on 2D orientation (i.e., in two dimensions of space) where there is only one rotational degree of freedom and the axis of rotation is perpendicular to the XY plane (i.e., about the Z axis). For 3D orientation (i.e., in three dimensions of space), the axis of rotation can point along any direction in 3D space, providing up to two additional degrees of freedom. Thus, whereas 2D orientation describes rotations around a single axis (i.e., 1 df), 3D orientation describes rotations with either 2 or 3 df (Craig, 2005).
Here, we parameterize the two rotational degrees of freedom describing the direction of a plane's unit normal vector in terms of slant and tilt (Stevens, 1983). Because 3D rotations are noncommutative, parameterizing 3D orientation requires defining a rotation order. We define the frontoparallel plane (whose normal, n̂ = [0 0 1]T, is aligned with the Z axis) as the reference orientation (Fig. 2Ai). Note that tilt (rotation about the Z axis) is undefined for a frontoparallel plane, reflecting a singularity in the coordinates (i.e., rotation about the Z axis does not change the direction of a frontoparallel plane's normal vector). Thus, slant (rotation about the Y axis) must be the first rotation (Fig. 2Aii), and tilt must be the second rotation (Fig. 2Aiii).
The configuration space of 2 df rotations (e.g., slant and tilt) is the surface of a unit sphere, denoted S2 (Mardia and Jupp, 2000; Yershova and LaValle, 2004; Craig, 2005). For a plane, slant-tilt parameterizes this sphere according to Rz(t) · Ry(s) · n̂, resulting in spherical coordinates p = (x, y, z):
 |
where (0° ≤ s < 90°) and (0° ≤ t < 360°) are slant and tilt, respectively. Slant is restricted to be <90° to eliminate orientations where the plane self-occludes (Cowan et al., 2002). For a planar surface, spatial orientation is unique only up to the sign of the normal vector (i.e., n̂ = − n̂). This axial symmetry imposes antipodal symmetry on the unit sphere (i.e., points p and −p are equivalent) describing the configuration space of planar slant-tilt. As a consequence of this geometry, neuronal slant-tilt tuning curves measured with a plane may be visualized on a disc via an equatorial projection of the sphere's northern hemisphere in which slant and tilt are arranged using the (x, y) coordinates in Equation 2 (Fig. 2B,C).
Fitting slant-tilt tuning curves.
Because a unit sphere describes two rotational degrees of freedom, slant-tilt tuning curves must be fit with a spherical function. However, since two planar orientations (s, t) and (−s, t + 180°) are physically identical (i.e., the configuration space of planar surface orientation is antipodally symmetric), that function must also be antipodally symmetric. The analysis of antipodally symmetric spherical data is commonplace in the field of geomagnetism, and a widely used descriptive model from that literature is the Bingham function (Bingham, 1974; Gubbins and Herrero-Bervera, 2007). We next parameterize the Bingham function as a model for planar slant-tilt tuning curves. Consider a function Ψ : S2 → ℝ1 that maps points from the sphere to the real number line.
where x is a unit vector and A = AT ϵ ℝ3×3 is a 3 × 3 symmetric matrix. Let M denote the matrix of eigenvectors of A and let Z be a diagonal matrix whose nonzero entries, ζ1, ζ2, ζ3, are the eigenvalues of A. In general, M can be expressed as a special orthogonal matrix, that is a rotation matrix, such that MTM =I and det(M) = +1. We can thus write A = MZMT, which is defined by six parameters since there are three eigenvalues plus three angular parameters for the rotation matrix M (elements aij = aji in A). Since columns can be reordered and negated as necessary to maintain det(M) = +1, then without loss of generality, we order the eigenvalues as ζ3 ≥ ζ2 ≥ ζ1.
Ψ (x) can now be parameterized by a response amplitude, preferred slant and tilt, concentration (bandwidth) parameters, and an additional rotation parameter. Let y = MTx so that
Since we are only concerned with unit vectors (i.e., points on the spherical surface), then y22 = 1 − y12 − y32, and Ψ(x) can be written
 |
Denoting the columns of M as μ1, μ2, and μ3, we can express this in terms of x:
 |
In simplified form and introducing a DC offset,
where the three orthonormal vectors (μ1, μ2, μ3) are defined as follows:
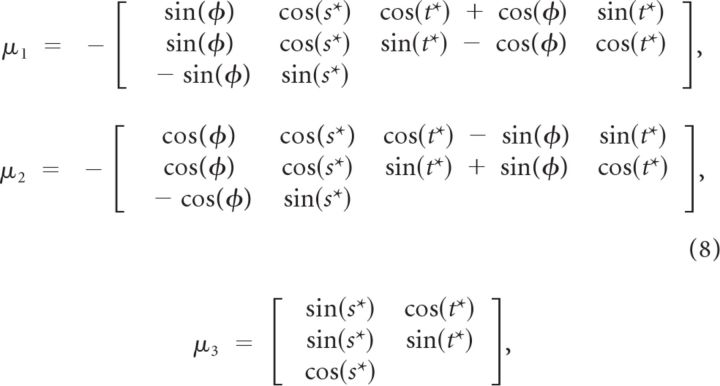 |
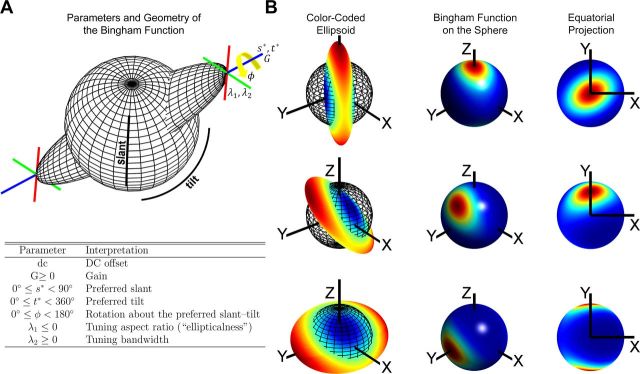
Because the individual columns of M are orthonormal, any one of them may be expressed as the cross product of the other two. Consequently, μ2 drops out of Equation 7. The DC term is a constant firing rate, G sets the response amplitude, and the parameters s* and t*. are the preferred slant and tilt, respectively. The preferred slant-tilt is set by μ3 and the tuning bandwidth is set by λ2. Larger positive values of λ2 make the tuning curve narrower. The λ1 term determines the aspect ratio of the function, with λ1 = 0 being circularly symmetric and increasingly negative values making the function more elliptical (e.g., creating broader slant than tilt tuning). Last, φ rotates the function about the preferred slant-tilt. A geometric description of the Bingham function and summary of its seven parameters is presented in Figure 3. To avoid local minima when fitting, each tuning curve was fit with multiple initial parameter sets and perturbation techniques were applied to the converged parameter sets. The solution resulting in the highest correlation between data and model was retained.
Figure 3.
Geometric description of the Bingham function. A, The configuration space of planar slant-tilt is the surface of a unit sphere with antipodal symmetry. Slant varies along the elevation and tilt varies along the azimuth. The Bingham function is formed by taking the intersection of an ellipsoid with a unit sphere. Because an ellipsoid is axially symmetric, the Bingham function is antipodally symmetric. The orientation of the ellipsoid's major axis (blue line), set by s* and t*, determines the preferred slant-tilt. The length of the ellipsoid along the major axis, set by G, determines the response amplitude. The parameter φ (yellow arrow) rotates the intermediate and minor axes (red and green lines) about the major axis (i.e., the preferred slant-tilt). The parameter λ1 determines the aspect ratio of the ellipsoid across the intermediate and minor axes, allowing the function to be broader along one of these axes than the other (i.e., more elliptical). The parameter λ2 sets how broad the ellipsoid is across the intermediate and minor axes, determining the tuning bandwidth. All seven of the Bingham function parameters are summarized in the table beneath the illustration (the DC offset was not illustrated). B, Three examples showing the correspondence between ellipsoids (first column), the Bingham function on the sphere (second column), and the Bingham function projected onto the slant-tilt disc as in Figure 2B, C (third column) for visualization.
When parameterized for the slant and tilt of a planar surface, the Bingham function may be visualized on the slant-tilt disc described above and illustrated in Figure 2, B and C, by removing the z coordinate through an equatorial projection of the sphere's northern hemisphere (Fig. 3). Under this projection, the singularity at s = 0° (the frontoparallel plane) where all tilts map to the same point (the north pole of the sphere) lies at the origin. Cross-sections through the origin “wrap around,” reflecting the fact that points on opposite edges of the slant-tilt disc correspond to identical orientations. Two examples in which this wrap around is apparent are shown: (1) in the third row of Figure 3B and (2) in Figure 4C. Cross-sections of a Bingham function which pass through the origin of the slant-tilt disc (i.e., slant tuning curves) reduce to setting A = AT ϵ ℝ2×2, a 2 × 2 symmetric matrix, in Equation 3. This defines a 1 df Bingham function, which is equivalent to a von Mises function with π periodicity. Planar slant-tuning curves should thus be well described by a π periodic von Mises function. Importantly, the Bingham function is not limited to describing planar surface orientation. For example, neuronal tuning curves for the slant-tilt of a bar can be described using a similar parameterization in which the two angular variables map differently to the sphere to reflect that a bar's tilt is defined in the frontoparallel plane. Likewise, by setting A = AT ϵ ℝ4×4, a 4 × 4 symmetric matrix in Equation 3, the Bingham function can be extended to describe neuronal tuning curves measured for all three rotational degrees of freedom of an arbitrary object's 3D spatial orientation. This reflects that the configuration space of 3 df rotations is the surface of a hypersphere (S3) with antipodal symmetry (Yershova and LaValle, 2004). A 3 df Bingham function may consequently be fit to a dataset in which a cell's tuning for the third angular variable is measured at all sampled slant-tilt combinations. Thus, the Bingham function is highly flexible, allowing for rigorous quantification of a wide variety of object orientation tuning curves, ranging from one to all three rotational degrees of freedom.
Figure 4.
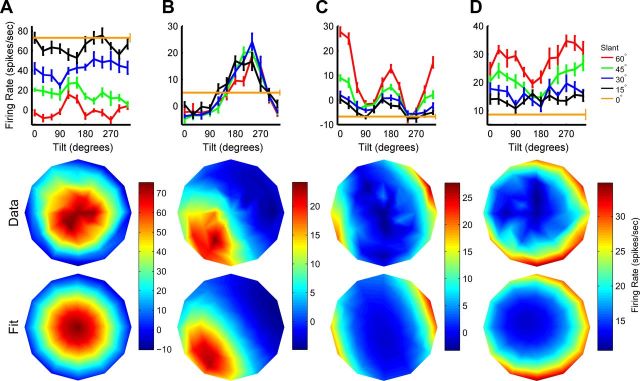
Slant–tilt tuning curves of four CIP neurons. A–D, Tilt tuning curves measured at different slants are plotted along with the joint slant-tilt tuning curve (as in Fig. 2C) and Bingham function fit (as in the right column of Fig. 3B). Responses are baseline subtracted, error bars on the tilt tuning curves are SEM, and firing rate is color coded in the joint tuning curves. Parameter fits are provided for comparison with the population histograms (Figs. 6, 7). A, Cell preferring small slants (near frontoparallel planes). Fit parameters: s = 2°, t = 221°, λ1 = −0.21, λ2 = 1.30, and φ = 103°. B, Cell preferring planar surfaces with the lower left side closest to the monkey. Fit parameters: s = 39°, t = 231°, λ1 = −1.34, λ2 = 1.37, and φ = 63°. C, Cell preferring large slants with narrow tilt tuning. Fit parameters: s = 87°, t = 19°, λ1 = −0.34, λ2 = 1.21, and φ = 102°. The appearance of two peaks reflects the cell's large slant preference, and that points on opposite sides of the disc correspond to similar orientations (see Materials and Methods). D, Cell preferring large slants with broad tilt tuning. Fit parameters: s = 86°, t = 261°, λ1 = −1.35, λ2 = 0.40, and φ = 100°.
Results
Single neurons in area CIP encode the slant-tilt of a planar surface
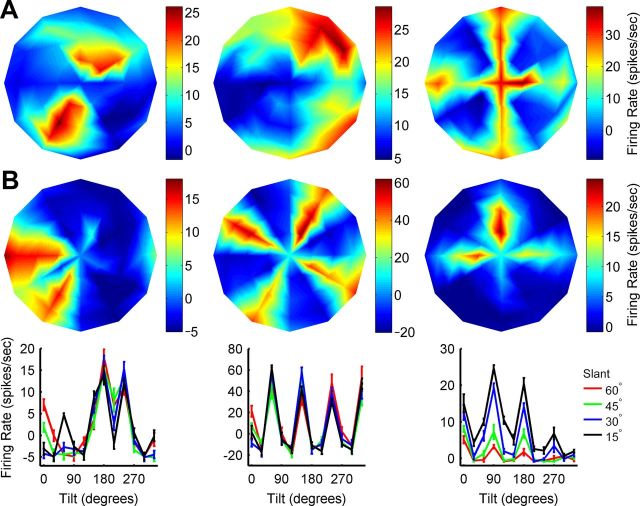
Previous work showed that approximately half of CIP neurons are tuned for the tilt of a plane at a fixed slant, but did not examine their sensitivity to changes in slant (Taira et al., 2000; Tsutsui et al., 2001). To determine whether CIP neurons jointly encode slant and tilt, we recorded the responses of 161 visually responsive cells (Fig. 1) while varying both the slant and tilt of a planar surface rendered on an LCD with a checkerboard texture pattern and binocular disparity cues. Tilt tuning curves measured at different slants are shown for a single neuron in Figure 2C along with the joint slant-tilt tuning curve. This cell responded most strongly to planar surfaces leaning toward the monkey, but there was a wide range of diversity in the slant-tilt tuning curves across the population. To characterize these diverse responses quantitatively, it was necessary to develop analytical tools appropriate for characterizing neuronal tuning curves for 3D object orientation. This is done in the Materials and Methods, where the Bingham function (Bingham, 1974; Mardia and Jupp, 2000) is parameterized as a model for slant-tilt tuning curves. In Figure 3, the Bingham function is described geometrically and its parameters are summarized.
In Figure 4, example CIP slant-tilt tuning curves are shown along with Bingham function fits. The cell in Figure 4A preferred a frontoparallel plane (the tuning curve is nearly centered on the slant-tilt disc, s = 2°) and the tuning was approximately circularly symmetric (λ1 = −0.21; tuning is isotropic when λ1 = 0). The cell in Figure 4B preferred an oblique tilt with the lower left side of the plane closest to the monkey. The fitted tilt and slant parameters were t = 231° and s = 39°, respectively. Hence, the peak of the tuning curve is positioned in the lower left of the slant-tilt disc and centered at an intermediate radial distance from the origin (s = 0°). For the cell in Figure 4C, the high firing rates on opposite sides of the slant-tilt disc (compare the example in the third row of Fig. 3B) reflect the cell's large slant preference (s = 87°) combined with the fact that opposite sides of the slant-tilt disc correspond to similar orientations (a consequence of the antipodal symmetry of the space describing planar surface orientation, see Materials and Methods). This cell's tuning was relatively isotropic (λ1 = −0.34) and narrow (λ2 = 1.21). The cell in Fig. 4D also preferred large slants (s = 86°), but its tuning was anisotropic (λ1 = −1.35) and broader (λ2 = 0.40), with broader tuning along the tilt than slant axis (φ = 100°). Tuning is broader along the tilt axis when φ is near 90°, and broader along the slant axis when φ is near 0°. This anisotropy results in the crescent shape of the tuning curve. As these examples illustrate, the Bingham function generally provided a strong fit to the data: the average fit correlation was r = 0.88 ± 0.09 SD, N = 161 (Fig. 4). However, visual inspection indicated that 17 of these cells had multiple distinct modes in their tuning, and therefore lacked a unique slant-tilt preference (Fig. 5). Their tuning curves were thus poorly described by the Bingham function (average fit correlation: r = 0.68 ± 0.11 SD). Interestingly, the majority of them (15/17) were encountered in left hemisphere recordings (monkeys X and P), although they were intermixed with slant-tilt selective cells (no clustering was observed). Except where otherwise noted, these cells were excluded from further analysis. The remaining 144 neurons were all selective for a unique slant-tilt and their tuning curves were well described by the Bingham function (average r = 0.91 ± 0.05 SD). This result demonstrates that CIP neurons jointly encode the slant and tilt of a planar surface.
Figure 5.
Tuning curves of cells not selective for planar slant-tilt. Six tuning curves illustrating the range of observed responses that were not tuned for a unique slant-tilt. Responses are baseline subtracted and firing rate is color coded. A, Tuning curves of three neurons for which sensitivity to the orientation of the frontoparallel checkerboard image was not tested. Like the slant-tilt tuning curves plotted in Figure 4, the response at the origin was to a frontoparallel plane with a checkerboard image with θ = 0° (Fig. 9A). B, Tuning curves of three neurons for which sensitivity to the orientation of the frontoparallel checkerboard image was tested. The average of these responses is plotted at the origin. Tilt tuning curves measured at different slants are shown for each of these three neurons (as in Fig. 2C). Error bars are SEM.
Area CIP encodes a uniform distribution of planar slant-tilts
The computation of planar slant-tilt (Marr's “2.5D sketch”) is critical to constructing an accurate 3D spatial representation of the visual scene (Marr, 1982). However, whether or not the visual encoding of slant-tilt is unbiased in the number of neurons representing any particular orientation, or subset of orientations, remains untested in any neural population. In part, this reflects that analytical methods appropriate for quantifying 3D object orientation-tuning curves did not previously exist. One possible finding is that all orientations are uniformly encoded, which may be ideal for guiding interactions with objects (e.g., grasping) independent of the orientation in which they are encountered. Alternatively, the distribution of orientation preferences may be systematically biased (e.g., for ground-plane estimation), in a way that makes the population more sensitive to certain orientations (Gu et al., 2010). Using the Bingham function fits to estimate the preferred slants and tilts of the 144 slant-tilt selective neurons, we next examine the distribution of surface orientations represented by the CIP population.
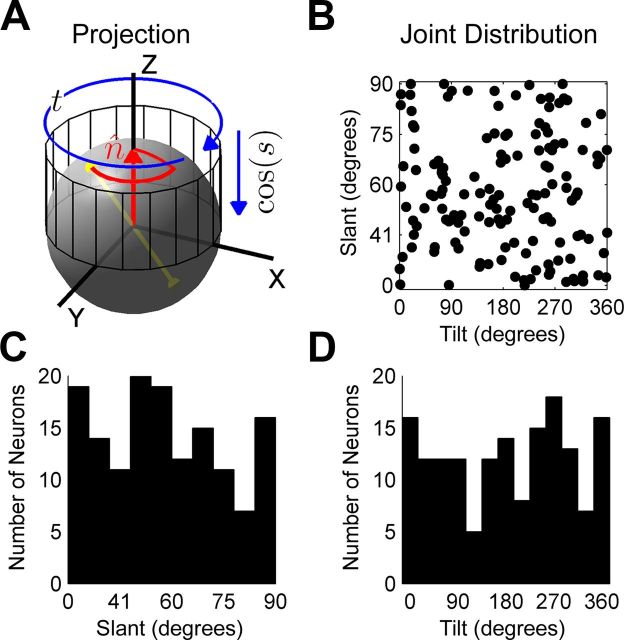
As described in the Materials and Methods, slant and tilt are spherical coordinates. To examine the distribution of these angular variables, we performed a Lambert-like cylindrical projection of the slant-tilt preferences (Snyder, 1987). Under this area-preserving coordinate transformation, tilt is represented directly in the angular variable (e.g., the difference between tilts of 0° and 30° is the same as between 240° and 270°) and slant is represented in the cosine of the angle (Fig. 6A). Uniformity or bias in the distribution of orientation preferences found in this transformed space implies the same over the spherical surface. The joint distribution of slant and tilt preferences following the equal area projection is shown in Figure 6B. This distribution is not significantly different from uniform (χ2, p = 0.26). The marginal distribution of slant preferences (in the cosine of the angle) is shown in Figure 6C, and the marginal distribution of tilt preferences is shown in Figure 6D. Neither of these distributions is significantly different from uniform (χ2, p ≥ 0.27). Unlike V1 that over-represents the cardinal orientations of a contour in the 2D frontoparallel plane (Li et al., 2003), these results suggest that CIP may represent all possible combinations of slant and tilt equally.
Figure 6.
Area CIP encodes a uniform distribution of slant-tilts. A, Slant–tilt is a spherical coordinate system describing the direction of a planar surface's unit normal vector. For a frontoparallel plane, the normal vector (red arrow), n̂, aligns with the Z axis of the reference frame (compare Fig. 2Ai). The pair of antipodal yellow points connected by a yellow line segment represents a unique 3D surface orientation. The red curve traces the path that the plane's normal would travel from a frontoparallel orientation to the orientation specified by the pair of yellow points assuming motion along the first coordinate (slant) followed by motion along the second (tilt). The projection cylinder preserving area in the joint distribution (a Lambert-like projection) is also shown, with blue arrows illustrating the transformation. B, The joint distribution of slant-tilts following this transformation. C, Marginal distribution of slant tuning preferences. D, Marginal distribution of tilt tuning preferences. In B–D, tilt is plotted directly in the angular variable and slant is plotted in the cosine of the angle.
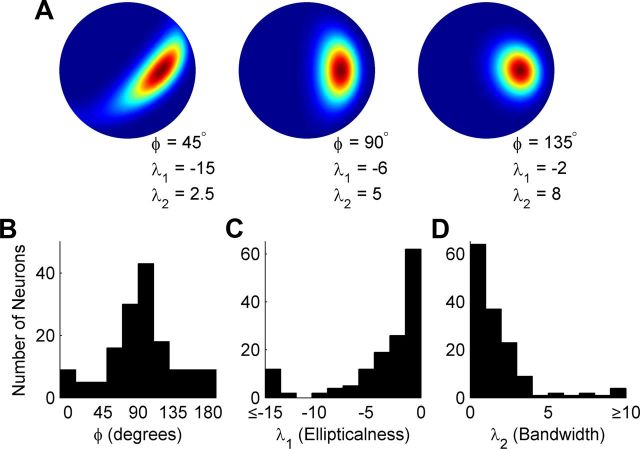
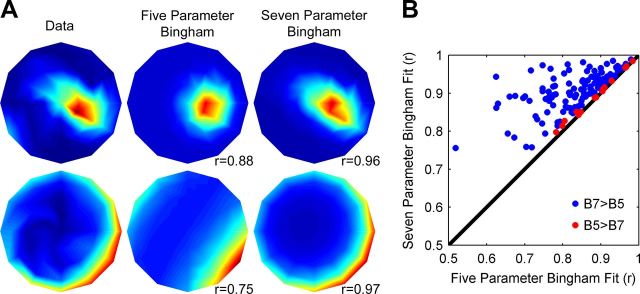
Population histograms showing the distributions of the other shape-determining parameters of the Bingham function are shown in Figure 7. These parameters, described geometrically in Figures 3 and 7A, rotate the intermediate and minor axes of the tuning curve about the preferred slant-tilt (φ; Fig. 7B), set its aspect ratio—allowing tuning to be broader along one axis (λ1; Fig. 7C), and set the overall tuning bandwidth (λ2; Fig. 7D). Most typically, the intermediate and minor axes were aligned with the azimuth and elevation of the sphere, respectively (Fig. 7B). This indicates that variation in tuning bandwidth tended to occur across the tilt and slant (as opposed to oblique) axes (Fig. 8A). Because the shape of a tuning curve is at a minimum specified by a peak and a bandwidth, we further examined whether the two parameters (λ1 and φ) allowing the Bingham function to be more elongated along a particular axis were necessary to accurately describe CIP slant-tilt tuning curves. The tuning curves of the 144 slant-tilt selective neurons were refit with a model made simpler by setting λ1 = 0, which also eliminates the φ parameter (see Eqs. 7, 8). Removing these two parameters constrains the Bingham function to be isotropic (i.e., equal slant and tilt tuning bandwidths) and is therefore a minimal model accounting for the geometry of planar slant-tilt with only five parameters (DC offset, gain, slant preference, tilt preference, and bandwidth). This function typically provided an adequate description of CIP slant-tilt tuning curves (average r = 0.84 ± 0.09 SD). Using Akaike's Information Criterion corrected for finite sample size (Burnham and Anderson, 2002) to compare model fits, the unconstrained (seven parameter) Bingham function was found to provide a better description of the majority of tuning curves (127/144; 88%; Fig. 8B). This suggests that the unconstrained Bingham function is generally the simplest model providing an accurate description of CIP planar slant-tilt tuning curves.
Figure 7.
Population histograms of additional Bingham function tuning parameters. A, Three examples illustrating how the φ, λ1, and λ2 parameters affect the shape of the Bingham function (plotted on the slant-tilt disc as in the right column of Fig. 3B). B, Population histogram for the φ parameter that rotates the tuning curve about the preferred slant-tilt. The peak at 90° indicates that the intermediate and minor axes of most tuning curves were aligned with the azimuth (tilt axis) and elevation (slant axis) of the sphere, respectively (see Fig. 3). Variation in tuning bandwidth thus tended to occur across the tilt and slant (as opposed to oblique) axes. C, Population histogram of the λ1 parameter that sets the aspect ratio of the tuning curve, determining its “ellipticalness.” This parameter allows tuning to be broader along one axis (e.g., tilt) than the other (e.g., slant). The greater the magnitude, the more elongated the tuning curve. D, Population histogram of the λ2 parameter, which determines the tuning bandwidth. Smaller values result in broader tuning.
Figure 8.
CIP slant-tilt tuning curves are often anisotropic. A, Slant–tilt tuning curves and Bingham function fits for two CIP neurons plotted on the slant-tilt disc. The tuning curves (left column) were fit with two versions of the Bingham function: (1) a simplified five parameter Bingham function (B5) constrained to have equal slant and tilt tuning bandwidths (middle column) and (2) the unconstrained seven parameter Bingham function (B7) as in Figure 4 (right column). Pearson correlations between the data and models are shown. Note that in both cases, the tuning curves were elongated along either the slant (top row) or tilt (bottom row) axis, and that these anisotropies cannot be captured by the five parameter Bingham function. B, Scatter plot of correlation coefficients between the data and two models. Akaike's Information Criterion corrected for finite sample size was used to perform model selection. For 88% of CIP slant-tilt selective neurons, the seven parameter model outperformed the five parameter model (B7>B5; blue points) in describing the data. For 12% of the slant-tilt selective neurons, the simpler five parameter model outperformed the seven parameter model (B5>B7; red points).
Sensitivity to the third rotational degree-of-freedom
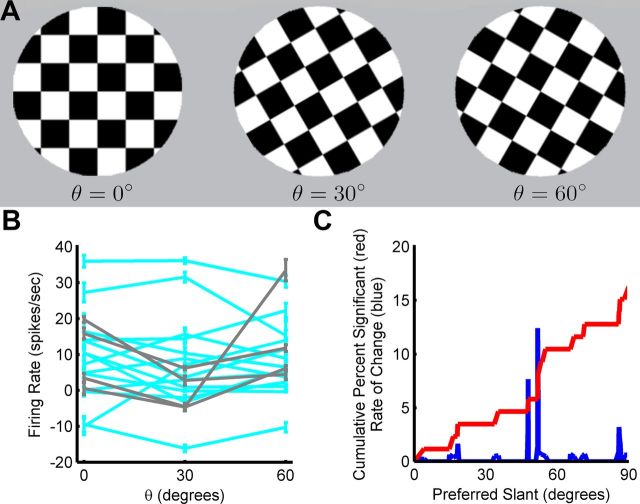
A complete assessment of a neuron's orientation-tuning properties requires measuring its sensitivity to all three rotational degrees of freedom describing 3D object orientation. Prior studies focused on tilt and to a lesser extent slant, but sensitivity to all 3 df was never before tested. For a planar surface, this third degree of freedom can be parameterized as a rotation about the normal vector (0° ≤ θ < 360°), and describes the orientation of the image on the face of the plane. To test for sensitivity to this third degree of freedom, we interleaved with the slant-tilt measurements a frontoparallel plane with the checkerboard image at different orientations for 92 CIP neurons (Fig. 9A). Note that this rotation is distinct from tilt (Fig. 2A) since it never changes the direction of the plane's normal vector. Of these 92 cells, 86 were slant-tilt selective (Fig. 4) and 6 were not (Fig. 5). An ANOVA was used to determine whether the firing rate of each cell depended significantly (p < 0.05) on the image's orientation (Fig. 9B). The responses of approximately 16% (14/86) of the slant-tilt selective neurons were significantly tuned for the third rotational degree of freedom, and most of these preferred intermediate slants (Fig. 9C). Because the tuning curves of cells with intermediate slant preferences will be steepest near frontoparallel, they will be highly sensitive to orientation changes in this region (Purushothaman and Bradley, 2005). This suggests that if sensitivity to the third angular variable were always tested near inflection points of the slant-tilt tuning curve (i.e., where the derivative is greatest in magnitude), then significant tuning may have been observed more often. Interestingly, a higher percentage of cells lacking a unique slant-tilt preference, 67% (4/6) were tuned for the orientation of the checkerboard image. The “4-prong star” appearance of some of their tuning curves (Fig. 5) may thus be attributable to this sensitivity to the orientation of the image within the plane combined with the 90° periodicity of the cross-hatching of a checkerboard pattern (Fig. 9A). This suggests that these cells may be directly involved in encoding the orientation of surface images.
Figure 9.
CIP neurons can also encode the third rotational degree of freedom. A, A frontoparallel plane with a checkerboard image on its surface was presented at three different orientations: θ = 0°, θ = 30°, and θ = 60°. Although image orientation on the face of a planar surface is generally 360° periodic, the cross-hatching of a checkerboard pattern has a periodicity of 90°. B, Tuning curves for the orientation of the checkerboard image plotted for significantly tuned responses only (ANOVA, p < 0.05; N = 18). Fourteen of these cells were selective for a unique slant-tilt (cyan; Fig. 4) and four were not (gray; Fig. 5). Responses are baseline subtracted. Consistent with a population that represents all spatial orientations, the peak response varied across cells. C, Cumulative distribution of the percentage of slant-tilt selective cells showing significant tuning for frontoparallel image orientation as a function of preferred slant (red). The derivative of the cumulative curve (blue) shows that the greatest increases in the percentage of tuned cells occurred at intermediate slant preferences.
Discussion
In this study, we performed a quantitative analysis of how 3D surface orientation is visually encoded. The fundamental advance making this possible was the development of computational tools designed to address the mathematical complexities of 3D rotations. These tools were designed to be highly flexible in that they may be parameterized to quantify orientation tuning curves measured for different objects with one, two, or three rotational degrees of freedom. Here, we focused on 2 df rotations, using the tools to characterize how individual neurons in area CIP of the macaque monkey jointly encode the slant and tilt of a planar surface. Across the population, the distribution of slant-tilt preferences was statistically indistinguishable from uniform, tiling the surface of a sphere. From a Bayesian perspective, this suggests that CIP population activity encodes a uniform prior over 3D orientation (i.e., one in which all orientations are equally likely). The sensitivity of CIP, for example to discriminate two similar orientations, may therefore be independent of the objects' absolute orientations in space (Gu et al., 2010). Such uniform coverage of 3D orientation may also be ideal for guiding interactions with objects, consistent with CIP's projection to AIP, an area implicated in the grasping of objects (Nakamura et al., 2001). Importantly, we also showed that single CIP neurons can visually encode all three rotational degrees of freedom needed to fully specify an object's 3D spatial orientation. These findings thus suggest that area CIP has a fundamental role in the visual encoding of 3D object orientation.
The slant-tilt parameterization of 3D orientation distinguishes rotations that change the extent of an object's depth variation (slant) from those that do not (tilt). This is conceptually appealing since sensitivity to these two angular variables emerges sequentially within the visual system. Specifically, tilt selectivity emerges first as a robust tuning property in primary visual cortex (Hubel and Wiesel, 1959; Xu et al., 2002; Rosenberg et al., 2010) where there is limited, if any, representation of slant (Blakemore et al., 1972; Nelson et al., 1977; Bridge and Cumming, 2001; Sanada and Ohzawa, 2006). Several previous reports suggest that slant selectivity may be found in a number of extrastriate visual areas (Hinkle and Connor, 2002; Nguyenkim and DeAngelis, 2003; Liu et al., 2004), but slant tuning was only measured systematically in area V4, and no study characterized the joint representation of slant and tilt. The present results build qualitatively upon these and other earlier findings. For instance, prior work in CIP only measured tilt tuning (Taira et al., 2000), whereas we demonstrated that single neurons can visually encode all three rotational degrees of freedom. In area MT, tilt tuning was reported to emerge at large slants for stimuli rendered as linear gradients of horizontal disparity (Nguyenkim and DeAngelis, 2003). However, because of the nonlinear relationship between disparity and depth (Cormack and Fox, 1985), the stimulus became increasingly curved as the slant angle increased, confounding shape with orientation tuning. In addition, MT neurons that were tilt selective at large slants also responded strongly to small slants. It thus remains unclear whether MT neurons show bandpass tuning for slant-tilt, as we found in CIP using stimuli without a shape–orientation confound. In a study conducted in the dorsal medial superior temporal area, stimuli were rendered such that two surfaces leaning in opposite directions produced identical retinal stimulation, and therefore the results cannot be interpreted as surface orientation tuning (Sugihara et al., 2002). One of the clearest prior demonstrations of 3D orientation selectivity was in V4, where tuning was measured using a bar (Hinkle and Connor, 2002). However, because the data were not quantified analytically, the distribution of slant and tilt preferences represented in area V4 remains unclear. In future studies it will be interesting to determine whether other visual areas exhibiting 3D orientation selectivity encode a uniform distribution of orientations, or whether they are biased in some way that creates greater sensitivity to particular orientations. It will also be important to examine whether the 3D orientation selectivity of single neurons generalizes across objects (e.g., bars and planes). At the same time that the symmetries of achiral stimuli such as bars and planes are convenient for demonstrating 3D orientation selectivity, such objects only partially sample the full space of 3D rotations. In particular, they either constrain or eliminate the third degree of freedom (Fig. 9A) and make 1 or 2 df rotations antipodally symmetric. Although antipodally symmetric tuning (i.e., tuning that is 180° rather than 360° periodic) is an inherent property of some neurons encoding either orientation (DeAngelis et al., 1993; Rosenberg and Issa, 2011) or direction of motion (Rosenberg et al., 2008), further examination may reveal that this is not the case in CIP. Indeed, observations from this study suggest that CIP neurons may generally be tuned for all three rotational degrees of freedom describing object orientation. First, since the orientation of a frontoparallel checkerboard image was sufficient to drive a tuned response for some neurons, a more orientable image such as a face (i.e., one having a periodicity of 360°) may be more likely to reveal significant tuning. Second, for a planar surface, the third rotational degree of freedom only affects the texture pattern on the face of the plane. The presentation of an object with a more elaborate (nonplanar) 3D shape where any rotation is signaled both by disparity and texture changes would be more likely to elicit tuned responses for all three rotational degrees of freedom. Considering these observations, finding that the orientation of a frontoparallel checkerboard image can elicit tuned responses suggests that CIP neurons are exquisitely sensitive to all three rotational degrees of freedom describing an object's 3D spatial orientation. To fully explore the space of 3D rotations, it will be necessary to measure responses to stimuli with some symmetry-breaking feature (e.g., a bar or plane with a curve at one end or edge). Tuning over this space can be quantified using a Bingham function parameterized for all three rotational degrees of freedom. Last, an intriguing question to ask is whether CIP (or any other 3D orientation selective area) dynamically changes its coverage of spatial orientation in a task-dependent manner. If so, this would imply that the representation of 3D object orientation updates in a context-dependent manner similar to the contextual remapping of the representation of space that occurs in the hippocampus (Smith and Mizumori, 2006). Consistent with this possibility, contextual features such as required grip force, viewing conditions, and intended object manipulation modify grasp representations in both macaque AIP (Baumann et al., 2009), which receives input from CIP (Nakamura et al., 2001), and the human homolog of AIP (Verhagen et al., 2008; Marangon et al., 2011).
Footnotes
This work was supported by NIH Grant 5-T32-EY13360-10 (A.R.), NSF Grant 0845749, and Office of Naval Research Under Grant N000140910531 (N.J.C.), NIH Grants EY15271 and EY022538 (D.E.A.), and the Koetser Foundation for Brain Research. We thank Mandy Turner for help with monkey care and training, Jian Chen and Jing Lin for help with the stimulus presentation software, Babatunde Adeyemo for help with the MRI analysis, Alican Demir for help with the technical schematic used in Figure 2, and Adhira Sunkara for helpful comments on this manuscript.
The authors declare no competing financial interests.
References
- Angelaki DE, Hess BJ. Control of eye orientation: where does the brain's role end and the muscle's begin? Eur J Neurosci. 2004;19:1–10. doi: 10.1111/j.1460-9568.2004.03068.x. [DOI] [PubMed] [Google Scholar]
- Baumann MA, Fluet MC, Scherberger H. Context-specific grasp movement representation in the macaque anterior intraparietal area. J Neurosci. 2009;29:6436–6448. doi: 10.1523/JNEUROSCI.5479-08.2009. [DOI] [PMC free article] [PubMed] [Google Scholar]
- Bingham C. An antipodally symmetric distribution on the sphere. Ann Stat. 1974;2:1201–1225. doi: 10.1214/aos/1176342874. [DOI] [Google Scholar]
- Blakemore C, Fiorentini A, Maffei L. A second neural mechanism of binocular depth discrimination. J Physiol. 1972;226:725–749. doi: 10.1113/jphysiol.1972.sp010006. [DOI] [PMC free article] [PubMed] [Google Scholar]
- Bridge H, Cumming BG. Responses of macaque V1 neurons to binocular orientation differences. J Neurosci. 2001;21:7293–7302. doi: 10.1523/JNEUROSCI.21-18-07293.2001. [DOI] [PMC free article] [PubMed] [Google Scholar]
- Burnham KP, Anderson DR. Model selection and multi-model inference: a practical information-theoretic approach. New York: Springer; 2002. [Google Scholar]
- Chen A, DeAngelis GC, Angelaki DE. Macaque parieto-insular vestibular cortex: responses to self-motion and optic flow. J Neurosci. 2010;30:3022–3042. doi: 10.1523/JNEUROSCI.4029-09.2010. [DOI] [PMC free article] [PubMed] [Google Scholar]
- Cormack R, Fox R. The computation of retinal disparity. Percept Psychophys. 1985;37:176–178. doi: 10.3758/BF03202855. [DOI] [PubMed] [Google Scholar]
- Cowan NJ, Weingarten JD, Koditschek DE. Visual servoing via navigation functions. IEEE Trans Robot Automat. 2002;18:521–533. doi: 10.1109/TRA.2002.802202. [DOI] [Google Scholar]
- Craig JJ. Introduction to robotics: mechanics and control. Ed 3. London: Prentice Hall; 2005. [Google Scholar]
- Crawford JD, Martinez-Trujillo JC, Klier EM. Neural control of three-dimensional eye and head movements. Curr Opin Neurobiol. 2003;13:655–662. doi: 10.1016/j.conb.2003.10.009. [DOI] [PubMed] [Google Scholar]
- DeAngelis GC, Ohzawa I, Freeman RD. Spatiotemporal organization of simple-cell receptive fields in the cat's striate cortex. II. Linearity of temporal and spatial summation. J Neurophysiol. 1993;69:1118–1135. doi: 10.1152/jn.1993.69.4.1118. [DOI] [PubMed] [Google Scholar]
- Gu Y, Fetsch CR, Adeyemo B, Deangelis GC, Angelaki DE. Decoding of MSTd population activity accounts for variations in the precision of heading perception. Neuron. 2010;66:596–609. doi: 10.1016/j.neuron.2010.04.026. [DOI] [PMC free article] [PubMed] [Google Scholar]
- Gubbins D, Herrero-Bervera E. Encyclopedia of geomagnetism and paleomagnetism. Berlin: Springer; 2007. [Google Scholar]
- Haslwanter T. Mathematics of three-dimensional eye rotations. Vision Res. 1995;35:1727–1739. doi: 10.1016/0042-6989(94)00257-M. [DOI] [PubMed] [Google Scholar]
- Hinkle DA, Connor CE. Three-dimensional orientation tuning in macaque area V4. Nat Neurosci. 2002;5:665–670. doi: 10.1038/nn875. [DOI] [PubMed] [Google Scholar]
- Hubel DH, Wiesel TN. Receptive fields of single neurones in the cat's striate cortex. J Physiol. 1959;148:574–591. doi: 10.1113/jphysiol.1959.sp006308. [DOI] [PMC free article] [PubMed] [Google Scholar]
- Katsuyama N, Yamashita A, Sawada K, Naganuma T, Sakata H, Taira M. Functional and histological properties of caudal intraparietal area of macaque monkey. Neuroscience. 2010;167:1–10. doi: 10.1016/j.neuroscience.2010.01.028. [DOI] [PubMed] [Google Scholar]
- Lewis JW, Van Essen DC. Mapping of architectonic subdivisions in the macaque monkey, with emphasis on parieto-occipital cortex. J Comp Neurol. 2000;428:79–111. doi: 10.1002/1096-9861(20001204)428:1<79::AID-CNE7>3.0.CO%3B2-Q. [DOI] [PubMed] [Google Scholar]
- Li B, Peterson MR, Freeman RD. Oblique effect: a neural basis in the visual cortex. J Neurophysiol. 2003;90:204–217. doi: 10.1152/jn.00954.2002. [DOI] [PubMed] [Google Scholar]
- Liu Y, Vogels R, Orban GA. Convergence of depth from texture and depth from disparity in macaque inferior temporal cortex. J Neurosci. 2004;24:3795–3800. doi: 10.1523/JNEUROSCI.0150-04.2004. [DOI] [PMC free article] [PubMed] [Google Scholar]
- Marangon M, Jacobs S, Frey SH. Evidence for context sensitivity of grasp representations in human parietal and premotor cortices. J Neurophysiol. 2011;105:2536–2546. doi: 10.1152/jn.00796.2010. [DOI] [PMC free article] [PubMed] [Google Scholar]
- Mardia KV, Jupp PE. Directional statistics. Chichester: Wiley; 2000. [Google Scholar]
- Marr D. Vision: a computational investigation into the human representation and processing of visual information. San Francisco: Freeman and Company; 1982. [Google Scholar]
- Nakamura H, Kuroda T, Wakita M, Kusunoki M, Kato A, Mikami A, Sakata H, Itoh K. From three-dimensional space vision to prehensile hand movements: the lateral intraparietal area links the area V3A and the anterior intraparietal area in macaques. J Neurosci. 2001;21:8174–8187. doi: 10.1523/JNEUROSCI.21-20-08174.2001. [DOI] [PMC free article] [PubMed] [Google Scholar]
- Nelson JI, Kato H, Bishop PO. Discrimination of orientation and position disparities by binocularly activated neurons in cat striate cortex. J Neurophysiol. 1977;40:260–283. doi: 10.1152/jn.1977.40.2.260. [DOI] [PubMed] [Google Scholar]
- Nguyenkim JD, DeAngelis GC. Disparity-based coding of three-dimensional surface orientation by macaque middle temporal neurons. J Neurosci. 2003;23:7117–7128. doi: 10.1523/JNEUROSCI.23-18-07117.2003. [DOI] [PMC free article] [PubMed] [Google Scholar]
- Purushothaman G, Bradley DC. Neural population code for fine perceptual decisions in area MT. Nat Neurosci. 2005;8:99–106. doi: 10.1038/nn1373. [DOI] [PubMed] [Google Scholar]
- Ringach DL, Hawken MJ, Shapley R. Dynamics of orientation tuning in macaque primary visual cortex. Nature. 1997;387:281–284. doi: 10.1038/387281a0. [DOI] [PubMed] [Google Scholar]
- Rosenberg A, Issa NP. The Y cell visual pathway implements a demodulating nonlinearity. Neuron. 2011;71:348–361. doi: 10.1016/j.neuron.2011.05.044. [DOI] [PubMed] [Google Scholar]
- Rosenberg A, Wallisch P, Bradley DC. Responses to direction and transparent motion stimuli in area FST of the macaque. Vis Neurosci. 2008;25:187–195. doi: 10.1017/S0952523808080528. [DOI] [PubMed] [Google Scholar]
- Rosenberg A, Husson TR, Issa NP. Subcortical representation of non-Fourier image features. J Neurosci. 2010;30:1985–1993. doi: 10.1523/JNEUROSCI.3258-09.2010. [DOI] [PMC free article] [PubMed] [Google Scholar]
- Sanada TM, Ohzawa I. Encoding of three-dimensional surface slant in cat visual areas 17 and 18. J Neurophysiol. 2006;95:2768–2786. doi: 10.1152/jn.00955.2005. [DOI] [PubMed] [Google Scholar]
- Sanada TM, Nguyenkim JD, Deangelis GC. Representation of 3-D surface orientation by velocity and disparity gradient cues in area MT. J Neurophysiol. 2012;107:2109–2122. doi: 10.1152/jn.00578.2011. [DOI] [PMC free article] [PubMed] [Google Scholar]
- Smith DM, Mizumori SJ. Learning-related development of context-specific neuronal responses to places and events: the hippocampal role in context processing. J Neurosci. 2006;26:3154–3163. doi: 10.1523/JNEUROSCI.3234-05.2006. [DOI] [PMC free article] [PubMed] [Google Scholar]
- Snyder JP. U.S. Geological Society Professional Paper 1395. Washington, DC: United States Government Printing Office; 1987. Map projections—a working manual. [Google Scholar]
- Stevens KA. Slant-tilt: the visual encoding of surface orientation. Biol Cybern. 1983;46:183–195. doi: 10.1007/BF00336800. [DOI] [PubMed] [Google Scholar]
- Sugihara H, Murakami I, Shenoy KV, Andersen RA, Komatsu H. Response of MSTd neurons to simulated 3D orientation of rotating planes. J Neurophysiol. 2002;87:273–285. doi: 10.1152/jn.00900.2000. [DOI] [PubMed] [Google Scholar]
- Taira M, Tsutsui KI, Jiang M, Yara K, Sakata H. Parietal neurons represent surface orientation from the gradient of binocular disparity. J Neurophysiol. 2000;83:3140–3146. doi: 10.1152/jn.2000.83.5.3140. [DOI] [PubMed] [Google Scholar]
- Tsutsui K, Jiang M, Yara K, Sakata H, Taira M. Integration of perspective and disparity cues in surface-orientation-selective neurons of area CIP. J Neurophysiol. 2001;86:2856–2867. doi: 10.1152/jn.2001.86.6.2856. [DOI] [PubMed] [Google Scholar]
- Tweed DB, Haslwanter TP, Happe V, Fetter M. Non-commutativity in the brain. Nature. 1999;399:261–263. doi: 10.1038/20441. [DOI] [PubMed] [Google Scholar]
- Van Essen DC, Lewis JW, Drury HA, Hadjikhani N, Tootell RB, Bakircioglu M, Miller MI. Mapping visual cortex in monkeys and humans using surface-based atlases. Vision Res. 2001;41:1359–1378. doi: 10.1016/S0042-6989(01)00045-1. [DOI] [PubMed] [Google Scholar]
- Verhagen L, Dijkerman HC, Grol MJ, Toni I. Perceptuo-motor interactions during prehension movements. J Neurosci. 2008;28:4726–4735. doi: 10.1523/JNEUROSCI.0057-08.2008. [DOI] [PMC free article] [PubMed] [Google Scholar]
- Xu X, Ichida J, Shostak Y, Bonds AB, Casagrande VA. Are primate lateral geniculate nucleus (LGN) cells really sensitive to orientation or direction? Vis Neurosci. 2002;19:97–108. doi: 10.1017/s0952523802191097. [DOI] [PubMed] [Google Scholar]
- Yershova A, LaValle SM. Deterministic sampling methods for spheres and SO(3). Paper presented at the IEEE International Conference on Robots and Automation; April; New Orleans, LA. 2004. [Google Scholar]


