Abstract
Oriented solid-state NMR (O-ssNMR) spectroscopy is a major technique for the high-resolution analysis of the structure and topology of transmembrane proteins in native-like environments. Unlike magic angle spinning (MAS) techniques, O-ssNMR spectroscopy requires membrane protein preparations that are uniformly oriented (mechanically or magnetically) so that anisotropic NMR parameters, such as dipolar and chemical shift interactions, can be measured to determine structure and orientation of membrane proteins in lipid bilayers. Traditional sample preparations involving mechanically aligned lipids often result in short relaxation times which broaden the 15N resonances and encumber the manipulation of nuclear spin coherences. The introduction of lipid bicelles as membrane mimicking systems has changed this scenario, and the more favorable relaxation properties of membrane protein 15N and 13C resonances make it possible to develop new, more elaborate pulse sequences for higher spectral resolution and sensitivity. Here, we describe our recent progress in the optimization of O-ssNMR pulse sequences. We explain the theory behind these experiments, demonstrate their application to small and medium size proteins, and describe the technical details for setting up these new experiments on the new generation of NMR spectrometers.
Keywords: Oriented solid-state NMR, Sensitivity enhancement, Resolution enhancement, Dipolar couplings, Chemical shift anisotropy
1. Introduction
High-resolution structures of membrane proteins are being solved with an exponential progression similar to that of soluble membrane proteins. To date, however, the total number of membrane proteins determined is dramatically lower, with only 300 unique folds identified compared to ~70,000 for the soluble counterpart. Without any doubt, X-ray spectroscopy plays a major role in the structure determination of membrane proteins. Nonetheless, crystallized membrane proteins do not contain physiologically relevant concentrations of the lipids that enable biological function. In contrast, solid-state NMR is the only spectroscopic technique that provides atomic-resolution structural information of membrane proteins in lipid preparations and under functional conditions [1–3]. Unfortunately, the throughput of solid-state NMR structures has been very low. In fact, solving membrane protein structure at high resolution by solid-state NMR methods requires not only great skill in protein expression and sample preparation [1,4] but also a great deal of knowledge of spectroscopic methods that need to be adapted to the sample behavior.
Currently, there are two major methodologies that enable the structure determination of membrane proteins: magic angle spinning (MAS), and oriented-solid-state (O-ssNMR). In MAS-NMR, membrane protein samples reconstituted in lipid membranes are spun at the magic angle (54.7°) to attenuate dipolar and chemical shift anisotropic interactions with resonances that are dispersed according to their local chemical environment. However, dipolar couplings (DC) and chemical shift anisotropy (CSA) can be recovered using recoupling techniques and used for structure determination [5–8]. In contrast, O-ssNMR experiments that directly measure DCs and CSAs require oriented samples, whose preparation is more laborious. Traditionally, uniaxially oriented membrane protein preparations involved the reconstitution of membrane proteins in aligned membrane bilayers immobilized onto glass plates [5–16]. Excellent references regarding these preparations can be found in many reviews [17–22]. These preparations suffer from lack of control over sample hydration and pH, and are also not optimal with regards to coil-filling and compatibility with all proteins. More recently, oriented samples of membrane proteins have been prepared in lipid bicelles [23,24], which are preparations of mixtures of short-chain detergent-like lipids (e.g., DHPC. CHAPSO, TritonX-100, DPC) and long-chain lipids (typically DMPC or DMPC doped with 20% unsaturated lipids such as POPC) [24,25]. Bicelles with a sufficiently large ‘q-ratio’, i.e., the molar ratio of long to short chain lipids, are capable of spontaneously aligning in the high field of the NMR spectrometers and are thus an alternative to mechanically aligned bilayers for oriented solid state NMR experiments [24]. Fully hydrated bicelles undergo fast rotational diffusion, averaging out part of the anisotropy and increasing the T1ρ. The latter renders line-shapes for amide resonances of membrane proteins that are similar to those of globular proteins [26,27]. In addition, bicelles offer complete control over sample hydration and pH, and the preparations, although limited to a small subset of lipids, are generally compatible with single TM and polytopic membrane proteins [28]. The preparations tend to minimize the conformational heterogeneity of membrane proteins as compared to the mechanically aligned bilayers, giving spectra with higher resolution [29].
A significant advantage of O-ssNMR over MAS is that the resonances are more dispersed because there is an anisotropic contribution to nuclear shielding, which produces a larger breadth of chemical shifts. More importantly, the anisotropic interactions with the external magnetic field obtained from these experiments allow the calculation of the entire membrane protein topology as parameters such as tilt and rotation angle of transmembrane segments are encoded directly in these spectra [30,31]. In order to take advantage of these spectral features, we recently developed new methods to obtain higher resolution and sensitivity. We recrafted the classical separated local field (SLF) experiments into sensitivity enhanced (SE) versions [32–35] as well as constant time (CT) variants [36] that enabled us to carry out 2D and 3D NMR experiments on membrane proteins. In this review, we describe the theory, the technical details as well as our recent applications of these new techniques for the structure determination of membrane proteins.
2. Sensitivity enhancement (SE) of separated local field (SLF) experiments
2.1. Theory of SE-SLF
Transient heteronuclear dipolar oscillations during Hartmann– Hahn cross polarization (CP) were first observed by Muller et al. on ferrocene single crystal [37]. In the case of a weak 1H–1H dipolar-coupled network such as in liquid crystals and ferrocene single crystal, the CP evolution of the I–S (1H–13C or 1H–15N) spin system gives rise to oscillating dipolar coherences that can be Fourier transformed to obtain the I–S DC [38]. However, for most solids including membrane proteins, the spin-diffusion among protons mediated by the strong homonuclear dipolar couplings (~50–150 kHz) attenuate heteronuclear oscillations [39]. A solution to this problem was introduced by Waugh, who pioneered the SLF spectroscopy that suppresses the 1H–1H DCs during heteronuclear DC evolution in the indirect dimension [40]. This experiment was the first example of two-dimensional separated local field (SLF) spectroscopy and enabled one to separate the chemical shifts of the low-abundant nucleus (S) from the I–S heteronuclear DC. Note that the spin–spin JIS coupling constants contribute to the splitting in the indirect dimension of SLF spectra (JIS values are few tens of Hz). However, the contribution of JIS is neglected in the SLF spectra of membrane proteins due to relatively larger line widths.
A typical SLF experiment consists of a CP from the abundant I spin bath to the less abundant S spins (typically 15N or 13C) to generate transverse S spin magnetization that evolves for a t1 period under I–S DC and is followed by the S-spin chemical shift evolution. Although applicable to small molecules with success, this experiment suffers from low sensitivity and resolution of the dipolar dimension. In 1994, Opella and co-workers introduced a method utilizing the evolution of heteronuclear DC via I–S spin exchange at Hartmann–Hahn matching condition, so-called polarization inversion spin exchange at magic angle (PISEMA) [41]. PISEMA uses a frequency switching Lee-Goldberg (FSLG) homonuclear decoupling [42] during t1 with simultaneous phase switched spin-lock on the S spins under Hartmann–Hahn (HH) matching condition. Importantly, PISEMA includes a polarization inversion scheme on the I (or S) spins prior to t1 evolution, which makes the initial density matrix in pure ZQ state that evolves during t1 under zero quantum dipolar Hamiltonian [43]. Unlike the original SLF experiment, PISEMA has a higher scaling factor (0.82) of the DC evolution. The latter combined with the polarization inversion scheme and the relatively slower T1ρ relaxation of the DC evolution (2–5 ms) make it possible to obtain well-resolved spectra for liquid crystals and single crystals, as well as oriented membrane proteins [44]. Several variants of PISEMA have been implemented that differ mainly in the t1 dipolar evolution. Notably, all of these pulse sequences use polarization inversion followed by dipolar evolution, with the spin exchange mechanism at Hahn–Hartman matching condition [26,45–47]. Alternative pulse schemes have also been developed to improve power requirements [48], also rendering it broad-band [46,49]. The PISEMA sequence and its variants are also known as rotating frame SLF (R-SLF) sequences, as the magnetization transfer and the DC evolution take place in the rotating frames defined by spin-lock pulses [50]. In the following we use the notation SLF for R-SLF sequences.
A common feature of all of the SLF experiments is that during the acquisition period only the cosine component of the dipolar coherences is detected, while the sine component is encoded in an undetectable DQ and ZQ coherences and discarded. To recover the sine component and increase the detected signal, we proposed a sensitivity enhanced (SE) method that recovers the sine component of the dipolar coherences and sums it to the cosine components [32]. The SE method implemented in the SLF experiments (SE-SLF) simultaneously detects both cosine and sine dipolar coherences, leading to a sensitivity enhancement of up to 40% [32,34]. In the following synopsis, we describe the density matrices for SE-SLF sequences in the isolated I–S spin system approximation.
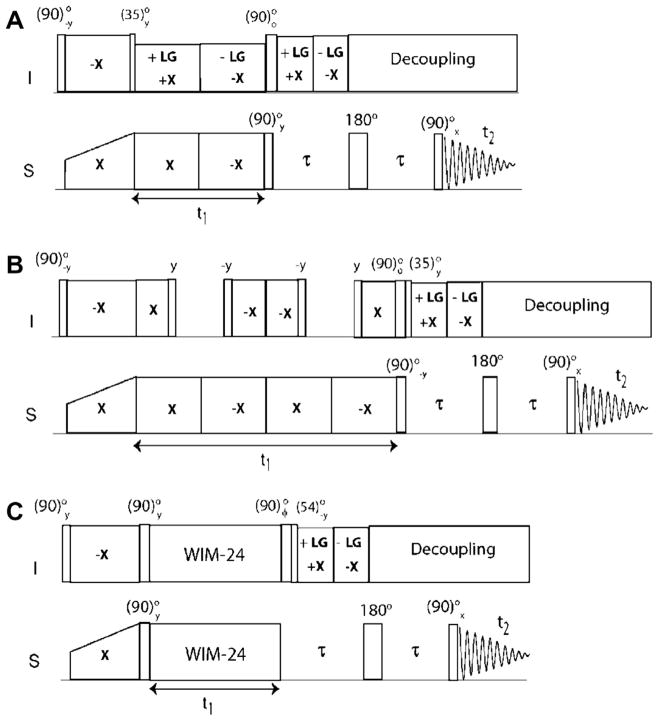
The SE-SLF pulse sequence can be divided into four parts (Fig. 1): (1) an initial cross polarization from I (1H) spin bath to S (13C or 15N) spins; (2) heteronuclear (I–S) dipolar evolution during t1; (3) sensitivity enhancement scheme; and (4) chemical shift evolution of the S spin during the t2 acquisition period, under heteronuclear dipolar decoupling.
Fig. 1.
Pulse sequence diagrams of sensitivity enhanced separated local field (SE-SLF) experiments. (A) SE-PISEMA, (B) SE-SAMPI4, and (C) SE-HIMSELF. The phase φ is set to y and −y for phase sensitive acquisition of the t1 dimension. The delay, τ, is set to 50–120 μs depending on the range of DC values.
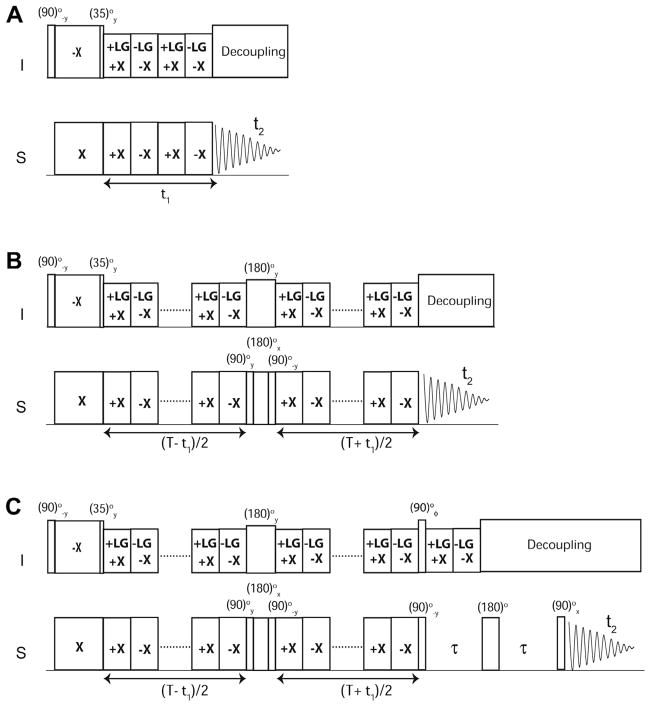
The SLF pulse sequence starts with a preparation pulse applied on the I spins, followed by HH CP spin-lock pulses on the I and S spins with phases −x and x, respectively. The CP period is followed by the I–S DC evolution under I–I homonuclear dipolar decoupling. The HH matching condition is satisfied by applying phase-switched spin-lock pulses on the S spins. For PISEMA and SAMPI4 experiments, homonuclear decoupling is respectively achieved with the FSLG scheme and a variant of MSHOT [51] (i.e., SAMPI4) [26]. For the HIMSELF experiment, the WIM24 decoupling is applied on both channels [45,52]. For the SE-PISEMA experiment, the evolution of the I–S spin system is given by:
| (1) |
where U′ = e−iθmIy · e−i(π/2)Sy, H′(t1) = sPISEMA · ωIS · (2IxSx + 2IySy), U″ = e−iθmIy, H″ (2τ) = cos θmωIS2IzSz, and ωIS = 2π · DIS.
In Eq. (1), U′ and U″ respectively represent the mathematical transformations known as the doubly and singly tilted rotating frames; H′ and H″ represent the Hamiltonians; DIS is the dipolar coupling, and the scaling factor is SPISEMA = 0.82. Note that the sign of the sine dipolar coherence is inverted by changing the phase of the (90°)I pulse after t1 evolution. In Eq. (1), only observable operators are reported, while unobservable operators are indicated by dots. The two scans (FIDs) are stored in separate files for phase sensitive FT processing in the t1 dimension. Note that in conventional SLF experiments t1 dimension is processed with real FT. The density matrices for SE-SAMPI4 and SE-HIMSELF are derived in a similar manner, as follows:
| (2) |
where U′ = e−i(π/2)Iy · e−i(π/2)Sy, H′ (t1) = sSAMPI4 · ωIS · (2IxSx + 2IySy), U″ = e−i(θm)Iy, H″ (2τ) = cos θmωIS2IzSz, and ωIS = 2π · DIS.
| (3) |
where H″ (t1) = sHIMSELF · ωIS · (2IxSx + 2IySy), U″ = e−iθmIy, H″ (2τ) = cosθmωIS2IzSz, and ωIS = 2π · DIS.
After S spin chemical shift evolution during t2, the final density matrices of SE-PISEMA, SE-SAMPI4, and SE-HIMSELF (Eqs. (1)–(3)) are represented in the S spin rotating frame. Considering only the detectable single quantum operators, the generalized equation for all three SE-SLF experiments is given by:
| (4) |
Addition and subtraction of ρ+ and ρ− give the cosine and sine dipolar coherences, ρc and ρs, respectively:
| (5) |
Note that the ρc and ρs coherences are 90° phase-shifted in both the t1 and t2 dimensions; in order to obtain a pure absorptive peak shape, a 90° zero-order phase correction needs to be applied either before or after Fourier transformation. The resultant SE-SLF spectrum is obtained by adding ρc and ρs:
| (6) |
A two-dimensional FT of ρc and ρs correlates S spin chemical shift with the I–S dipolar doublet, with the DC equal to half the distance between doublet peaks. Note that conventional SLF sequences detect only the cosine dipolar coherence followed by t1 evolution. The dipolar peaks for each doublet have the same sign for ρc and opposite sign for ρs. Therefore, addition of the two data sets gives a two-dimensional spectrum where the intensity of one component of the doublet is increased by the factor [1 + sin(cosθmωISτ)] with respect to the corresponding peak obtained using the conventional SLF experiment with an identical number of scans [32]. The root mean square (RMS) noise of ρc and ρs is identical to that of ρSLF (Eq. (6)). Since the RMS of the noise is uncorrelated, addition or subtraction of the two datasets (ρc and ρs) increases the noise level by √2. The latter is similar to the SE schemes used for liquid-state NMR [53,54]. Therefore, the signal-to-noise for the SE-SLF experiment, (S/N)SE-SLF, is given by:
| (7) |
2.2. Applications of SE-SLF experiments to single crystals and membrane proteins
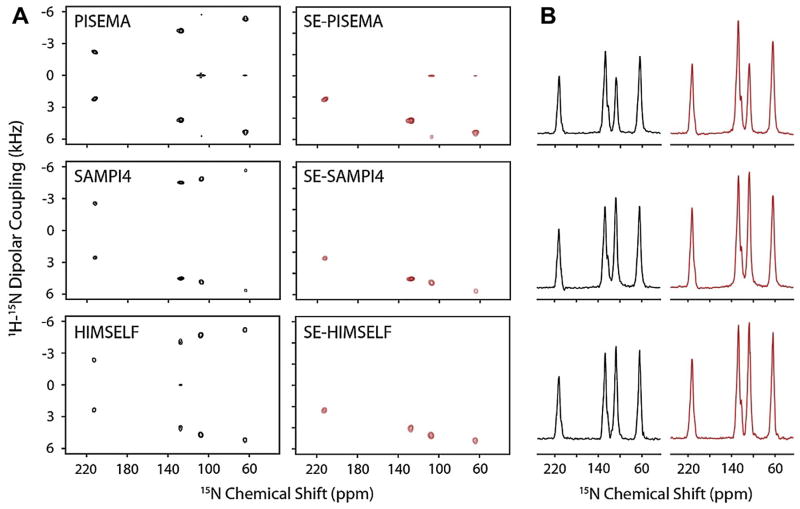
Due to their higher sensitivity and narrow resonance line-widths, single crystals are ideal samples for optimizing pulse sequences. The SE pulse sequences were all optimized using a single crystal sample of N-acetyl-leucine (NAL) (see Fig. 19 for the chemical structure of NAL), then applied to uniformly 15N-labeled sarcolipin (SLN), a 31 amino acid membrane protein reconstituted in lipid bicelles [34]. The sample preparation for both SLN and the single crystal are reported elsewhere [55,56]. Fig. 2 shows a series of solid-state NMR spectra of an NAL single crystal obtained using the conventional SLF pulse sequence as well as the corresponding SE variants. For conventional SLF experiments, each 15N resonance displays only one doublet due to the 15N–1H DC. Unlike 13C, 15N nuclei couple strongly with the directly attached amide protons and have negligible DCs with the long-range protons, resulting in SLF spectra consisting of a doublet for each 15N–1H spin system. Fig. 2 shows the spectra of an NAL single crystal with a sensitivity enhancement close to theoretical values for all of the resonances. In addition, the SE variants of the SLF experiments show a substantial reduction of the zero frequency signals that represents a significant obstacle to separate resonances with small dipolar couplings [32,34]. For the SLN samples, we used both unflipped and flipped lipid bicelles preparations, where unflipped and flipped bicelles orient with their bilayer normal perpendicular and parallel to the direction of the static magnetic field, respectively. Flipped bicelles have the advantage of doubling the 15N chemical shift breadth, and line narrowing does not require fast uniaxial rotation. To change the orientation of the bicelles, however, it is necessary to add millimolar quantities of lanthanide ions such as Yb3+, Em3+, Eu3+ or Tm3+ [57,58]. For SLN, high resolution spectra can be obtained in DMPC/D6PC or DMPC/POPC/D6PC bicelles doped with Yb3+ (Fig. 4A and B) [55]. While generally nondisruptive, these ions can potentially interact with adventitious sites in membrane proteins and modulate the alignment [59]. Alternately, it is possible to use bicelles that self-align with their bilayer normal parallel to the magnetic field such as TBBPC-based bicelles, with a phosphatidylcholine lipid (PC) containing a biphenyl group in one of its acyl chains (1-tetradecanoyl-2-(4-(4-biphenyl) butanoyl)-sn-glycero-3-PC, TBBPC) [60]. These systems self-align in the presence of a strong magnetic field with the bi-layer normal parallel to the direction of the field in a temperature range of 5–60 °C, giving PISEMA spectra comparable to the more common DMPC/D6PC bicelles (Fig. 4C) [60,61].
Fig. 19.
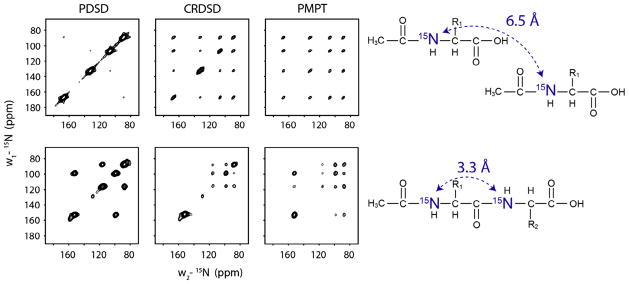
(A) 2D-correlation experiments using PDSD, CRDSD and MMHH on (A) NAL single crystal and (B) NAVL single crystal at arbitrary orientation. Reproduced from Ref. [56] with permission from American Chemical Society.
Fig. 2.
(A) Comparison of SLF (black) and SE-SLF (red) spectra of 15N-labeled N-acetyl leucine (NAL) single crystal at an arbitrary orientation at 16.5 T (B) Sum of the 1D cross sections between the DCs 2 and 7 kHz of F1 dimension. Reproduced from Ref. [32] with permission from American Chemical Society. (For interpretation of the references to color in this figure legend, the reader is referred to the web version of this article.)
Fig. 4.

SE-PISEMA spectrum of uniformly 15N-labeled SLN at 16.5T in (A) DMPC bicelles at 38 °C flipped with 5 mM YbCl3: 256 transients, 25 t1 points, t1 evolution = 1.0 ms, (B) DMPC/POPC bicelles at 25 °C flipped with 5 mM YbCl3: 288 transients, 25 t1 points, t1 evolution = 1.0 ms, (C) TBBPC bicelles at 10 °C: 512 transients, 14 t1 points, t1 evolution = 0.56 ms. Spectra in (A) and (B) are adapted from Ref. [55] with permission from Springer.
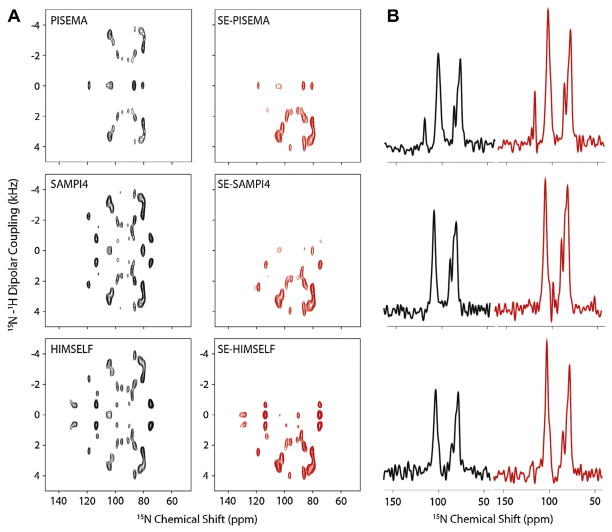
Fig. 3 shows the spectra of SLN in unflipped lipid bicelles. The amide resonances of the SLF spectra of SLN are relatively well-resolved. The DC and CSA feature wheel-like 2D patterns, resulting from the regular helical secondary structure of the transmembrane domain. In fact, it has been shown that regular secondary structure domains (α-helices, 3–10 helices, π-helices, and β-strands) give rise to oscillatory patterns of the DC and CSA that in 2D become wheel like patterns [31,62–64]. As for the single crystal case, the enhancement for all of the resonances both at high and low fields is apparent and close to the theoretical limit of 40%.
Fig. 3.
Comparison of SLF (black) and SE-SLF (red) spectra of the 15N labeled sarcolipin in unflipped DMPC bicelles and the 1D cross section along the F1 dimension at the DC of 2.5 kHz. Reproduced from Ref. [34] with permission from American Chemical Society. (For interpretation of the references to color in this figure legend, the reader is referred to the web version of this article.)
Although experiments with membrane proteins in bicelles directly follow from these experiments with single crystals, the relatively lower sensitivity makes pulse calibration challenging. The additional π/2 pulse on the S-spin required by the SE scheme can potentially reduce the sensitivity if not properly calibrated. Because of the wider range of DCs observed for resonances in the transmembrane domains of proteins, the contact time during CP must also optimized to obtain the best compromise in sensitivity for all peaks. This is achieved using a ramp-CP sequence [65,66]. In addition, the SE-scheme adds another variable τ to the pulse scheme, which needs to be set based on the expected dipolar couplings. For SLN, the dipolar couplings range from 1–4 and 2–8 kHz for unflipped and flipped bicelle preparations, respectively. Therefore, τ needs to be set to 125 and 75 μs, respectively, for maximum enhancements at DC values of 2.5 and 5.0 kHz. SLF experiments are also carried out with flipped bicelles, where the bilayer normal is parallel to the direction of the magnetic field.
3. Implementation of Hadamard encoding (HE) to increase the sensitivity of proton evolved local field (PELF) experiments
3.1. Theory HE-PELF
Proton detected/evolved local field (PDLF or PELF) experiments were initially utilized to separate the heteronuclear DC and 13C chemical shifts for CH, CH2 and CH3 spin systems in liquid crystal-line samples [67–69]. Unlike the R-SLF experiments, PELF can resolve multiple DCs (short- and long-range) in the presence of a strong homonuclear DC sequence applied on protons [70]. For liquid crystalline molecules, PELF experiments combined with PDSD leads to the complete assignment of 13C resonances, especially the CH3, CH2 and NH2 spin systems of small molecules or lipids [70–72]. For membrane proteins embedded in lipid bicelles, PELF experiments are more sensitive than R-SLF for the detection of mobile 15N–1H spin systems of protein backbone and side chains [73,74].
Fig. 5A shows the PELF pulse sequence that correlates the chemical shifts of spin S and I–S DC. The experiment consists of a 90° pulse on the I-spin that creates transverse magnetization, which evolves under I–S DC during t1 in the presence of 1H homonuclear decoupling (FSLG). A π pulse on I and S spins refocuses the I–spin chemical shift and recouples the I–S DC. Dipolar evolution is followed by WIM24 heteronuclear polarization transfer from spin I to S. The S spin magnetization is then detected during t2 acquisition under 1H decoupling. Several variants of PELF experiments have been implemented using different homonuclear decoupling – WA-HUHA [75,76], MREV-8 [77,78], BR-24 [79], FSLG [42], PMLG [80], BLEW [81], MSHOT [51], and heteronuclear polarization transfer (CP, LG, FSLG, WIM24) schemes. The sensitivity of the PELF experiments depends on the duration (τ1) of heteronuclear polarization transfer and the dipolar-coupling values. In other words, the τ1 period needs to be optimized according to the range of DCs of the resonances. Note that for membrane proteins, it has been shown that heteronuclear polarization transfer is more efficient with WIM than ramp-CP sequence [33] that is why WIM-CP is routinely used for O-ssNMR [82,83].
Fig. 5.
(A) PELF, and (B) HE-PELF (Hadamard-encoded PELF) experiments. In the HE-PELF experiments, the phases (ϕ1, ϕ2) are set to (y, y), (y, −y), (−y, y), and (−y, −y) in four interleaved acquisitions, where the number of scans for each (ϕ1, ϕ2) data set is one fourth of total number of scans used in PELF.
The t1 evolution of PELF experiments results in both in-phase and anti-phase spin operators for the cosine and sine dipolar coherences, respectively. However, the conventional PELF experiment detects only the in-phase cosine dipolar coherence. Indeed, all four coherences can be detected simultaneously, and our newly designed HE-PELF, i.e., Hadamard-encoded PELF enables the encoding and decoding of the different coherences into two separated 2D spectra with an optimized sensitivity for a wide range of DCs [35]. The evolution of the magnetization according to the HE-PELF is the following:
| (8) |
where , HWIM24 = sWIM24ωIS(IxSx + IySy), ωIS = 2πDIS, sFSLG = 0.57, sWIM24 = 0.66, θ1 = sWIM24ωISτ, .
For each t1 increment, four interleaved scans are acquired with phases (ϕ1, ϕ2) defined as (y, y), (y, −y), (−y, y) and (−y, −y), respectively. The resultant four density matrices are:
| (9) |
where c1 = sin2(θ1/2), , c3 = sin2(θ1/2) ·sin(θ1), and .
In Eq. (9), each density matrix consists of four terms whose signs correspond to the four rows of a four-dimensional Hadamard matrix (H). The coefficients c1, c2, c3, and c4 depend on the DC values that modulate the coherences in the time domains. In the density matrices, the absorptive and dispersive signals associated with cosine and sine DC coherences are separated by Hadamard decoding of the time domain data resulting from four scans:
| (10) |
The conventional PELF pulse sequence with four scans for each t1 increment detects only the Sx spin operator associated with cosine dipolar coherence, i.e.:
| (11) |
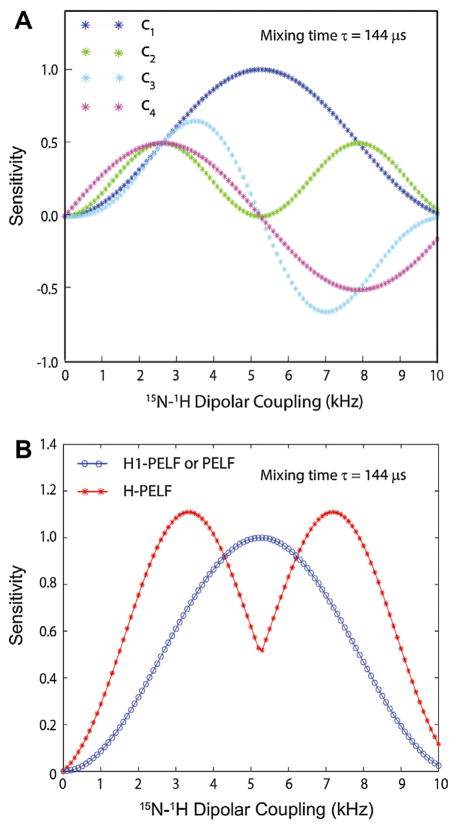
In contrast, each density matrix of the HE-PELF experiment results in a 2D spectrum that correlates DC values with the chemical shift of the S-spin. The intensities of the 2D peaks depend on the values of the coefficients (c1, c2, c3 and c4), while the phase modulation is a function of the corresponding trigonometric terms of Eq. (9). To obtain the maximum intensity upon summation of the four data sets, it is necessary to phase correct the data in Eq. (9) by 90°. This operation results in pure absorptive line shapes in both dimensions. Fig. 6 shows the plot of the coefficients c1, c2, c3, and c4 versus DC for a mixing time of 144 μs. For certain values of DC, c3 and c4 become negative. In this case, positive lines are obtained by processing each data set using magnitude mode. The resultant frequency domain data sets are added together to obtain an H-PELF spectrum:
| (12) |
Fig. 6.
(A) Simulated relative sensitivities of Hadamard decoded data sets obtained by plotting the coefficients c1, c2, c3 and c4 of Eq. (9) for a mixing time of 144 μs. (B) Comparison of the relative sensitivities of H-PELF and PELF (or H1-PELF) spectra obtained by plotting 2 (|c1| + |c2| + |c3| + |c4|) and 4c1, respectively (Eq. (8)) for a mixing time of 144 μs.
Adding the four 2D spectra |ρH1-PELF(ω1,ω2)|, |ρH2-PELF(ω1,ω2)|, |ρH3-PELF(ω1, ω2)|, and |ρH4-PELF(ω1, ω2)| after relative 90° zeroth-order phase corrections will increase the RMS noise of the resulting spectrum by . The RMS noise of the four spectra is identical to the ρPELF(ω1, ω2) spectrum in Eq. (11). The signal to noise ratio (SNR) for the H-PELF and PELF spectra can be written as:
| (13) |
The Hadamard decoded dataset ρH1-PELF (Eq. (10)) is identical to ρPELF (Eq. (11)), i.e., they both have the same SNR.
| (14) |
The sensitivity of the conventional PELF (Eq. (11)) experiment as a function of DC value, is given by the blue curve of Fig. 6. On the other hand, the HE-PELF pulse sequence results in two 2D spectra (H1-PELF and H-PELF) covering the dipolar couplings in the ranges defined by the blue and red curves of Fig. 6. Note that the HE-PELF experiment requires a number of scans that is a multiple of four. Typically a two-step phase cycle is applied to initial 90° pulse on the proton. In that case the number of scans is set to a multiple of eight.
3.2. Application of HE-PELF to single crystal and membrane proteins
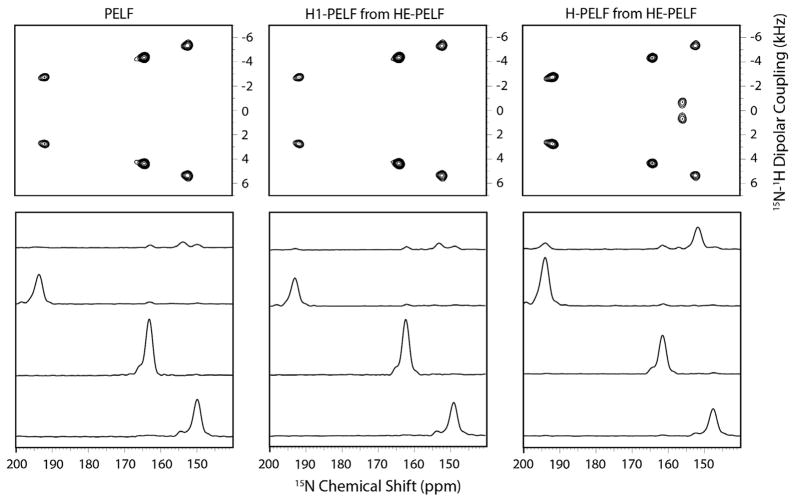
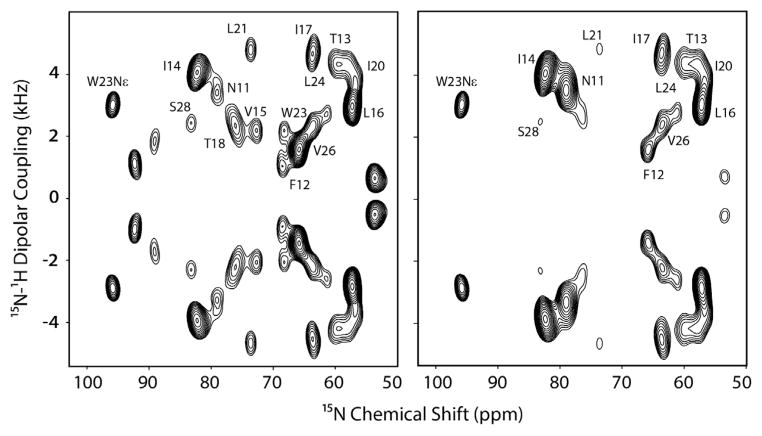
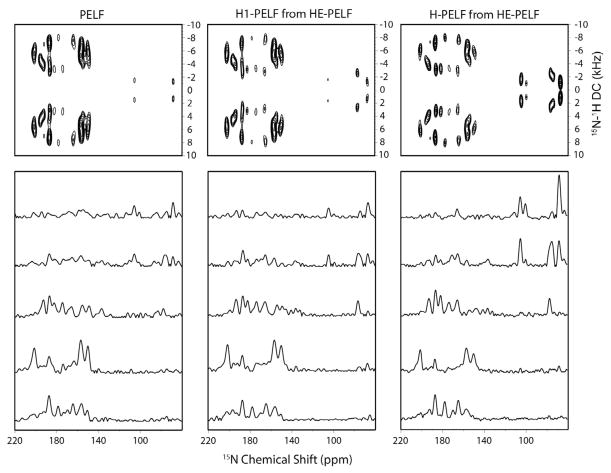
To demonstrate the SE obtained using the HE-PELF as compared to the PELF experiment, we performed the experiments on a single crystal of N-acetyl-leucine (Fig. 7) and U15N-SLN in aligned bicelles (Figs. 8 and 9). From the 1D slices, the two spectra, H1-PELF and H-PELF, obtained from HE-PELF experiment cover the entire range of the dipolar couplings in the crystal. H-PELF gives a substantial increase in sensitivity for resonances with low DC values, while the H1-PELF retains the high sensitivity for residues with high DCs. The integrated intensity of the peaks between 60 to 120 ppm and 0 to 5 kHz of H-PELF is 2.2 times (120% enhancement) that of the PELF spectrum. This feature is of important consequence for studying membrane bound and embedded proteins which have transmembrane domains (which would have high DCs), as well as flexible loops and an extra-membrane segment (which would have either scaled or lower DCs). As expected, a significant sensitivity enhancement of 50–100% is seen for SLN reconstituted in unflipped bicelles, where DCs are scaled down by a factor of ~2 due to the orientation of the bilayer normal which is perpendicular to the magnetic field and the resonances are narrower due to the fast uniaxial rotation [84] about the bilayer normal (Fig. 9). Essentially, the HE-PELF experiment allows the mapping of all of these domains in a single experiment rather than multiple experiments optimized for each domain individually.
Fig. 7.
Comparison of PELF and H-PELF spectra of an 15N-labeled NAL single crystal and the 1D slices for the 4 peaks at 16.5 T. Reproduced from Ref. [35] with permission from American Chemical Society.
Fig. 8.
Comparison of (left) H1-PELF and (right) HE-PELF spectra for U15N-SLN in unflipped bicelles at 16.5 T. Spectra were acquired with 56 transients for each of 32 t1 points (t1 evolution = 0.90 ms).
Fig. 9.
Comparison of PELF and HE-PELF spectra (H1-PELF and H-PELF) for U15N-SLN in flipped bicelles and dipolar couplings at 16.5 T. Reproduced from Ref. [35] with permission from American Chemical Society.
4. SE heteronuclear chemical shift correlation (HETCOR) experiments
4.1. Theory of SE-HETCOR
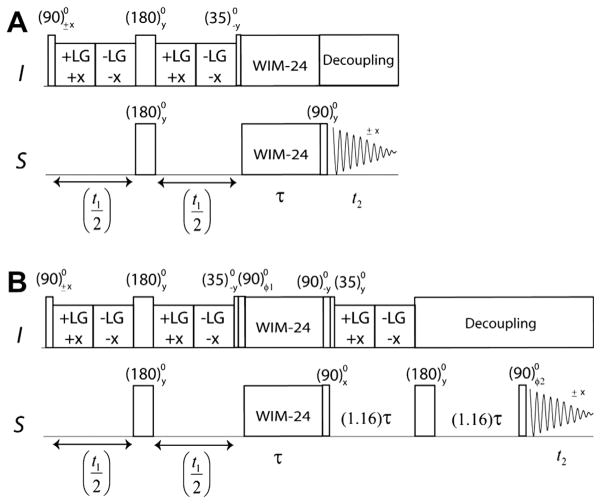
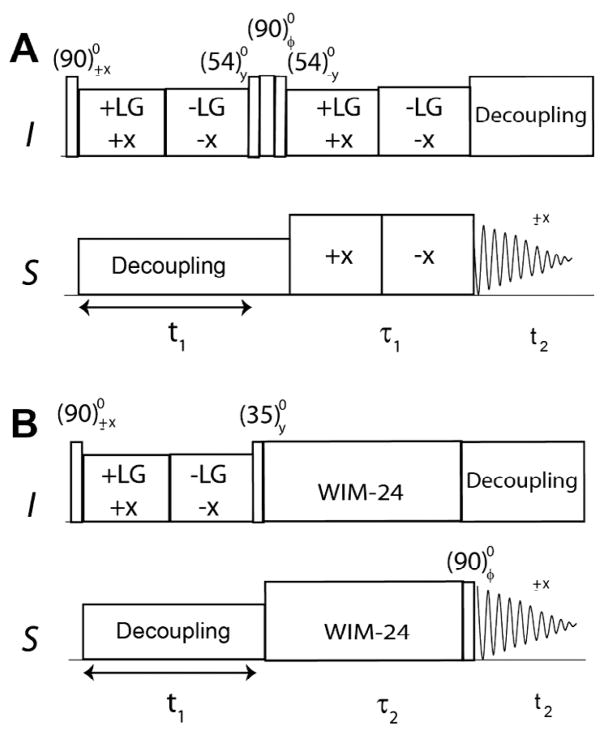
The HETCOR experiment is used to correlate the chemical shifts of the two nuclei, typically 13C–1H or 15N–1H [85]. This experiment shares a close similarity with the PELF experiment. In the PELF experiment 1H CS is refocused and 15N–1H DC is evolved during t1, whereas in the HETCOR experiment 15N–1H DC is decoupled and 1H CS is evolved during t1. The pulse sequence of HETCOR consists of three parts (Fig. 10): (a) 1H CS evolution under 1H–1H homonuclear decoupling and 15N heteronuclear decoupling; (b) polarization transfer from 1H to directly bonded 15N; and (c) detection under 15N CS evolution and 1H decoupling. This experiment, however, is rarely used for membrane proteins due to its poor sensitivity and resolution. The typical 1H linewidths obtained in the HETCOR experiments range from 0.6 to 1.2 kHz [86]. Several variants have been proposed, differing mainly in the design of the 1H chemical shift evolution period. For liquid crystalline and aligned lipid bicelles, it has been shown that the application of the BLEW-12 homonuclear decoupling sequence results in 1H linewidths narrower than those of the FSLG sequence. A recent implementation of HETCOR for membrane proteins undergoing fast uniaxial rotation demonstrated that the use of the MSHOT sequence for 1H homonuclear decoupling reduces the 1H line width up to 300 Hz [82], which is very promising and opens up further improvements with respect to conventional experiments.
Fig. 10.
(A) The HETCOR pulse sequence and (B) the corresponding sensitivity enhanced HETCOR experiment, SE-HETCOR.
In a HETCOR experiment (Fig. 10A), 1H CS coherences are encoded into cosine and sine components during t1 evolution that are transferred to 15N via Hartmann–Hahn CP schemes, such as continuous wave CP or FSLG-CP. A key feature of this experiment is the optimization of the τ1 period, which depends on the values of the DCs for the specific protein sample. The quadrature detection in the F1 acquisition dimension is obtained using the States mode [87], where cosine and sine components are detected in separate scans followed by FT.
As for the SE scheme for the PISEMA experiment, it is possible to recover both components of the CS coherences (sine and cosine) and enhance sensitivity by designing an appropriate pulse scheme. A fundamental difference between the two experiments is that for the SE-PISEMA we recovered both sine and cosine components of the dipolar coherences, whereas for the HETCOR experiment we recover the CS coherences. In fact, both cosine and sine components of 1H CS in the SE-HETCOR experiment can be simultaneous transferred to 15N using a WIM-CP sequence. Unlike the CP and FSLG-CP schemes, the heteronuclear DC Hamiltonian of the WIM-CP sequence contains an isotropic mixing term (I⃗ · S⃗) that enables the simultaneous transfer of both cosine and sine components from 1H to 15N, which are detected during t2 after a 90° pulse on 15N with phase +y and −y. The evolution of the density matrix for the SE-HETCOR pulse sequence (Fig. 10B) is given by:
| (15) |
where ωIS = 2πDIS, , sFSLG = 0.57, sWIM24 = 0.66.
In Eq. (15), DIS is the DC between the I and S spins, and sFSLG and sWIM24 are the scaling factors during the t1 and τ2 periods, respectively. The inversion of the phase for the 90° pulse on 15N inverts the sign for the sine component only, whereas the sign of the cosine component remains unaltered. Addition and subtraction of these two interleaved scans separates the cosine and sine components that are subsequently Fourier transformed to obtain the quadrature detection in the F1 dimension. The density matrix becomes:
| (16) |
Although the signal is enhanced by a factor of 2 (Eq. (16)), the processing increases the RMS noise by . Hence, the theoretical sensitivity gain is ( ) or 40%.
4.2. Application of SE-HETCOR to single crystals and membrane proteins
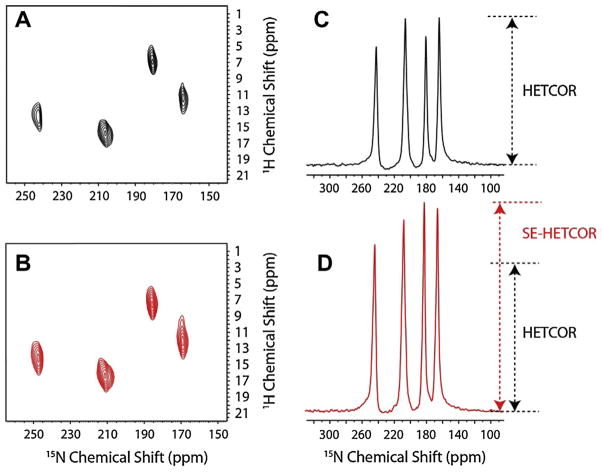
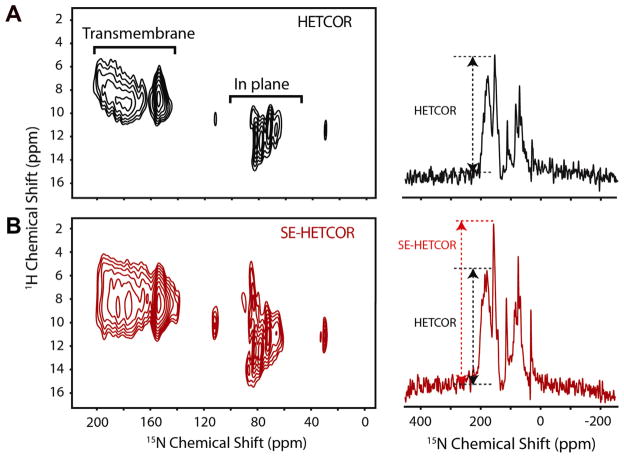
Two-dimensional HETCOR experiments, performed on a single crystal of NAL and U15N-SLN in aligned bicelles, are shown in Figs. 11 and 12 respectively [33]. Although the theoretical SE of SE-HETCOR is 40%, the net SE also depends on the efficiency of WIM24 polarization transfer with respect to FSLG-CP. For single crystal SE, factors of 1.3 (30%) to 1.6 (60%) are observed, whereas for SLN an average SE of 60% was observed. Although SE-HETCOR improves the sensitivity compared to the classical HETCOR, the resolution in 2D spectra remains a serious concern. One of the main reasons for the poor resolution is that the inherent spread of anisotropic chemical shifts for amide protons in the transmembrane segments is low. Nonetheless, the SE-HETCOR experiment makes it possible to develop 3D experiments that enable one to resolve the chemical shifts in three dimensions, while simultaneously taking advantage of not only the higher resolution in the R-SLF spectra, but also improvements in sensitivity in both R-SLF and HETCOR spectra.
Fig. 11.
Comparison between (A) conventional 1H–15N-HETCOR and (B) 1H–15N-SE-HETCOR spectra for a single crystal of 15N-NAL with corresponding 1D slices in (C) and (D) showing the improvement in sensitivity. Reproduced from Ref. [33] with permission from American Chemical Society.
Fig. 12.
(A) The 1H–15N-HETCOR and (B) the 1H–15N-SE-HETCOR spectra of U–15N-SLN in aligned TBBPC bicelles at 16.5 T with the corresponding 1D-slices showing the improvement in sensitivity for the SE-HETCOR experiment. Reproduced from Ref. [33] with permission from American Chemical Society.
5. SE three-dimensional experiments
5.1. Theory
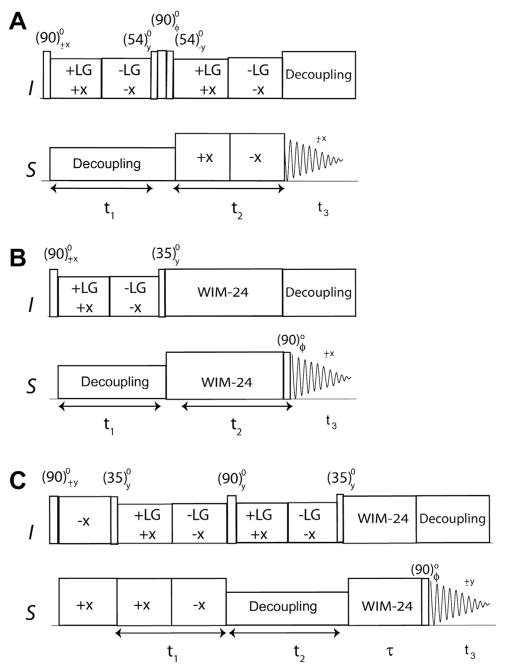
The 3D versions of the HETCOR experiments (i.e., HETCOR-SLF and SE-HETCOR-SLF) (Fig. 10) are obtained by incrementing (t2) τ1 or τ2, followed by the 15N CS acquisition period (t3) from the experiments reported in Fig. 13. In the case of the 3D experiments, the density matrices for an I–S spin system are:
| (17) |
Fig. 13.
3D experiments to correlate 1H chemical shifts, 15N–1H dipolar couplings, and 15N chemical shifts. (A) HETCOR-SLF, (B) SE-HETCOR-SLF, and (C) SE-PISEMAIHETCOR pulse sequences.
In Eq. (17) SFSLG and SFSLG-CP are the theoretical scaling factors that are 0.57 and 0.82, respectively. The t1 dimension for the HETCOR-SLF and SE-HETCOR-SLF experiments are processed using States [87] and Rance–Kay [53,54] modes, respectively. During dipolar evolution (t2), the HETCOR-SLF experiment requires a SEMA (spin exchange at magic angle) spin-lock sequence, while the SE-HETCOR-SLF experiments make use of a WIM24 spin-lock on 1H and 15N. Since the SEMA spin-lock sequence is less efficient for large 1H offsets, it is likely to cause scaled DC values. The WIM24, on the other hand, is more efficient for large 1H offsets and gives more accurate DC values. The dipolar linewidths and the scaling factors for SEMA and WIM24 play a role in the sensitivity gain; in the absence of these effects Eq. (17) shows that the theoretical SE for SE-HETCOR-SLF is 40%.
Both HETCOR-SLF and SE-HETCOR-SLF experiments give a zero frequency peak in the dipolar dimension, which results from the first term of Eq. (17). In the 2D PISEMA and SE-PISEMA experiments, the zero frequency term in the dipolar dimension is eliminated by applying a polarization inversion (PI) scheme on the 1H channel, which creates only a ZQ term evolving under heteronuclear DC. The PI not only removes the zero frequency term, but also doubles the sensitivity of DC peaks.
For the 3D HETCOR-SLF and SE-HETCOR-SLF, the PI sequence cannot be applied prior to the t2 dipolar evolution period, since the polarization at this point is only on the I spin (1H). In this case, only the ZQ term would oscillate with the DC, while DQ would only contribute to the zero-frequency peak in the dipolar dimension (t2). To avoid this, we designed a new 3D experiment (SE-PISE-MAI-HETCOR, Fig. 13C) switching the dipolar (t2) and chemical shift (t1) dimensions in the original HETCOR-SLF experiment (Fig. 13A). In this new scheme, we apply the PI prior to the DC evolution (t1) and the SE scheme right after the chemical shift evolution, t2 (Fig. 13C). The PI increases the sensitivity by a factor of 2 and SE up to , resulting in a theoretical enhancement of up to or 180%. Importantly, in the HETCOR-SLF and SE-HETCOR-SLF experiments, the S-spin dipolar evolution is detected. In contrast, during the t1 evolution of SE-PISEMAI-HETCOR, the I-spin dipolar coherence is detected and transferred to the S spin for CS evolution and detection. After the CP period, PI is obtained by a 35° pulse on 1H that creates a ZQ state ( ), which evolves under 1H–15N DC, 1H CS, and 15N CS in the t1, t2, and t3 dimensions, respectively:
| (18) |
Using the Rance–Kay [53,54] mode of processing in the t2 dimension, the resulting density matrix is given by:
| (19) |
where the factor 2 indicates the simultaneous acquisition of two components, Sx and Sy, and the factor in the denominator indicates the RMS noise increase resulting from data processing. Compared to the density matrix of HETCOR-SLF (Eq. (17)), the sensitivity gain in SE-PISEMAI-HETCOR is or 180%.
5.2. Application to 3D spectroscopy to membrane proteins
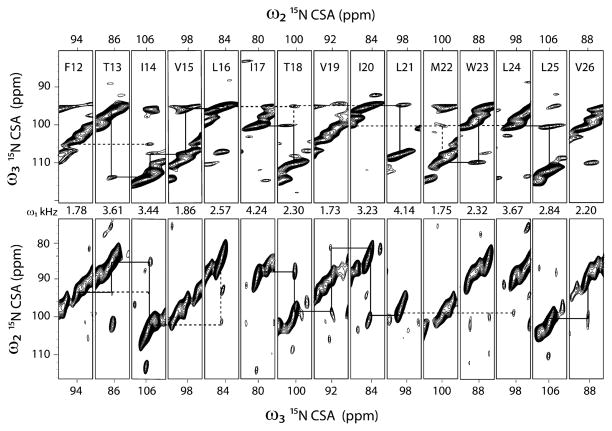
Due to the poor sensitivity of the oriented membrane protein samples, the application of 3D experiments is rather sparse. Currently, only four papers report on the utilization of 3D spectroscopy for structural studies of oriented membrane proteins. Nevertheless, the congestion of the amide resonances in 2D experiments necessitates the use of 3D experiments to separate and assign the amide resonances in multispan membrane proteins. The SE methods optimized in our laboratory make it possible to carry out 3D experiments on membrane protein samples. For instance, in our 3D SE version of SLF-HETCOR experiment (15N, 1H and 15N–1H DC correlation) we were able to achieve 80–180% fold increase in sensitivity, corresponding to a factor of 3–7 in time saving. We applied the SE-PISEMAI-HETCOR experiment to SLN in oriented bicelles and obtained a completely resolved spectrum, detecting all of the transmembrane resonances [88]. The total experimental time was ~3.3 days, which is comparable to the routine experiments carried out for proteins using solution and MAS-ssNMR experiments. A strip plot displaying individual resonances is reported in Fig. 14. In addition to giving accurate assignments for 15N-chemical shift and NH DCs, we were able to extract 1H-anisotropic chemical shifts that were implemented in the structure calculations of SLN in lipid bilayers.
Fig. 14.
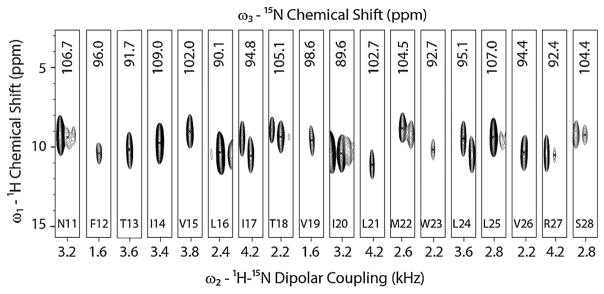
Strip plots from a single 3D-SE-PISEMAI-HETCOR experiment on U15N-SLN in unflipped bicelles at 16.5 T. We utilized 80 transients for each of the 20 t1 and 15 t2 dimensions with a total experimental time of ~80 h. Reproduced from Ref. [88] with permission from Springer.
6. Constant time SLF experiments (CT-SLF)
6.1. Theory of CT-SLF
In solution NMR, a common method to increase the resolution of indirect dimensions involves the use of constant-time (CT) evolution. A CT experiment is based on the refocusing of chemical shift or J-coupling Hamiltonians by applying a single π pulse or a pair of π pulses, respectively. These π pulses change the sign of the Hamiltonian, thereby refocusing the spin evolution for an equal amount of time before and after the π pulse(s). The phase of these π pulses is set to either x or y, as the effective field of the Hamiltonian is along the z direction. In ssNMR, the Hamiltonians are modulated by spin-lock pulses to suppress the homonuclear DCs. The effective field direction of the resultant Hamiltonian may not always be along the z-direction. For instance, the initial ZQ density matrix in the PISEMA experiment evolves under ZQ DC Hamiltonian with a 1H effective field in the zx-plane, and makes a magic angle with z-axis. On the other hand, the 15N effective field is aligned along the x-direction. To improve the linewidths, we designed a CT-PISEMA experiment (Fig. 15A) by replacing the t1 evolution period of the PI-SEMA sequence with a CT evolution of DC Hamiltonian. The initial ZQ density matrix ( ) is obtained by a CP sequence followed by a 35° pulse on the 1H channel. The ZQ term is then evolved under DC Hamiltonian for a CT period of duration T. The CT dipolar evolution is obtained by refocusing the DC Hamiltonian in a doubly tilted rotating (DTR) frame by applying π-pulses simultaneously on 1H and 15N with phases y and z, respectively. The π-pulse on 15N with phase z is obtained by a composite pulse, i.e., . The sign inversion of DC Hamiltonian in a CT-PI-SEMA experiment can be written as:
| (20) |
Fig. 15.
Pulse sequences for (A) CT-PISEMA and (B) SECT-PISEMA. T is the total time of dipolar coupling evolution.
For t1 = 0, the two π-pulses are applied in the middle of the total evolution time (T), thereby refocusing the DC evolution. In the second t1 increment, the π-pulses are moved to the left by one FSLG period, resulting in DC evolution for two FSLG periods. Likewise, for the nth t1 increment the π-pulses are moved to the left by (n − 1) FSLG periods, giving the DC evolution for 2 × (n − 1) FSLG periods. The t1 dipolar evolution is followed by 15N CS evolution during the acquisition period (t2). The density matrix during the CT-PISEMA experiment can be written as:
| (21) |
where and t1 = (n − 1) × duration of one FSLG cycle.
As for the solution NMR experiments, the CT evolution of the CT-PISEMA sequence avoids homogeneous line broadening, resulting in dipolar linewidths sharper than the corresponding PISEMA experiment. Although dipolar resolution is improved, the relatively long CT period (T ~ 1 ms) reduces the sensitivity of the CT-PISEMA experiment with respect to the classical PISEMA pulse sequence. However, it is possible to recover part of the signal by incorporating the SE element prior to acquisition (SECT-PISEMA). The spin operator formalism of the SE element in SECT-PISEMA is similar to that in SE-PISEMA, as shown in Section 1.
6.2. Application of CT experiments to liquid crystal and membrane proteins
The CT-PISEMA and SECT-PISEMA were performed on a natural abundance 13C liquid crystalline sample of 4-pentyl-4′-cyanobiphenyl (5CB) [36]. This system has the advantage of being highly sensitive, as well as having comparatively slow dipolar relaxation. A substantial improvement in dipolar linewidths of about 30–60% was obtained by the application of CT-evolution, as shown in Figs. 16 and 17.
Fig. 16.
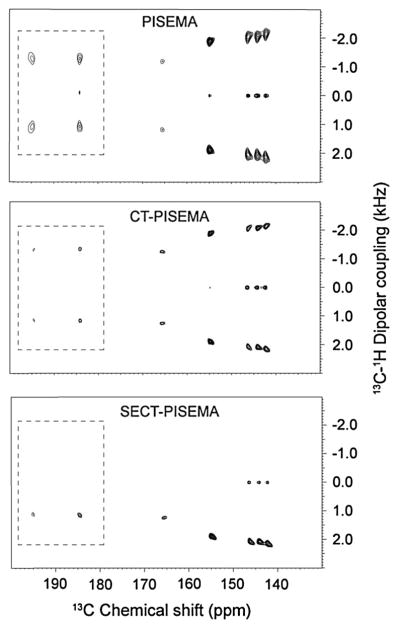
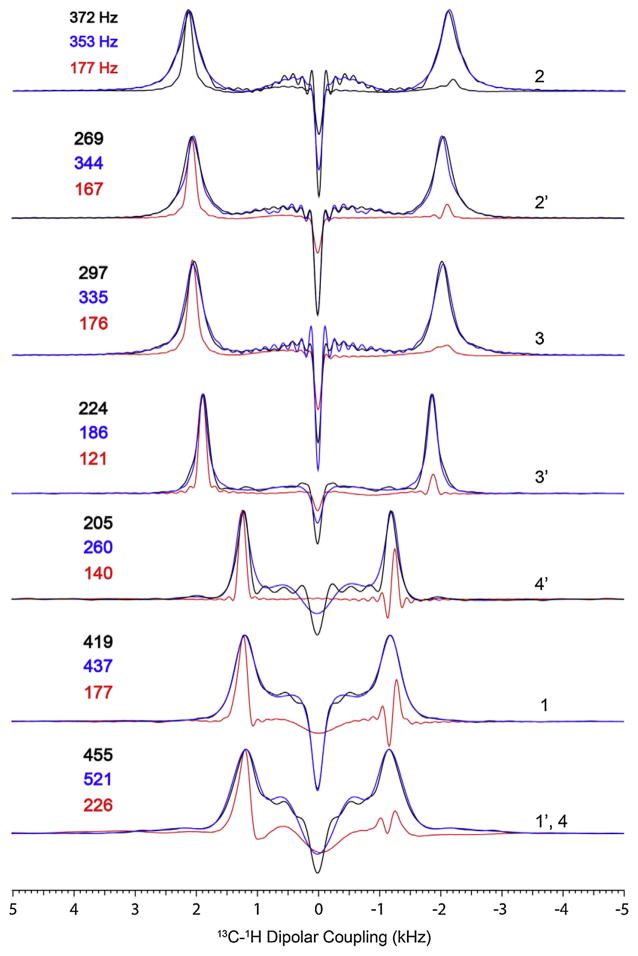
Comparison of PISEMA, CT-PISEMA and SECT-PISEMA spectra of natural abundance 13C-5CB liquid crystal at 16.5 T. Reproduced from Ref. [36] with permission from Elsevier.
Fig. 17.
Comparison of dipolar line widths (13C–1H) of 5CB liquid crystal at 16.5 T. Dipolar cross-sections of the PISEMA spectra obtained from 64 t1 and 21 t1 increments are shown in black and green respectively. The cross sections of SECT-PISEMA are shown in red. All the spectra are obtained by forward linear prediction of dipolar evolution (t1 signal) up to 128 points. Adapted from Ref. [36] with permission from Elsevier.
For optimal performance of the CT experiments, the membrane protein samples need to have enough sensitivity to compensate the decrease in SNR and have a relatively long relaxation in the dipolar dimension with respect to total evolution time. While the latter result is prohibitive with mechanically aligned sample preparations, which suffer from line broadening due to mosaic spread (static disorder), it can be easily achieved with membrane protein preparations in bicelles. Under these experimental conditions, the SECTPISEMA experiments carried out on the SLN sample reconstituted in bicelles result in a reduction of the dipolar linewidths up to 10% (Fig. 18). It can be anticipated that this scheme will offer a substantial increase in resolution for 3D double and triple resonance experiments.
Fig. 18.
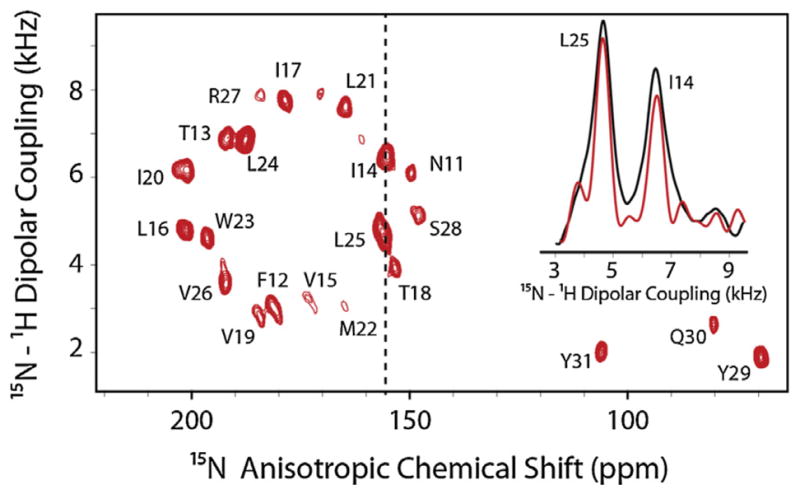
SE-CT-PISEMA spectrum of U15N-SLN in bicelles at 16.5 T. The inset shows a comparison of dipolar linewidths of two resonances at 155 ppm in SE-CT-PISEMA (red) compared to SE-PISEMA (black). (For interpretation of the references to color in this figure legend, the reader is referred to the web version of this article.)
7. Sequential assignments using two and three dimensional experiments
7.1. Background
Generally, O-ssNMR spectra of membrane proteins are assigned using extensive synthetic or amino acid specific labeling schemes [6,7]. Iterative algorithms that make use of the regular patterns of the dipolar couplings or chemical shift anisotropy originating from helices or β-strands (i.e., PISA wheels) are frequently used to assist in the spectral assignments [64,89,90]. Since sample preparations for O-ssNMR are quite laborious and the number of selective samples that can be used is dependent on the complexity of the protein under investigation, approaches involving these selective labeling schemes become quite cumbersome and time consuming. Moreover, the use of iterative algorithms to fit PISA-wheel patterns is also prone to misassignments [91]. For a robust procedure, we turn to the classical 2D and 3D correlation experiments that have been used to assign solution and more recently MAS NMR spectra.
O-ssNMR variants of classical 2D-correlation experiments, i.e., 15N–15N correlation and PISEMA with ‘mixing’ sequences implemented between the two evolved dimensions, are the simplest experiments that can establish connectivity between neighboring spin-systems [92]. These experiments are analogous to homonuclear experiments such as 2D-NOESY for solution NMR spectroscopy or 2D-DARR [93] experiments for MAS-ssNMR and have also been used for liquid crystal in static and off-MAS NMR [94].
7.2. Choice of mixing sequence
There are three different mixing schemes that can be used to establish sequential correlations: proton driven spin diffusion (PDSD) [95], cross-relaxation driven spin diffusion (CRDSD) [96] and mis-matched Hartmann–Hahn (MMHH) [97]. Nevzorov and co-workers have demonstrated the application of the MMHH pulse sequence on Pf1-bacteriophage coat proteins aligned in the phage as well as bicelles [98,99]. Ramamoorthy and co-workers have also demonstrated the efficacy of CRDSD on model aligned systems [100]. In order to choose the most effective sequence for obtaining sequential correlations, we tested these sequences on two standard samples – single crystals of 15N labeled N-acetyl-leucine (NAL) and N-acetyl valine-leucine (NAVL), whose structures are shown in Fig. 19 [56]. The minimum 15N–15N distance in the former is ~6.5 Å, while in the latter it is ~3.3 Å. These crystals constitute ideal systems to test the efficiency of these pulse sequences in probing long- (intermolecular) and short- (intramolecular) range magnetization transfers. As shown in Fig. 18A, CRDSD and MMHH are both efficient in transferring magnetization over long distances at very short mixing times of 5–10 ms. Both pulse sequences give rise to cross-peaks between all the magnetically non-equivalent 15N-nuclei in the NAL single crystal. The PDSD sequence, on the other hand, does not show any transfer of magnetization between nuclei separated by 6.5 Å, even at long mixing times (i.e., 3 s). For the NAVL single crystal, however, the PDSD scheme is the most efficient for transferring the magnetization between 15N-nuclei separated by 3.3 Å (Fig 18B). If compared to the other schemes, the PDSD at long mixing times (up to 3 s), results in 4–5 times higher intensity for the cross-peaks per unit time. The latter is due to the long T1 relaxation time of 15N-nuclei, favoring a better performance of the PDSD scheme for nuclei separated by less than 3.5 Å. In contrast, the efficiency of the CRDSD and MMHH schemes depends on the T1ρ relaxation mechanism, which in solids is relatively short.
For the PDSD scheme, the explicit dependence of the spin diffusion probability (Ω) on the dipolar coupling (ωij) between two nuclei i and j is given by the Fermi Golden Rule (Eq. (22)) [95,101].
| (22) |
where Fij(0) is a the probability of single-quantum spin transitions of i and j occurring at the same frequency [101] and ‘t’ is the time of spin diffusion. This confers an advantage over CRDSD and MMHH schemes as magnetization is selectively transferred only between nuclei separated by 4 Å or less, reducing the ambiguity of the obtained assignments. Hence, we chose to apply PDSD based pulse sequences in order to assign the membrane protein SLN.
7.3. Sequential assignment of sarcolipin and phospholamban in oriented bicelles
SLN shows remarkably resolved 2D spectra and was an ideal candidate for assignment using uniformly labeled samples. Using a mixing time of 3 s, the PDSD schemes revealed almost all of the sequential correlations (Fig. 20) [55]. Interestingly, we found correlations between the mobile C-terminal residues of SLN and the transmembrane residue S28, which made it possibly to obtain a seed assignment on the transmembrane segment. Although these 2D spectra are resolved, we were not able to get unambiguous assignments for all of the resonances due to spectral overlap for neighboring resonances whose 15N chemical shifts are similar. A complete unambiguous sequential assignment required a 3D-SE-PISEMA- PDSD-15N experiment, a combination of the two 2D sequences, and allowed us to unambiguously assign cross-peaks to resonances. In our pulse sequence, the PDSD scheme was incorporated just before acquisition, enabling the implementation of the SE scheme in the initial part of the pulse sequence. Since the efficiency of the PDSD mixing scheme depends on the DC, cross-peaks between 15N pairs with small or zero DCs resulting from inter-nuclear vectors at an angle of 54.7° to B0 (3cos2θ − 1 ~ 0 when θ ~ 54.7°) were not observed. In the case of SLN, a complete sequential assignment was made possible using ~90% of the expected cross peaks (Fig. 21).
Fig. 20.
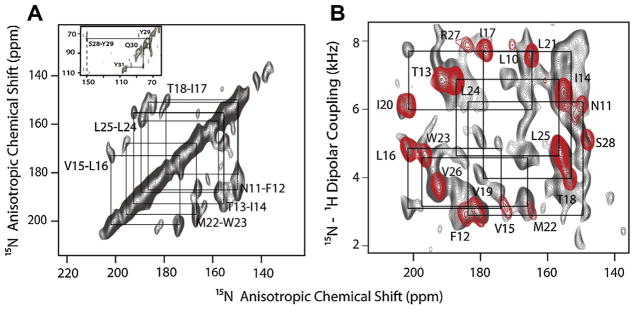
(A) 15N–15N correlation with PDSD and (B) PISEMA-PDSD (gray) overlaid with a SECT-PISEMA spectrum (red) applied to U15N-SLN oriented in flipped bicelles at 16.5 T. PDSD time of 3 sec was used in both the experiments. Reproduced from Ref. [55] with permission from Springer. (For interpretation of the references to color in this figure legend, the reader is referred to the web version of this article.)
Fig. 21.
Strip plots from the 3D-SE-PISEMA-PDSD-15N experiment on U15N-SLN in unflipped bicelles at 16.5 T. Dotted lines indicate possible (i, i + 2) or (i, i + 3) correlations. Most of the correlations are (i, i + 1) correlations. Reproduced from Ref. [55] with permission from Springer.
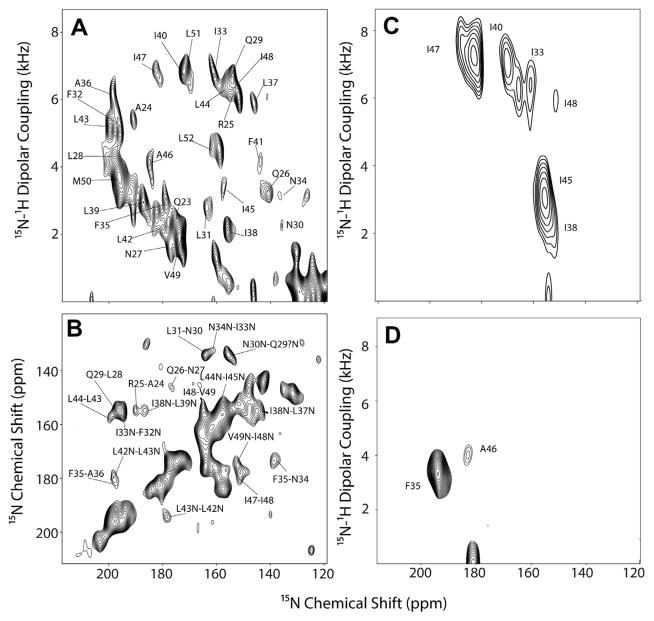
The acquisition of a 3D spectrum in an oriented sample requires high sensitivity, which may not be possible to achieve in every system under investigation – mainly due to restrictions on sample preparation. An alternative is to identify seed residues to start the assignment using selectively labeled samples and then complete the assignment using correlations between all the peaks. We show here the example of phospholamban [7,8], a single TM peptide homologous to SLN that was assigned using a 2-dimensional spin diffusion experiment on a uniformly labeled sample along with two selectively labeled samples that provided an initial seed assignment. Fig. 22 shows the SE-PISEMA spectra of three samples (i) 15N-Ile PLN, 15N-(F42, A46) PLN and U15N-PLN, and the 15N–15N spin diffusion experiment with a 3 s mixing time, which were used to assign the entire transmembrane segment of PLN (Gustavsson et al. unpublished data).
Fig. 22.
(A) SE-PISEMA spectrum of U–15N labeled PLN (B) 15N–15N PDSD for U15N PLN (C) SE-PISEMA 15N-Ile-PLN and (D) SE-PISEMA spectrum of 15N-F42, 15N-A46 PLN. All spectra are for PLN in DMPC/POPC/CHAPSO bicelles flipped by the addition of 3 mM Yb3+ at 25 °C in a magnetic field of 16.5T (Gustavsson et al. unpublished data).
8. Summary and conclusions
O-ssNMR is a powerful technique for the determination of the secondary structure and orientation of membrane proteins. However, low resolution and sensitivity have plagued this technique, hampering the structure determination of large membrane proteins in lipid membranes. With the advent of bicelles and the concomitant technological advancements in probe design and performance, it is now possible to obtain more sensitive and better resolved spectra. The increase in sensitivity has spearheaded new developments in pulse sequences that offer enough sensitivity and resolution for the sequential assignments of membrane proteins in oriented samples via three-dimensional NMR spectroscopy.
Acknowledgments
This work is supported by the National Institute of Health (GM 64742 and 72701 to G.V.).
Abbreviations
- 5CB
4-pentyl-4′-cyanobiphenyl
- BLEW
Burum Linser Ernst Windowless
- CP
cross polarization
- CSA
chemical shift anisotropy
- DC
dipolar coupling
- DTRF
doubly tilted rotating frame
- FSLG
Frequency-Switched Lee-Goldberg
- HETCOR
heteronuclear correlation
- HIMSELF
Heteronuclear Isotropic Mixing Separated Local Field
- LG
Lee-Goldberg
- MAS
magic angle spinning
- MLEV
Malcolm Levitt Decoupling Sequence
- MSHOT
Magic Sandwich Higher Order Truncation
- NAL
N-acetyl-leucine
- NAVL
N-acetyl-valine-leucine
- O-ssNMR
oriented solid-state NMR
- PDSD
proton driven spin diffusion
- PELF
Proton Evolved Local Field
- PI
polarization inversion
- PISEMA
polarization inversion spin exchange at the magic angle
- PLN
phospholamban
- RMS
root mean square
- SAMPI4
Selective Averaging Magic Sandwich with Polarization Inversion
- SE
sensitivity enhancement
- SLN
Sarcolipin
- SNR
signal to noise ratio
- WIM24
Windowless Isotropic Mixing 24
References
- 1.Murray DT, Das N, Cross TA. Solid state NMR strategy for characterizing native membrane protein structures. Acc Chem Res. 2013 doi: 10.1021/ar3003442. http://dx.doi.org/10.1021/ar3003442. [DOI] [PMC free article] [PubMed]
- 2.Cross TA, Sharma M, Yi M, Zhou HX. Influence of solubilizing environments on membrane protein structures. Trends Biochem Sci. 2011;36:117–125. doi: 10.1016/j.tibs.2010.07.005. [DOI] [PMC free article] [PubMed] [Google Scholar]
- 3.Warschawski DE, Arnold AA, Beaugrand M, Gravel A, Chartrand É, Marcotte I. Choosing membrane mimetics for NMR structural studies of transmembrane proteins. Biochim Biophys Acta. 2011;1808:1957–1974. doi: 10.1016/j.bbamem.2011.03.016. [DOI] [PubMed] [Google Scholar]
- 4.Verardi R, Traaseth NJ, Masterson LR, Vostrikov VV, Veglia G. Isotope labeling for solution and solid-state NMR spectroscopy of membrane proteins. Adv Exp Med Biol. 2012;992:35–62. doi: 10.1007/978-94-007-4954-2_3. [DOI] [PMC free article] [PubMed] [Google Scholar]
- 5.Ketchem RR, Hu W, Cross TA. High-resolution conformation of gramicidin A in a lipid bilayer by solid-state NMR. Science. 1993;261:1457–1460. doi: 10.1126/science.7690158. [DOI] [PubMed] [Google Scholar]
- 6.Sharma M, Yi M, Dong H, Qin H, Peterson E, Busath DD, et al. Insight into the mechanism of the influenza A proton channel from a structure in a lipid bilayer. Science. 2010;330:509–512. doi: 10.1126/science.1191750. [DOI] [PMC free article] [PubMed] [Google Scholar]
- 7.Traaseth NJ, Shi L, Verardi R, Mullen DG, Barany G, Veglia G. Structure and topology of monomeric phospholamban in lipid membranes determined by a hybrid solution and solid-state NMR approach. Proc Natl Acad Sci USA. 2009;106:10165–10170. doi: 10.1073/pnas.0904290106. [DOI] [PMC free article] [PubMed] [Google Scholar]
- 8.Verardi R, Shi L, Traaseth NJ, Walsh N, Veglia G. Structural topology of phospholamban pentamer in lipid bilayers by a hybrid solution and solid-state NMR method. Proc Natl Acad Sci USA. 2011;108:9101–9106. doi: 10.1073/pnas.1016535108. [DOI] [PMC free article] [PubMed] [Google Scholar]
- 9.Valentine KG, Liu SF, Marassi FM, Veglia G, Opella SJ, Ding FX, et al. Structure and topology of a peptide segment of the 6th transmembrane domain of the Saccharomyces cerevisae alpha-factor receptor in phospholipid bilayers. Biopolymers. 2001;59:243–256. doi: 10.1002/1097-0282(20011005)59:4<243::AID-BIP1021>3.0.CO;2-H. [DOI] [PMC free article] [PubMed] [Google Scholar]
- 10.Buck-Koehntop BA, Mascioni A, Buffy JJ, Veglia G. Structure, dynamics, and membrane topology of stannin: a mediator of neuronal cell apoptosis induced by trimethyltin chloride. J Mol Biol. 2005;354:652–665. doi: 10.1016/j.jmb.2005.09.038. [DOI] [PubMed] [Google Scholar]
- 11.Buffy JJ, Traaseth NJ, Mascioni A, Gor’kov PL, Chekmenev EY, Brey WW, et al. Two-dimensional solid-state NMR reveals two topologies of sarcolipin in oriented lipid bilayers. Biochemistry. 2006;45:10939–10946. doi: 10.1021/bi060728d. [DOI] [PubMed] [Google Scholar]
- 12.Vostrikov VV, Grant CV, Opella SJ, Koeppe RE. On the combined analysis of 2H and 15N/1H solid-state NMR data for determination of transmembrane peptide orientation and dynamics. Biophys J. 2011;101:2939–2947. doi: 10.1016/j.bpj.2011.11.008. [DOI] [PMC free article] [PubMed] [Google Scholar]
- 13.Vostrikov VV, Daily AE, Greathouse DV, Koeppe RE. Charged or aromatic anchor residue dependence of transmembrane peptide tilt. J Biol Chem. 2010;285:31723–31730. doi: 10.1074/jbc.M110.152470. [DOI] [PMC free article] [PubMed] [Google Scholar]
- 14.Vostrikov VV, Hall BA, Greathouse DV, Koeppe RE, 2nd, Sansom MS. Changes in transmembrane helix alignment by arginine residues revealed by solid-state NMR experiments and coarse-grained MD simulations. J Am Chem Soc. 2010;132:5803–5811. doi: 10.1021/ja100598e. [DOI] [PMC free article] [PubMed] [Google Scholar]
- 15.Aisenbrey C, Michalek M, Salnikov ES, Bechinger B. Solid-state NMR approaches to study protein structure and protein–lipid interactions. Methods Mol Biol. 2013;974:357–387. doi: 10.1007/978-1-62703-275-9_16. [DOI] [PubMed] [Google Scholar]
- 16.Bechinger B. Membrane insertion and orientation of polyalanine peptides: a 15N solid-state NMR spectroscopy investigation. Biophys J. 2001;81:2251–2256. doi: 10.1016/S0006-3495(01)75872-9. [DOI] [PMC free article] [PubMed] [Google Scholar]
- 17.Li C, Gao P, Qin H, Chase R, Gor’kov PL, Brey WW, et al. Uniformly aligned full-length membrane proteins in liquid crystalline bilayers for structural characterization. J Am Chem Soc. 2007;129:5304–5305. doi: 10.1021/ja068402f. [DOI] [PMC free article] [PubMed] [Google Scholar]
- 18.Marassi FM, Ramamoorthy A, Opella SJ. Complete resolution of the solid-state NMR spectrum of a uniformly 15N-labeled membrane protein in phospholipid bilayers. Proc Natl Acad Sci USA. 1997;94:8551–8556. doi: 10.1073/pnas.94.16.8551. [DOI] [PMC free article] [PubMed] [Google Scholar]
- 19.Opella SJ, Ma C, Marassi FM. Nuclear magnetic resonance of membrane-associated peptides and proteins. Methods Enzymol. 2001;339:285–313. doi: 10.1016/s0076-6879(01)39319-9. [DOI] [PMC free article] [PubMed] [Google Scholar]
- 20.Naito A. Structure elucidation of membrane-associated peptides and proteins in oriented bilayers by solid-state NMR spectroscopy. Solid State Nucl Magn Reson. 2009;36:67–76. doi: 10.1016/j.ssnmr.2009.06.008. [DOI] [PubMed] [Google Scholar]
- 21.Opella SJ, Marassi FM. Structure determination of membrane proteins by NMR spectroscopy. Chem Rev. 2004;104:3587–3606. doi: 10.1021/cr0304121. [DOI] [PMC free article] [PubMed] [Google Scholar]
- 22.Ozdirekcan S, Etchebest C, Killian JA, Fuchs PFJ. On the orientation of a designed transmembrane peptide: toward the right tilt angle? J Am Chem Soc. 2007;129:15174–15181. doi: 10.1021/ja073784q. [DOI] [PubMed] [Google Scholar]
- 23.Marcotte I, Auger M. Bicelles as model membranes for solid- and solution-state NMR studies of membrane peptides and proteins. Concepts Magn Reson Part A. 2005;24A:17–37. [Google Scholar]
- 24.Dürr UHN, Gildenberg M, Ramamoorthy A. The magic of bicelles lights up membrane protein structure. Chem Rev. 2012;112:6054–6074. doi: 10.1021/cr300061w. [DOI] [PMC free article] [PubMed] [Google Scholar]
- 25.De Angelis AA, Opella SJ. Bicelle samples for solid-state NMR of membrane proteins. Nat Protocols. 2007;2:2332–2338. doi: 10.1038/nprot.2007.329. [DOI] [PubMed] [Google Scholar]
- 26.Nevzorov AA, Opella SJ. Selective averaging for high-resolution solid-state NMR spectroscopy of aligned samples. J Magn Reson. 2007;185:59–70. doi: 10.1016/j.jmr.2006.09.006. [DOI] [PubMed] [Google Scholar]
- 27.Aisenbrey C, Bechinger B. Investigations of polypeptide rotational diffusion in aligned membranes by 2H and 15N solid-state NMR spectroscopy. J Am Chem Soc. 2004;126:16676–16683. doi: 10.1021/ja0468675. [DOI] [PubMed] [Google Scholar]
- 28.Park SH, Casagrande F, Das BB, Albrecht L, Chu M, Opella SJ. Local and global dynamics of the G protein-coupled receptor CXCR1. Biochemistry. 2011;50:2371–2380. doi: 10.1021/bi101568j. [DOI] [PMC free article] [PubMed] [Google Scholar]
- 29.Park SH, Opella SJ. Triton x-100 as the “short-chain lipid” improves the magnetic alignment and stability of membrane proteins in phosphatidylcholine bilayers for oriented-sample solid-state NMR spectroscopy. J Am Chem Soc. 2010;132:12552–12553. doi: 10.1021/ja1055565. [DOI] [PMC free article] [PubMed] [Google Scholar]
- 30.Aisenbrey C, Bechinger B. Tilt and rotational pitch angle of membrane-inserted polypeptides from combined 15N and 2H solid-state NMR spectroscopy. Biochemistry. 2004;43:10502–10512. doi: 10.1021/bi049409h. [DOI] [PubMed] [Google Scholar]
- 31.Mesleh MF, Veglia G, DeSilva TM, Marassi FM, Opella SJ. Dipolar waves as NMR maps of protein structure. J Am Chem Soc. 2002;124:4206–4207. doi: 10.1021/ja0178665. [DOI] [PMC free article] [PubMed] [Google Scholar]
- 32.Gopinath T, Veglia G. Sensitivity enhancement in static solid-state NMR experiments via single- and multiple-quantum dipolar coherences. J Am Chem Soc. 2009;131:5754–5756. doi: 10.1021/ja900096d. [DOI] [PMC free article] [PubMed] [Google Scholar]
- 33.Gopinath T, Traaseth NJ, Mote K, Veglia G. Sensitivity enhanced heteronuclear correlation spectroscopy in multidimensional solid-state NMR of oriented systems via chemical shift coherences. J Am Chem Soc. 2010;132:5357–5363. doi: 10.1021/ja905991s. [DOI] [PMC free article] [PubMed] [Google Scholar]
- 34.Gopinath T, Verardi R, Traaseth NJ, Veglia G. Sensitivity enhancement of separated local field experiments: application to membrane proteins. J Phys Chem B. 2010;114:5089–5095. doi: 10.1021/jp909778a. [DOI] [PMC free article] [PubMed] [Google Scholar]
- 35.Gopinath T, Mote KR, Veglia G. Proton evolved local field solid-state nuclear magnetic resonance using Hadamard encoding: theory and application to membrane proteins. J Chem Phys. 2011;135:074503. doi: 10.1063/1.3622604. [DOI] [PMC free article] [PubMed] [Google Scholar]
- 36.Gopinath T, Veglia G. Improved resolution in dipolar NMR spectra using constant time evolution PISEMA experiment. Chem Phys Lett. 2010;494:104–110. doi: 10.1016/j.cplett.2010.05.078. [DOI] [PMC free article] [PubMed] [Google Scholar]
- 37.Müller L, Kumar A, Baumann T, Ernst R. Transient oscillations in NMR cross-polarization experiments in solids. Phys Rev Lett. 1974;32:1402–1406. [Google Scholar]
- 38.Sinha N, Ramanathan K. Use of polarization inversion for resolution of small dipolar couplings in SLF-2D NMR experiments – an application to liquid crystals. Chem Phys Lett. 2000;332:125–130. [Google Scholar]
- 39.Kim H, Cross TA, Fu R. Cross-polarization schemes for peptide samples oriented in hydrated phospholipid bilayers. J Magn Reson. 2004;168:147– 152. doi: 10.1016/j.jmr.2004.02.010. [DOI] [PubMed] [Google Scholar]
- 40.Waugh JS. Uncoupling of local field spectra in nuclear magnetic resonance: determination of atomic positions in solids. Proc Natl Acad Sci USA. 1976;73:1394–1397. doi: 10.1073/pnas.73.5.1394. [DOI] [PMC free article] [PubMed] [Google Scholar]
- 41.Wu CH, Ramamoorthy A, Opella SJ. High-resolution heteronuclear dipolar solid-state NMR spectroscopy. J Magn Reson A. 1994;109:270–272. [Google Scholar]
- 42.Lee M, Goldburg W. Nuclear-magnetic-resonance line narrowing by a rotating rf field. Phys Rev. 1965;140:A1261–A1271. [Google Scholar]
- 43.Levitt MH, Suter D, Ernst RR. Spin dynamics and thermodynamics in solid-state NMR cross polarization. J Chem Phys. 1986;84:4243. [Google Scholar]
- 44.Marassi FM, Opella SJ. NMR structural studies of membrane proteins. Curr Opin Struct Biol. 1998;8:640–648. doi: 10.1016/s0959-440x(98)80157-7. [DOI] [PMC free article] [PubMed] [Google Scholar]
- 45.Yamamoto K, Dvinskikh SV, Ramamoorthy A. Measurement of heteronuclear dipolar couplings using a rotating frame solid-state NMR experiment. Chem Phys Lett. 2006;419:533–536. [Google Scholar]
- 46.Yamamoto K, Lee DK, Ramamoorthy A. Broadband-PISEMA solid-state NMR spectroscopy. Chem Phys Lett. 2005;407:289–293. doi: 10.1016/j.cplett.2005.04.017. [DOI] [PMC free article] [PubMed] [Google Scholar]
- 47.Jayanthi S, Ramanathan KV. 2(n)-SEMA-a robust solid state nuclear magnetic resonance experiment for measuring heteronuclear dipolar couplings in static oriented systems using effective transverse spin-lock. J Chem Phys. 2010;132:134501. doi: 10.1063/1.3336815. [DOI] [PubMed] [Google Scholar]
- 48.Lee DK, Narasimhaswamy T, Ramamoorthy A. PITANSEMA, a low-power PISEMA solid-state NMR experiment. Chem Phys Lett. 2004;399:359–362. [Google Scholar]
- 49.Dvinskikh SV, Sandstrom D. Frequency offset refocused PISEMA-type sequences. J Magn Reson. 2005;175:163–169. doi: 10.1016/j.jmr.2005.03.016. [DOI] [PubMed] [Google Scholar]
- 50.Ramamoorthy A, Wei Y, Lee DK. Advances in Solid State NMR Studies of Materials and Polymers. Elsevier Acad. Pr; 2004. PISEMA solid state NMR spectroscopy; pp. 1–52. [Google Scholar]
- 51.Hohwy M, Nielsen NC. Elimination of high order terms in multiple pulse nuclear magnetic resonance spectroscopy: application to homonuclear decoupling in solids. J Chem Phys. 1997;106:7571. [Google Scholar]
- 52.Caravatti P, Braunschweiler L, Ernst RR. Heteronuclear correlation spectroscopy in rotating solids. Chem Phys Lett. 1983;100:305–310. [Google Scholar]
- 53.Cavanagh J, Palmer AG, Wright PE, Rance M. Sensitivity improvement in proton-detected two-dimensional heteronuclear correlation NMR spectroscopy. J Magn Reson. 1991;91:151–170. [Google Scholar]
- 54.Kay L, Keifer P, Saarinen T. Pure absorption gradient enhanced heteronuclear single quantum correlation spectroscopy with improved sensitivity. J Am Chem Soc. 1992;114:10663–10665. [Google Scholar]
- 55.Mote KR, Gopinath T, Traaseth NJ, Kitchen J, Gor’kov PL, Brey WW, et al. Multidimensional oriented solid-state NMR experiments enable the sequential assignment of uniformly 15N labeled integral membrane proteins in magnetically aligned lipid bilayers. J Biomol NMR. 2011;51:339–346. doi: 10.1007/s10858-011-9571-8. [DOI] [PubMed] [Google Scholar]
- 56.Traaseth NJ, Gopinath T, Veglia G. On the performance of spin diffusion NMR techniques in oriented solids: prospects for resonance assignments and distance measurements from separated local field experiments. J Phys Chem B. 2010;114:13872–13880. doi: 10.1021/jp105718r. [DOI] [PMC free article] [PubMed] [Google Scholar]
- 57.Prosser RS, Volkov VB, Shiyanovskaya IV. Solid-state NMR studies of magnetically aligned phospholipid membranes: taming lanthanides for membrane protein studies. Biochem Cell Biol. 1998;76:443–451. doi: 10.1139/bcb-76-2-3-443. [DOI] [PubMed] [Google Scholar]
- 58.Prosser RS, Volkov VB, Shiyanovskaya IV. Novel chelate-induced magnetic alignment of biological membranes. Biophys J. 1998;75:2163–2169. doi: 10.1016/S0006-3495(98)77659-3. [DOI] [PMC free article] [PubMed] [Google Scholar]
- 59.Veglia G, Opella SJ. Lanthanide ion binding to adventitious sites aligns membrane proteins in micelles for solution NMR spectroscopy. J Am Chem Soc. 2000;122:11733–11734. [Google Scholar]
- 60.Loudet C, Manet S, Gineste S, Oda R, Achard MF, Dufourc EJ. Biphenyl bicelle disks align perpendicular to magnetic fields on large temperature scales: a study combining synthesis, solid-state NMR, TEM, and SAXS. Biophys J. 2007;92:3949–3959. doi: 10.1529/biophysj.106.097758. [DOI] [PMC free article] [PubMed] [Google Scholar]
- 61.Park SH, Loudet C, Marassi FM, Dufourc EJ, Opella SJ. Solid-state NMR spectroscopy of a membrane protein in biphenyl phospholipid bicelles with the bilayer normal parallel to the magnetic field. J Magn Reson. 2008;193:133–138. doi: 10.1016/j.jmr.2008.04.033. [DOI] [PMC free article] [PubMed] [Google Scholar]
- 62.Page RC, Cross TA. Transmembrane helix uniformity examined by spectral mapping of torsion angles. Structure. 2008;16:787–797. doi: 10.1016/j.str.2008.02.018. [DOI] [PMC free article] [PubMed] [Google Scholar]
- 63.Kim S, Cross TA. Uniformity, ideality, and hydrogen bonds in transmembrane alpha-helices. Biophys J. 2002;83:2084–2095. doi: 10.1016/S0006-3495(02)73969-6. [DOI] [PMC free article] [PubMed] [Google Scholar]
- 64.Mascioni A, Eggimann BL, Veglia G. Determination of helical membrane protein topology using residual dipolar couplings and exhaustive search algorithm: application to phospholamban. Chem Phys Lipids. 2004;132:133–144. doi: 10.1016/j.chemphyslip.2004.09.018. [DOI] [PubMed] [Google Scholar]
- 65.Metz G, Wu XL, Smith SO. Ramped-amplitude cross-polarization in magic-angle-spinning NMR. J Magn Reson A. 1994;110:219–227. [Google Scholar]
- 66.Peersen OB, Wu XL, Kustanovich I, Smith SO. Variable-amplitude cross-polarization MAS NMR. J Magn Reson A. 1993;104:334–339. [Google Scholar]
- 67.Nakai T, Terao T. Measurements of heteronuclear dipolar powder patterns due only to directly bonded couplings. Magn Reson Chem. 1992;30:42–44. [Google Scholar]
- 68.Hong M, Schmidt-Rohr K, Nanz D. Study of phospholipid structure by H-1, C-13, P-31 dipolar couplings from two-dimensional NMR. Biophys J. 1995;69:1939–1950. doi: 10.1016/S0006-3495(95)80064-0. [DOI] [PMC free article] [PubMed] [Google Scholar]
- 69.Schmidt-Rohr K, Nanz D, Emsley L, Pines A. NMR measurement of resolved heteronuclear dipole couplings in liquid crystals and lipids. J Phys Chem. 1994;98:6668–6670. [Google Scholar]
- 70.Dvinskikh S, Durr UH, Yamamoto K, Ramamoorthy A. A high-resolution solid-state NMR approach for the structural studies of bicelles. J Am Chem Soc. 2006;128:6326–6327. doi: 10.1021/ja061153a. [DOI] [PMC free article] [PubMed] [Google Scholar]
- 71.Emsley JW, Lesot P, De Luca G, Lesage A, Merlet D, Pileio G. A comparison of proton-detected 13C local field experiments with deuterium NMR at natural abundance for studying liquid crystals. Liq Cryst. 2008;35:443–464. [Google Scholar]
- 72.Jayanthi S, Madhu PK, Kurur ND, Ramanathan KV. Heteronuclear polarization transfer in static oriented systems using a windowless multiple-pulse sequence. Chem Phys Lett. 2007;439:407–411. [Google Scholar]
- 73.Dvinskikh SV, Yamamoto K, Durr UH, Ramamoorthy A. Sensitivity and resolution enhancement in solid-state NMR spectroscopy of bicelles. J Magn Reson. 2007;184:228–235. doi: 10.1016/j.jmr.2006.10.004. [DOI] [PMC free article] [PubMed] [Google Scholar]
- 74.Soong R, Smith PE, Xu J, Yamamoto K, Im SC, Waskell L, et al. Proton-evolved local-field solid-state NMR studies of cytochrome b5 embedded in bicelles, revealing both structural and dynamical information. J Am Chem Soc. 2010;132:5779–5788. doi: 10.1021/ja910807e. [DOI] [PMC free article] [PubMed] [Google Scholar]
- 75.Waugh JS, Huber M, Haeberlen U. Approach to high resolution NMR in solids. Phys Rev Lett. 1968;20:180–183. [Google Scholar]
- 76.Haeberlen U, Waugh JS. Coherent averaging effects in magnetic resonance. Phys Rev. 1968;175:453–467. [Google Scholar]
- 77.Mansfield P. Symmetrized pulse sequences in high resolution NMR in solids. J Phys C: Solid State Phys. 1971;4:1444–1452. [Google Scholar]
- 78.Rhim WK, Elleman DD, Vaughan RW. Analysis of multiple pulse NMR in solids. J Chem Phys. 1973;59:3740–3749. [Google Scholar]
- 79.Burum DP, Rhim WK. Analysis of multiple pulse NMR in solids. J Chem Phys. 1979;71:944. [Google Scholar]
- 80.Vinogradov E, Madhu PK, Vega S. Phase modulated Lee–Goldburg magic angle spinning proton nuclear magnetic resonance experiments in the solid state: a bimodal Floquet theoretical treatment. J Chem Phys. 2001;115:8983. [Google Scholar]
- 81.Burum DP, Linder M, Ernst RR. Low-power multipulse line narrowing in solid-state. J Magn Reson. 1981;44:173–188. [Google Scholar]
- 82.Lu GJ, Park SH, Opella SJ. Improved 1H amide resonance line narrowing in oriented sample solid-state NMR of membrane proteins in phospholipid bilayers. J Magn Reson. 2012;220:54–61. doi: 10.1016/j.jmr.2012.04.008. [DOI] [PMC free article] [PubMed] [Google Scholar]
- 83.Fu R, Gordon ED, Hibbard DJ, Cotten M. High resolution heteronuclear correlation NMR spectroscopy of an antimicrobial peptide in aligned lipid bilayers: peptide–water interactions at the water-bilayer interface. J Am Chem Soc. 2009;131:10830–10831. doi: 10.1021/ja903999g. [DOI] [PMC free article] [PubMed] [Google Scholar]
- 84.Nevzorov AA. Orientational and motional narrowing of solid-state NMR lineshapes of uniaxially aligned membrane proteins. J Phys Chem B. 2011;115:15406–15414. doi: 10.1021/jp2092847. [DOI] [PubMed] [Google Scholar]
- 85.Maudsley AA, Ernst RR. Indirect detection of magnetic resonance by heteronuclear two-dimensional spectroscopy. Chem Phys Lett. 1977;50:368–372. [Google Scholar]
- 86.Lu GJ, Son WS, Opella SJ. A general assignment method for oriented sample (OS) solid-state NMR of proteins based on the correlation of resonances through heteronuclear dipolar couplings in samples aligned parallel and perpendicular to the magnetic field. J Magn Reson. 2011;209:195–206. doi: 10.1016/j.jmr.2011.01.008. [DOI] [PMC free article] [PubMed] [Google Scholar]
- 87.States DJ, Haberkorn RA, Ruben DJ. A two-dimensional nuclear overhauser experiment with pure absorption phase in 4 quadrants. J Magn Reson. 1982;48:286–292. [Google Scholar]
- 88.Mote KR, Gopinath T, Veglia G. Determination of structural topology of a membrane protein in lipid-bilayers using polarization optimized experiments (POE) for static and MAS solid state NMR spectroscopy. J Biomol NMR. 2013 doi: 10.1007/s10858-013-9766-2. http://dx.doi.org/10.1007/s10858-013-9766-2. [DOI] [PMC free article] [PubMed]
- 89.Asbury T, Quine JR, Achuthan S, Hu J, Chapman MS, Cross TA, et al. PIPATH: an optimized algorithm for generating alpha-helical structures from PISEMA data. J Magn Reson. 2006;183:87–95. doi: 10.1016/j.jmr.2006.07.020. [DOI] [PubMed] [Google Scholar]
- 90.Marassi FM, Opella SJ. Simultaneous assignment and structure determination of a membrane protein from NMR orientational restraints. Protein Sci. 2003;12:403–411. doi: 10.1110/ps.0211503. [DOI] [PMC free article] [PubMed] [Google Scholar]
- 91.Shi L, Traaseth NJ, Verardi R, Cembran A, Gao J, Veglia G. A refinement protocol to determine structure, topology, and depth of insertion of membrane proteins using hybrid solution and solid-state NMR restraints. J Biomol NMR. 2009;44:195–205. doi: 10.1007/s10858-009-9328-9. [DOI] [PMC free article] [PubMed] [Google Scholar]
- 92.Marassi FM, Gesell JJ, Valente AP, Kim Y, Oblatt-Montal M, Montal M, et al. Dilute spin-exchange assignment of solid-state NMR spectra of oriented proteins: acetylcholine M2 in bilayers. J Biomol NMR. 1999;14:141–148. doi: 10.1023/a:1008391823293. [DOI] [PMC free article] [PubMed] [Google Scholar]
- 93.Takegoshi K, Nakamura S, Terao T. Dipolar-assisted rotational resonance in magic-angle spinning NMR. Chem Phys Lett. 2001;344:631–637. doi: 10.1063/1.2364503. [DOI] [PubMed] [Google Scholar]
- 94.Caldarelli S, Hong M, Emsley L, Pines A. Measurement of carbon–proton dipolar couplings in liquid crystals by local dipolar field NMR spectroscopy. J Phys Chem. 1996;100:18696–18701. [Google Scholar]
- 95.Suter D, Ernst R. Spin diffusion in resolved solid-state NMR spectra. Phys Rev B: Condens Matter Mater Phys. 1985;32:5608–5627. doi: 10.1103/physrevb.32.5608. [DOI] [PubMed] [Google Scholar]
- 96.Xu J, Struppe J, Ramamoorthy A. Two-dimensional homonuclear chemical shift correlation established by the cross-relaxation driven spin diffusion in solids. J Chem Phys. 2008;128:52308. doi: 10.1063/1.2826323. [DOI] [PubMed] [Google Scholar]
- 97.Nevzorov AA. Mismatched Hartmann–Hahn conditions cause proton-mediated intermolecular magnetization transfer between dilute low-spin nuclei in NMR of static solids. J Am Chem Soc. 2008;130:11282–11283. doi: 10.1021/ja804326b. [DOI] [PubMed] [Google Scholar]
- 98.Knox RW, Lu GJ, Opella SJ, Nevzorov AA. A resonance assignment method for oriented-sample solid-state NMR of proteins. J Am Chem Soc. 2010;132:8255–8257. doi: 10.1021/ja102932n. [DOI] [PMC free article] [PubMed] [Google Scholar]
- 99.Tang W, Knox RW, Nevzorov AA. A spectroscopic assignment technique for membrane proteins reconstituted in magnetically aligned bicelles. J Biomol NMR. 2012;54:307–316. doi: 10.1007/s10858-012-9673-y. [DOI] [PubMed] [Google Scholar]
- 100.Khitrin AK, Xu J, Ramamoorthy A. Cross-correlations between low-gamma nuclei in solids via a common dipolar bath. J Magn Reson. 2011;212:95–101. doi: 10.1016/j.jmr.2011.06.015. [DOI] [PMC free article] [PubMed] [Google Scholar]
- 101.Bronniman CE, Szeverenyi NM, Maciel GE. 13C spin diffusion of adamantane. J Chem Phys. 1983;79:3694. [Google Scholar]


