Abstract
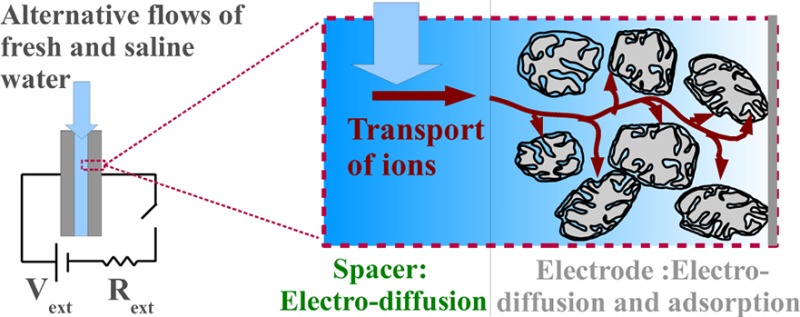
A model of the electro-diffusion of ions in porous electrodes is applied to analyze the dynamics of capacitive-mixing extraction of energy from salinity gradients with carbon porous electrodes. The complex time-evolution of the cell voltage observed in experiments is satisfactorily described. The asymmetry on the duration of the solution-change steps performed in open circuit is found to be due to the nonlinear voltage–concentration relationship of the electric double layers and to a current that redistributes the counterions along the depth of the electrode leading to nonuniform charge and salt adsorption. The validated model is an essential tool for the design and optimization of renewable energy extraction by this technique.
Introduction
The recently proposed “capacitive mixing” (CAPMIX) methods to extract energy from salinity gradients1 are attaining great interest, as they are a very promising strategy to extract efficiently renewable energy where the mixing of solutions of different salt concentration takes place naturally, such as at the mouths of rivers in the seas or oceans. The first of such techniques to be proposed was the so-called “capacitive energy extraction based on double layer expansion” (CDLE),2,3 which prompted the development of similar approaches. Among the CAPMIX techniques, the “capacitive energy extraction based on Donnan potential” (CDP) is included,4,5 which incorporates ion-selective membranes into the capacitive cell. Other methods use ion-selective nanopores to induce current between reservoirs with different salt concentration,6 or selective interactions of their electrodes with the ions in solution, called mixing entropy batteries.7 Altogether, these techniques constitute the field of so-called “blue energy”, or salinity-gradient energy.
The origin of such renewable energy release is due to the increase in entropy that occurs upon mixing two electrolyte solutions of different salt concentration, a process that spontaneously takes place at the mouths of rivers: ∼2.2 kJ are released per liter of river water that is poured into the sea.8,9 The efficiency and economic competitiveness of previous attempts to tap this renewable source of energy have been hindered by technological difficulties and elevate costs of components, all of them requiring the use of extensive areas of perm-selective membranes.10,11
CDLE is based on the dependence on salt concentration of the differential capacitance of the electric double layer (EDL), the nonuniform distribution of like-charged and oppositely charged ions (co-ions and counterions, respectively) that develops close to a charged surface in order to keep electroneutrality. Direct generation of energy with inexpensive materials (porous carbon supercapacitors12,13) is attained in CDLE by changing the solution where a pair of charged electrodes are immersed by another solution with lower salinity. If the stored charge is kept constant during the solution change, that is, in open circuit configuration, the capacitance of the EDL decreases, leading to an increase in the cell voltage and of the stored electrostatic energy. A common feature of CAPMIX technologies is the fact that the transport of ions inside the porous electrodes plays a key role in their performance. Therefore, the optimization requires not only the development of accurate EDLs models describing their charge–voltage relationship14,15 but also the consideration of the transport of ions inside the porous matrix.16,17
In this work, we apply a 1D theory of the electro-diffusion of ions in porous electrodes developed by Biesheuvel and Bazant16 to analyze the rich physical phenomena observed in experiments with a CDLE prototype cell, which includes the transport, adsorption, and desorption of ions in the porous electrodes. Although some improvements of the model (like faradaic reactions, steric effects, and multi-ions effects17−19 or 2D modeling) must be included for a quantitative analysis, the used 1D theory demonstrates to be accurate enough to identify the different time scales and transport mechanisms during the CDLE cycle, whose understanding is essential to maximize the power output. The 1D approach has been successfully applied in several previous works20−22 devoted to the description of “capacitive deionization” (CDI), a technique that, inversely to CDLE, consumes energy for removing ions from salty water by storing them in the EDLs of a pair of porous carbon electrodes.23−25 In fact, it has been recently shown that CDI and CDLE are intrinsically connected.26
Methods
The full CDLE cycle is as follows2 (see Figure 1). The CAPMIX cell is submerged in a electrolyte solution of concentration Csaline (500 mM NaCl in this work) and then externally charged until a voltage difference Vcell = Vext is established between its two electrodes. With this initial state, the electrochemical cell is operated performing a four-step cycle: (i) Change the solution from Csaline to another with lower salt content Cfresh (20 mM NaCl in this work) at constant stored charge (i.e., in open circuit). The cell voltage spontaneously increases to Vcell = Vext + ΔV+. (ii) Discharge the electrodes through an external load (Rext,fresh) to Vcell = Vext. (iii) Change the salt content of the solution from Cfresh to Csaline at constant stored charge. The cell voltage spontaneously decreases to Vcell = Vext – ΔV–. (iv) Charge the electrodes through an external load (Rext,saline) to Vcell = Vext.
Figure 1.
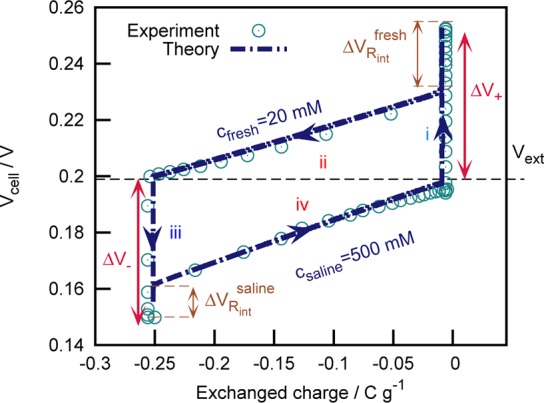
Measured (symbols) and simulated (line) CAPMIX cycle in the cell voltage-exchanged charge per gram of electrode space. Latin numbers refer to the four different steps of a CAPMIX cycle, as numbered in the main text. The exchanged charge is the integral of the current (Iext) through the external load in the charge and discharge steps, its zero value corresponding to the initial state. Characteristics of prototype cell: two parallel plate, Norit S30 carbon (BET area: 1650 m2/g) electrodes; geometric area of electrodes A = 1.5 × 1.5 cm2; electrode nominal thickness Le = 100 μm; distance between electrodes δ = 1 mm; external loads Rext,fresh = 25Ω and Rext,saline = 5Ω. D = DmA = DNaCl. Free parameters of the simulation: CSt,vol = 0.06GF/m3; pmi = 0.3; pmA = 0.4; Le = 85 μm.
The energy extracted by this cycle is the area enclosed in the curve of Figure 1, whose theoretical quantification requires the aforementioned charge–voltage relationship. Classical descriptions of the EDL are not valid inside the micropores of activated carbon particles, which have a size comparable to the EDL thickness and even to that of hydrated ions, leading to EDLs overlap and other complications, such as the observed very large values of the capacitance.27−30 In this work, we use the recent “modified Donnan” (mD) model,17,25 described below, which is valid in the limit of EDL thickness much larger than the characteristic size of micropores.
The cell voltage is given by a contribution due to the EDLs on each electrode ΔVEDL, which we assume to be symmetric, and by a contribution due to the internal resistance ΔVRint. Therefore, we express the cell voltage as Vcell = 2ΔVEDL – ΔVRint. The latter term is calculated from the conductivity of the solution in the spacer channel and inside the macropores, and the current through the cell, whereas ΔVEDL is given by the EDL model. It is common to distinguish between two regions in the EDL, which are called the diffuse and the Stern layers32
| 1 |
where ΔϕD = VD/VT and ΔϕSt = VSt/VT are the normalized voltages along the diffuse and the Stern layers, respectively. Here VT = kBT/e is the thermal voltage, kB is the Boltzmann constant, T is absolute temperature, and e is the electron charge.
The electrodes are made of activated carbon particles with a characteristic size of the order of the micrometer, which are assembled and sintered together. These particles are themselves porous, presenting a very large specific surface inside the small micropores (≤2 nm). Therefore, the free space between different carbon particles filled with electroneutral solution (with concentration Ci,mA = CmA, where i = ± applies to cations and anions, respectively) constitutes a macroporosity that serves as a path for salt and charge transport, whereas the micropores store ionic charge in their EDLs. The micro- and macro-porosities pmi and pmA are defined as the volume fraction occupied by micro- and macro-pores to the total electrode volume, respectively.
The mD model assumes a constant electric potential in the diffuse layer inside the micropores and a charge-free Stern layer, accounting for the minimum approach of ions to the surface. In the case of a monovalent, binary electrolyte, the concentration of cations and anions in the diffuse part of the EDLs inside the micropores is also constant and given by C±,mi = CmAexp(∓ΔϕD). To simplify matters, we introduce some dimensionless quantities in what follows. The concentrations are normalized by Csaline, and thus c±,mi = C±,mi/Csaline and cmA = CmA/Csaline. The dimensionless charge density in the diffuse part of the EDLs in the micropores qmi = 1/2(c+,mi – c–,mi) is related to ΔϕD and ΔϕSt through
| 2 |
where δmD = (2eCsaline)/(VTCSt,vol) and CSt,vol is a volumetric Stern capacitance. During electrode charging, salt adsorption takes place together with charge adsorption because counterions attraction exceeds the expulsion of co-ions from the EDLs when the condition VD ≪ VT is not verified.33 This is characterized by the concentration of ions of either type inside the micropores, wmi = 1/2(c+,mi + c–,mi) = cmA cosh ΔϕD.
Although eqs 1 and 2 suffice to simulate a CAPMIX cycle like the one shown in Figure 1, they do not inform about the dynamics during the cycle. For this aim, the electro-diffusion of ions inside the porous electrodes has to be taken into account. It can be described by 1D charge and mass balances in the direction x̂ perpendicular to the electrodes and to the flow in the spacer channel. We distinguish between two regions (see Figure 2): the stagnant diffusion layer (SDL) (−LSDL < x < 0), that is, a transition region out of the electrode matrix where the electric potential and the salt concentration change from their values in the bulk to those inside the electrode,16,34,35 and the electrode itself (0 < x < Le), where charge and salt adsorption have to be taken into account. This treatment leads to the Ohm’s law and the diffusion equation for the ions in the SDL, out of the electrode matrix16
| 3 |
| 4 |
where iSDL = ISDL/CsalineVT is the dimensionless current density in the SDL (note that it is constant along the whole SDL) and D is the bulk diffusion coefficient.
Figure 2.
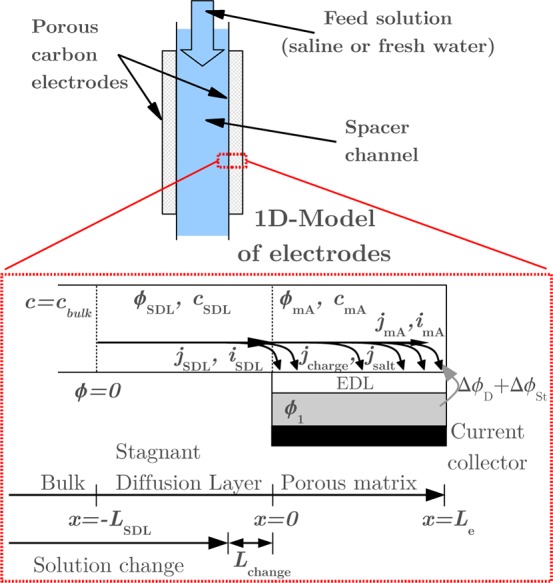
One-dimensional model of electro-diffusion of ions in porous electrodes applied to CAPMIX. The uniform rates of charge (iSDL(t)) and neutral salt (jSDL(t)) transport in the stagnant diffusion layer (SDL) due to gradients of salt concentration and electric potential are modified inside the porous matrix due to adsorption of both charge (jcharge(x,t)) and salt (jsalt(x,t)) into the EDLs that form at the solid–liquid interface, leading to position- (and time-) dependent quantities imA(x,t) and jmA(x,t). The local values of electric potential (ϕ(x,t)) and salt concentration (c(x,t)) determine, together with the adsorbed charge in the EDLs, the (unique) electrode potential through appropriate EDL models. At the beginning of the open circuit steps, the solution in the bulk and in part of the SDL is substituted. The part of the SDL that is not changed instantaneously is determined by the length Lchange. Cbulk is either Csaline or Cfresh.
Inside the porous matrix, these equations have to be modified to include the adsorption rates of charge (jcharge = ∂qmi/∂t) and salt (jsalt = ∂wmi/∂t) into the EDLs16
| 5 |
| 6 |
where imA = −2DmAcmA(∂ϕmA/∂x) and DmA are the dimensionless current density and the diffusion coefficient in the porous matrix, respectively. DmA is different from its bulk value D to account for the tortuosity. The boundary conditions at the macroscopic electrode–solution interface (x = 0) require the continuity of the fluxes of every ionic specie, salt concentration, and electric potential. Furthermore, the electric current is constant along all of the circuit (the CAPMIX cell and the external circuit, composed of the external source and the load). The salinity change steps, performed in open circuit (Iext = 0), are done by instantaneously substituting the solution in the spacer, leaving unchanged the solution in a layer close to the electrode of thickness Lchange. In this work, we arbitrarily set its value to Lchange = 20 μm. A more detailed description of the model and its solution can be found in the original work.16 In the present work, we numerically solve the coupled set of eqs 1–6 together with the specified boundary conditions.
Results and Discussion
Figure 3 illustrates the nontrivial dynamics, followed by Vcell during the operation of a CDLE cell. As we can see, after the four-step cycle, the cell comes back to its initial state demonstrating the feasibility of the technique. Together with the measured cycle, we have also plotted in Figure 3 the results of the discussed model, and a very good agreement between measurements and the numerical solution of eqs 1–6 is found.
Figure 3.
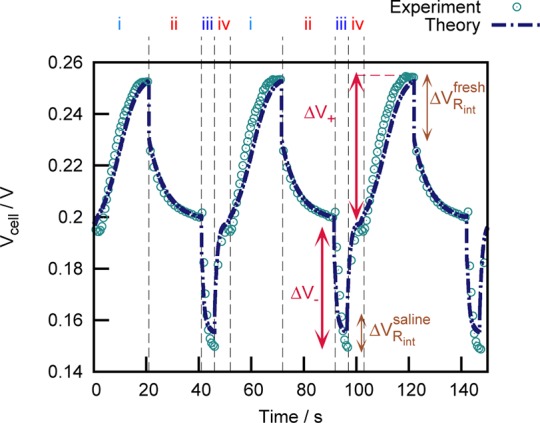
Comparison between the measured (symbols) and simulated (line) time evolution of Vcell along three consecutive CAPMIX cycles such as the one of Figure 1. In the open circuit steps (i and iii), the new solution flows for 5 s.
Whereas the charge and discharge steps have been previously analyzed,16 the open circuit steps present new phenomenology, with transport mechanisms with different time scales others than salt diffusion. When the solution is changed from saline to fresh water, salt diffuses from the highly concentrated macropores toward the fresh solution, thus establishing a concentration gradient inside the porous matrix and the bulk (quite sharp at short times after the switching, τ ≃ Lchange2/D ≤ 1 s, smoothing out on larger time scales). After the fresh-to-saline change, diffusion takes place from the spacer to the macropores. As already observed,2,3 the time evolution of the cell voltage upon solution change is asymmetric (see Figure 3), as the time needed to stabilize the voltage rise (switch from saline water to fresh water) is much longer than the characteristic fall time (fresh to saline) and also from the characteristic time of the diffusion inside the macropores of the electrode. Here we show that this behavior is mainly due to the highly nonlinear voltage–concentration relation, as shown in Figure 4: when the concentration is above 200 mM, the voltage changes very little with concentration, whereas below that value the dependence is very strong.
Figure 4.
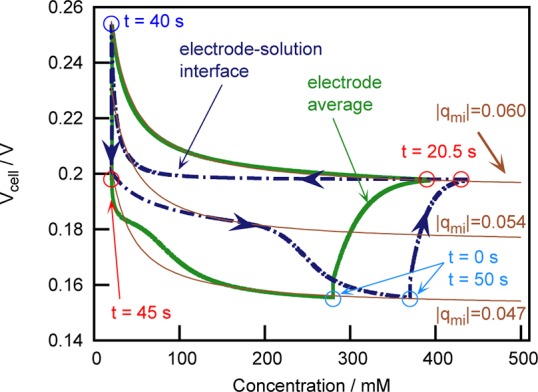
Thin solid lines, bottom to top: cell voltage versus salt concentration relations for |qmi| = 0.047, 0.054, and 0.06. Dashed-dotted and thick solid lines: simulated CAPMIX cycle in Figure 1, showing the evolution of the cell voltage with the salt concentration at the macroscopic electrode–solution interface (which determines the position x = 0) and average concentration in the electrode, respectively. Circles locate the initial state of each step, starting at the indicated times.
Indeed Figure 4 shows the position-dependent path, followed by the cell in the voltage–concentration space. Remarkably, the highest salt concentration Csaline = 500 mM is not reached at any point inside the porous matrix. This is due to the nonlinearity of the voltage–concentration dependence, which makes the cell voltage saturate at about CmA = 300 mM. As the cell is operated in view of the cell voltage, the next step is taken when it reaches a plateau, before the salt concentration gradient is canceled.
Of outermost importance is the evolution of Vcell with the concentration in the solution at the macroscopic electrode-spacer interface (x = 0), as it directly relates ΔVEDL(x = 0) to the electrode potential through the voltage drop in the spacer ΔVRint, without contributions from the resistivity of macropores. In this case, we see that in the saline-to-fresh solution open-circuit step, the concentration at x = 0 changes from about 400 to 100 mM concentration without any effect on Vcell. This happens because Vcell does not follow any constant-charge path in the open circuit steps but a more complex one. Within the short time scale where a salinity gradient is established after changing the solution, gradients of charge and salt adsorption also appear, as the ionic charge in the micropores is redistributed along the electrode, as shown in Figure 5. A current inside the electrode transports counterions from the surface micropores toward those deeper in the electrode, although the external current (equal to that flowing from one electrode to the other through the spacer) is zero. Of course, the total current on each electrode is conserved, as confirmed by the constant value of the average charge in the electrode during the open-circuit steps.
Figure 5.
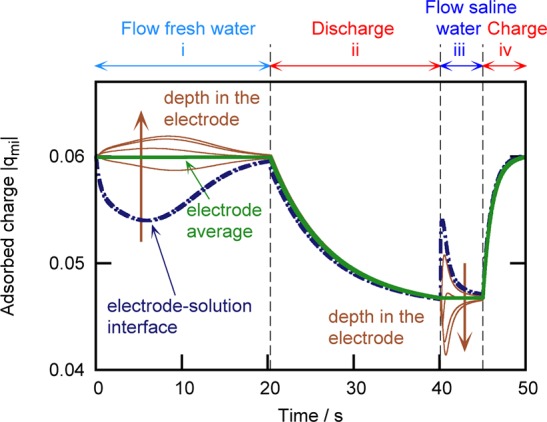
Time evolution over one of the CAPMIX cycles in Figure 3 of the adsorbed charge density at different depths in the electrode. Dashed-dotted line: |qmi| at the macroscopic electrode–solution interface, which determines the position x = 0. Thin, solid lines, in the order determined by the arrow: x = 0.25 Le, 0.5 Le, 0.75 Le, Le.
The redistribution of counterions significantly influences the evolution of Vcell with salt concentration. Such mechanism is responsible of the transitions in the path, followed by the cell in the Vcell – c(x = 0) space shown in Figure 4 from the |qmi| = 0.06 curve to the |qmi| = 0.054 one in the saline-to-fresh step and of that between |qmi| = 0.054 and |qmi| = 0.047 in the fresh-to-saline one.
It is interesting to note that this redistribution mechanism is also expected to take place along the length of the electrodes due to the presence of a concentration gradient in this direction, whereas the solutions are exchanged. Because of the short electrodes used in our present experiments (1.5 cm), we could neglect this effect in our treatment, as the solution is effectively changed in a couple of seconds, much faster than the characteristic times of voltage stabilization and charge redistribution. Therefore, a 2D analysis of the CAPMIX cycle would be desirable. However, as previously mentioned, the 1D model suffices to explain the experiments performed in the present contribution.
Finally, we must come back to the assumption of EDL overlap inside micropores. Although it is very likely to take place when the concentration of the solution in the cell is 20 mM, such overlap is expected to be weaker when the concentration is 500 mM. Therefore, the model should include the transport of ions along the micropores, at least in the high salinity steps. Such an inclusion would considerably complicate the theoretical analysis and would require a larger computational effort. However, we can justify our simplification on two points. On the one hand, it is well known that the actual length over which EDLs extend is larger than that given by the Debye length, covering distances to the surface several times larger than this characteristic size. Furthermore, it has been recently shown that steric effects increase the value of the Debye length.18,28 On the other hand, the diffusion inside the micropores in the absence of EDL overlap (seawater) would slow down the dynamics, leading to a more similar characteristic times of the fresh-to-saline and the saline-to-fresh solution change steps. Therefore, although its inclusion is certainly important, it can be neglected in the present study aiming at the identification of the mechanisms responsible of the observed asymmetry.
Conclusions
In summary, we have shown that the used model of the electro-diffusion of ions in porous electrodes is able to describe fairly well the full cyclic process of energy harvesting from salinity gradients with CDLE. The complex evolution of the cell potential observed in experiments has been explained, taking into account the adsorption and desorption of charge and salt into the micropores, the nonlinearity of the charge–voltage relations of the EDLs, and the transport of salt and charge in the electro-neutral macropores of the carbon electrodes. Altogether, these mechanisms lead to nonuniform charge and salt adsorption in the electrodes, considerably affecting the performance of the CAPMIX cell. The model thus validated is a key tool for the optimization of the CDLE technique.
Acknowledgments
The research leading to these results received funding from the European Union Seventh Framework Programme (FP7/2007-2013) under agreement no. 256868. R.A.R. acknowledges support from Regione Lombardia (Accordo per lo sviluppo del capitale umano nel sistema universitario lombardo). F.M. and D.S. acknowledge support of Cariplo Foundation Materiali avanzati -2011, Project 2011-0336.
The authors declare no competing financial interest.
References
- Bijmans M.; Burheim O.; Bryjak M.; Delgado A.; Hack P.; Mantegazza F.; Tenisson S.; Hamelers H. Energy Procedia 2012, 20, 108–115. [Google Scholar]
- Brogioli D. Phys. Rev. Lett. 2009, 103, 058501. [DOI] [PubMed] [Google Scholar]
- Brogioli D.; Zhao R.; Biesheuvel P. M. Energy Environ. Sci. 2011, 4, 772–777. [Google Scholar]
- Sales B. B.; Saakes M.; Post J. W.; Buisman C. J. N.; Biesheuvel P. M.; Hamelers H. V. M Environ. Sci. Technol. 2010, 44, 5661–5665. [DOI] [PubMed] [Google Scholar]
- Liu F.; Schaetzle O.; Sales B. B.; Saakes M.; Buisman C.; Hamelers H. V. M. Energy Environ. Sci. 2012, in press. DOI: 10.1039/C2EE21548A. [DOI] [PubMed] [Google Scholar]
- Guo W.; Cao L.; Xia J.; Nie F.-Q.; Ma W.; Xue J.; Song Y.; Zhu D.; Wang Y.; Jiang L. Adv. Funct. Mater. 2010, 20, 1339–1344. [Google Scholar]
- La Mantia F.; Pasta M.; Deshazer H. D.; Logan B. E.; Cui Y. Nano Lett. 2011, 11, 1810–1813. [DOI] [PubMed] [Google Scholar]
- Pattle R. E. Nature 1954, 174, 660. [Google Scholar]
- Norman R. S. Science 1974, 186, 350–352. [DOI] [PubMed] [Google Scholar]
- Post J. W.; Veerman J.; Hamelers H. V. M; Euverink G. J. W.; Metz S. J.; Nymeijer K.; Buisman C. J. N. J. Membr. Sci. 2007, 288, 218–230. [Google Scholar]
- Yip N. Y.; Elimelech M. Environ. Sci. Technol. 2011, 45, 10273–10282. [DOI] [PubMed] [Google Scholar]
- Simon P.; Gogotsi Y. Nat. Mater. 2008, 7, 845–854. [DOI] [PubMed] [Google Scholar]
- Candelaria S. L.; Shao Y.; Zhou W.; Li X.; Xiao J.; Zhang J.-G.; Wang Y.; Liu J.; Li J.; Cao G. Nano Energy 2012, 1, 195–220. [Google Scholar]
- Carrique F.; Arroyo F. J.; Delgado A. V. J. Colloid Interface Sci. 2002, 252, 126–137. [DOI] [PubMed] [Google Scholar]
- Boon N.; Van Roij R. Mol. Phys. 2011, 109, 1229–1241. [Google Scholar]
- Biesheuvel P. M.; Bazant M. Z. Phys. Rev. E 2010, 81, 031502. [DOI] [PubMed] [Google Scholar]
- Biesheuvel P. M.; Fu Y.; Bazant M. Z. Phys. Rev. E 2011, 83, 061507. [DOI] [PubMed] [Google Scholar]
- Bazant M. Z.; Kilic M. S.; Storey B. D.; Ajdari A. Adv. Colloid Interface Sci. 2009, 152, 48–88. [DOI] [PubMed] [Google Scholar]
- Biesheuvel P.; Fu Y.; Bazant M. Russ. J. Electrochem. 2012, 48, 580–592. [Google Scholar]
- Porada S.; Sales B. B.; Hamelers H. V. M; Biesheuvel P. M. J. Phys. Chem. Lett. 2012, 3, 1613–1618. [DOI] [PubMed] [Google Scholar]
- Suss M. E.; Baumann T.; Bourcier B.; Spadaccini C.; Rose K. A.; Santiago J. G.; Stadermann M. Energy Environ. Sci. 2012, 10.1039/C2EE21498A. [DOI] [Google Scholar]
- Zhao R.; van Soestbergen M.; Rijnaarts H.; van der Wal A.; Bazant M.; Biesheuvel P. J. Colloid Interface Sci. 2012, 10.1016/j.jcis.2012.06.022. [DOI] [PubMed] [Google Scholar]
- Oren Y. Desalination 2008, 228, 10–29. [Google Scholar]
- Biesheuvel P. M.; van Limpt B.; van der Wal A. J. Phys. Chem. C 2009, 113, 5636–5640. [Google Scholar]
- Biesheuvel P. M.; Zhao R.; Porada S.; van der Wal A. J. Colloid Interface Sci. 2011, 360, 239–248. [DOI] [PubMed] [Google Scholar]
- Rica R. A.; Ziano R.; Salerno D.; Mantegazza F. Brogioli D.. Phys. Rev. Lett. 2012, under review. [DOI] [PubMed] [Google Scholar]
- Chmiola J.; Yushin G.; Gogotsi Y.; Portet C.; Simon P.; Taberna P. L. Science 2006, 313, 1760–1763. [DOI] [PubMed] [Google Scholar]
- Das S.; Chakraborty S. Phys. Rev. E 2011, 84, 012501. [DOI] [PubMed] [Google Scholar]
- Das S.; Chakraborty S.; Mitra S. K. Phys. Rev. E 2012, 85, 051508. [DOI] [PubMed] [Google Scholar]
- Merlet C.; Rotenberg B.; Madden P. A.; Taberna P. L.; Simon P.; Gogotsi Y.; Salanne M. Nat. Mater. 2012, 11, 306–310. [DOI] [PubMed] [Google Scholar]
- Lyklema J.Fundamentals of Interface and Colloid Science; Academic: New York, 1995; Vol. 116. [Google Scholar]
- Bazant M. Z.; Thornton K.; Ajdari A. Phys. Rev. E 2004, 70, 021506. [DOI] [PubMed] [Google Scholar]
- Kim S.; Hoek E. M. Desalination 2005, 186, 111–128. [Google Scholar]
- Andersen M. B.; van Soestbergen M.; Mani A.; Bruus H.; Biesheuvel P. M.; Bazant M. Z.. Phys. Rev. Lett. 2012, in press [DOI] [PubMed]


