Abstract
Previous studies of mitochondrial DNA (mtDNA) in Europe and the Near East have suggested that, in contrast with classical markers and the Y chromosome, mtDNA does not exhibit significant geographical structuring. Here, we show that, with a sufficiently large sample size and a better resolved mtDNA tree, clades of mtDNA do indeed exhibit gradients similar to those of other marker systems. However, the more detailed analyses afforded by molecular sequence data suggest that the explanations for these gradients are likely to be much more complex than those proposed for classical markers.
In comparison with the gradients exhibited by classical markers (Menozzi et al. 1978; Ammerman and Cavalli-Sforza 1984; Sokal et al. 1989, 1991; Cavalli-Sforza et al. 1994), spatial analyses have hitherto been unable to detect much in the way of significant geographic structuring of the mtDNA landscape of Europe and the Near East. A principal-component (PC) analysis of hypervariable segment I (HVS-I) by Cavalli-Sforza and Minch (1997) indicated that the main pattern was a shallow east-west gradient that accounted for only 23% of the variation. Another investigation measured spatial autocorrelation and described only a weak gradient along the northern Mediterranean coast (Simoni et al. 2000). Unfortunately, this study was affected by extensive haplogroup misassignment of the HVS-I sequences (Torroni et al. 2000). Overall, these analyses led to suggestions that mtDNA may be too adversely affected by selection to be a suitable demographic marker system or that female gene flow had been too high within Europe for mtDNA alone to be informative for demographic history (Barbujani and Chikhi 2000).
However, the possibility should be considered that these results may have been due to lack of sufficient data for this kind of analysis, rather than to some quirk of the marker system itself. In support of this suggestion, some recent studies, using larger sample sets and/or slightly higher phylogenetic resolution, have (despite being limited in geographical scope) begun to yield better geographical resolution within Europe. Using data mainly from northern and western Europe, Helgason et al. (2001) showed that northwestern, central, western, and northeastern European populations could be separated by multidimensional scaling. In a comparison of three genetic marker systems, Wilson et al. (2001) showed that northwestern Europeans could be clearly distinguished from both Basques and Near Easterners on the basis of both mtDNA and X chromosome microsatellites. In contrast, Y chromosome markers showed a different pattern, in which western European populations clustered together, distinct from both Scandinavians on the one hand and Near Easterners on the other.
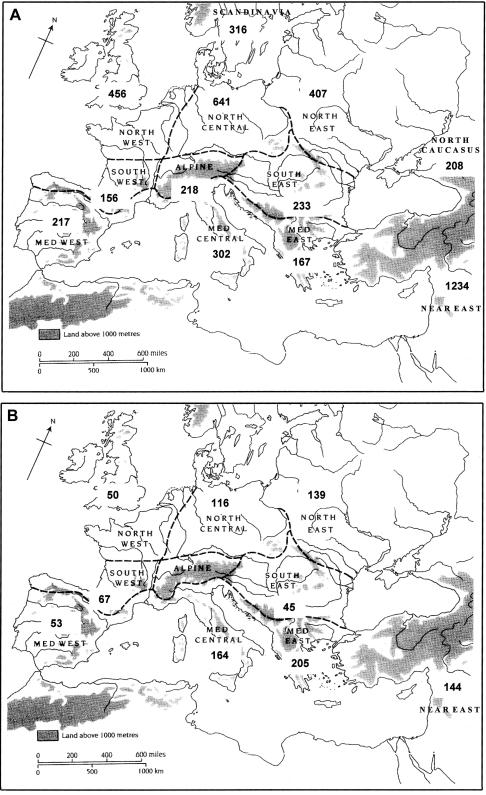
We have performed a PC analysis of a large and well-characterized data set comprising 3,113 European, 208 North Caucasian, and 1,234 Near Eastern mtDNAs (Lutz et al. 1998; Pfeiffer et al. 1999; Richards et al. 2000). We have divided the European data into regional zones, along the lines of Gamble (1986, 1999) but further distinguishing Scandinavia, while excluding Saami as extreme outliers. The geographical subdivisions and numbers of samples used from each region are shown in figure 1A.
Figure 1.
Regional map of Europe (modified from Gamble 1999, after Gamble 1986). A, Sample sizes for mtDNA data sets analyzed. B, Sample sizes for Y chromosome data sets analyzed. Note that, in the scheme we have used, Basques are the sole representatives of southwestern Europe; samples from France are grouped with northwestern Europe, and those from Galicia are grouped with the western Mediterranean.
We have analyzed the data on the basis of the frequencies of the principal mtDNA haplogroups: H, pre-V (Torroni et al. 2001), HV1, HV* (which may be paraphyletic), (pre-HV)1 (a clade within pre-HV [Richards et al. 2000, p. 1254]), K, U1, U2, U3, U4, U5, U7, J, T1, T* (which likely coincides with T2 as defined by Finnilä et al. [2001]), N1b, I, W, and X. In some analyses, we also included haplogroups of African provenance (L1, L2, particular subclades of L3, M1, and U6). Haplogroup assignment was based primarily on a phylogenetic-network analysis of HVS-I sequences, which allowed for the possibility that reversion mutations partially eliminated HVS-I motifs in certain cases (Richards et al. 2000). Whenever HVS-I sequences were ambiguous (within haplogroups H, HV, (pre-HV)1, and U), the assignment was complemented by targeted restriction typing of diagnostic coding-region variants. Further details on haplogroup assignment and phylogenetic trees indicating the relationships between the principal haplogroups can be found elsewhere (Richards et al. 1998; Macaulay et al. 1999; Richards and Macaulay 2000). The proportion pij of the ith haplogroup in the jth population/geographical region was estimated. This matrix was submitted to a PC analysis after the following transformation: pij→(pij-Pi)/[Pi(1-Pi)]1/2 (where, for each i, Pi is the mean of pij across populations). This aims to standardize against the different effect of genetic drift on alleles (haplogroups) of different frequencies (although it takes no account of the different ages of alleles).
In an analysis that encompasses all of these haplogroups, including those of African origin, the first PC is primarily east-west, separating Europeans from Near Easterners, and it accounts for 46% of the variation (PC map not shown). The second PC (17%) is approximately north-south, dominated by the extent of penetration of the African haplogroups into Europe and the Near East. This is likely to be the result of relatively recent gene flow affecting principally Iberia and the Levant.
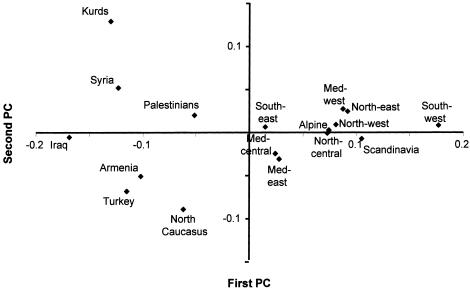
We next explored the effects of excluding the African haplogroups from the analysis. When this is done, the first PC increases to 51% of the variation and again separates Europe from the Near East (fig. 2). Iraq falls at one pole, southwestern Europe (the Basque country) at the other. The North Caucasus falls within the Near Eastern groups. This component thus provides us with a strong geographical pattern, which is indeed approximately southeast-northwest, as one might expect from the pattern of classical markers (Cavalli-Sforza et al. 1994). The Near Easterners form a clear group, distinct from Europeans. The central and eastern Mediterranean populations of Europe, along with southeastern Europe, although positioned more closely to the other European populations, also show affinities with the Near East, but western Mediterranean Europe clusters with central and northern Europe. The second PC accounts for only 11% of the variation and appears to be determined by variation within the Near East and the Caucasus, among which populations cluster the European samples.
Figure 2.
Region-based PC analysis of mtDNA haplogroup profiles in Europe and the Near East (excluded are haplogroups L1, L2, subclades of L3 with a sub-Saharan African origin, M, and U6). Med = Mediterranean.
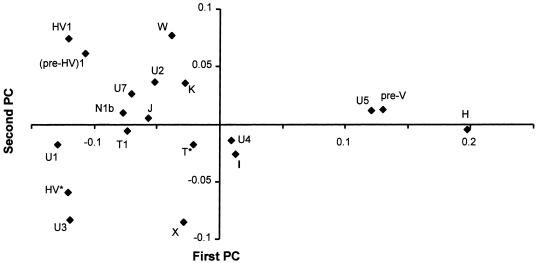
The main haplogroups contributing to the first PC are H, pre-V, and U5, concentrated at the European pole; the rather minor haplogroups (pre-HV)1 and U1 are concentrated at the Near Eastern pole (fig. 3). Haplogroup H is the most frequent haplogroup in both Europe and the Near East but occurs at frequencies of only ∼25%–30% in the Near East and the Caucasus, whereas the frequency is generally ∼50% in European populations and reaches a maximum of ∼60% in the Basque country. Haplogroups (pre-HV)1 and U1 are predominantly Near Eastern, with some (probably recent) gene flow along the Mediterranean, and haplogroups U5 and pre-V are predominantly European.
Figure 3.
Plot of the contribution of each haplogroup to the first and second PC in the analysis of figure 2
The southeast-northwest clines in classical marker frequencies have been interpreted, by comparison with radiocarbon evidence, as representing a substantial demic diffusion of Near Eastern farming communities into Europe in the early Neolithic period (Sokal et al. 1991; Cavalli-Sforza et al. 1994). However, the pattern in mtDNA haplogroup frequencies that we see here indicates similarity between Europeans and Near Easterners primarily in southeastern Europe and along the Mediterranean, whereas archaeological evidence would point to the main expansion of agriculture being into central Europe (Bogucki 2000; Price 2000). Thus, it seems rather unlikely that the pattern in mtDNA haplogroup frequencies could have been generated mainly by a Neolithic expansion.
A well-resolved Y chromosome gene tree now exists and can be found, along with all of the main haplogroup nomenclatures that have been proposed, in the recent article by the Y Chromosome Consortium (2002). Y chromosome markers also show continentwide gradients (Semino et al. 1996; Cavalli-Sforza and Minch 1997; Casalotti et al. 1999). This evidence has also been taken as supporting the demic diffusion of farmers (Semino et al. 1996; Cavalli-Sforza and Minch 1997; Hill et al. 2000; Rosser et al. 2000; Semino et al. 2000). However, attempts to quantify the contribution of the newcomers to the present day Y chromosome pool have suggested an overall value of only ∼22% (Semino et al. 2000). We analyzed the Y chromosome data of Semino et al. (2000), using a PC approach that was more comparable to our mtDNA haplogroup analysis, by grouping the Y chromosome lineages phylogenetically into major haplogroups and geographically into the larger continental regions used above (excluding the Saami, as with the mtDNA analysis). These data comprise 983 samples typed for 40 binary markers. The geographical distribution of the samples, again organized by reference to Gamble’s geographical regions, is shown in figure 1B.
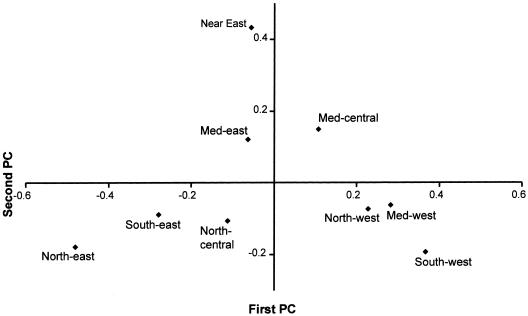
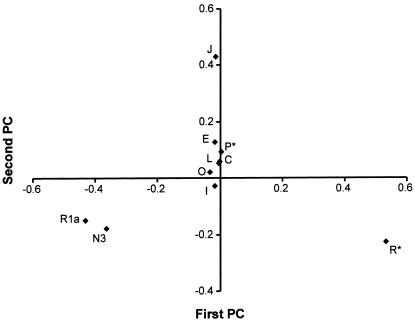
The results are shown in figure 4 and concur broadly with the patterns identified by Semino et al. (2000). The first PC accounts for 49% of the variation and is approximately east-west within Europe, but the Near East and eastern Mediterranean Europe cluster with central Europe. This gradient is accounted for largely by paragroup R* (nomenclature of the Y Chromosome Consortium [2002]), formerly haplogroup 1 (Jobling and Tyler-Smith 2000) in the west and by haplogroups R1a (formerly haplogroup 3) and N3 (formerly Tat) in the east (fig. 5). In agreement with the suggestion proposed to explain the distribution of mtDNA haplogroup V (Torroni et al. 1998, 2001), the distributions of Y chromosome groups R* and R1a have been interpreted by Semino et al. (2000) to be the result of postglacial expansions from refugia within Europe.
Figure 4.
Region-based PC analysis of Y chromosome biallelic marker data (Semino et al. 2000), grouped into major haplogroups (Y Chromosome Consortium 2002). Med = Mediterranean.
Figure 5.
Plot of the contribution of each haplogroup to the first and second PC in the analysis of figure 4
The second PC of Y chromosome variation accounts for 26% of the variation, and it clusters most European regions at one pole while grouping the Near East at the other, with eastern Mediterranean and central Mediterranean Europe between the two poles. The main contributors to the gradients are haplogroups E and J (formerly haplogroups 21 and 9, both of which are frequent in the Near East) and, again, R* and N3 (both of which are more frequent in Europe). This points to gene flow from the Near East, as suggested by both Cavalli-Sforza et al. (1994) and Semino et al. (2000). Haplogroup J in Europe is interpreted more specifically by Semino et al. (2000) as the result of Neolithic dispersal. Curiously, however, haplogroups E and J are again most frequent along the Mediterranean coastline and rapidly dwindle as one moves into central Europe, where the archaeological record tells us the main farming expansion took place.
Founder analysis of mtDNA in Europe (Richards et al. 2000) can suggest a possible explanation for this pattern: it might be due, at least in part, to substantial recent (post-Neolithic) gene flow, rather than solely to Neolithic expansion. This mtDNA founder analysis, based on the comparison of matching sequence types (within haplogroups) between Europe and the Near East, suggested that there is no one-to-one correlation between migrations and major clades. The analysis for eastern Mediterranean Europe indicated a very high frequency (∼20%) of recent gene flow, as compared with only ∼10% Neolithic input. It would be necessary to perform a similar founder analysis (using, for example, a large panel of fast-evolving microsatellites) to see whether a proportion of the putative Y chromosome Neolithic types in Europe are actually of more recent origin. However, it is suggestive that the frequency of Y chromosome haplogroup E, which Semino et al. (2000) have inferred to be Neolithic, appears at particularly high levels in the western Mediterranean in the more extensive sample of Rosser et al. (2000) (fig. 3E). As Rosser et al. suggest, this may imply gene flow mainly from North Africa (where haplogroup E reaches its highest frequency), rather than mainly from the Near East, because, judging from archaeological evidence, the development of agriculture in Iberia is likely to have been largely indigenous (Zilhão 2000).
The mtDNA founder analysis can also be drawn upon to gloss the PC analysis further. The founder analysis suggested that the main Neolithic founder haplotypes were members of mtDNA haplogroups J, T1, and U3. None of these haplogroups contribute substantially to the first PC of mtDNAs in Europe. Rather, the first PC is mainly shaped by haplogroups H, pre-V, and U5, which the founder analysis suggests either originated in Europe or spread into Europe during the Upper Paleolithic period. The haplogroup (pre-HV)1, by contrast, may have spread along the Mediterranean either during the Neolithic period or in more recent times or both. Thus, we seem to be witnessing, in the mtDNA data (and perhaps in the autosomal and Y chromosome data as well), the results of a palimpsest of processes, some possibly more recent than the Neolithic period and some much more ancient.
PC analysis is a useful way of visualizing high-dimensional data by means of projection. In this case, we have shown that, contrary to earlier suggestions, there is significant geographical structuring between different regions of Europe. Moreover, it is very likely that such a geographical structuring could be further improved by increasing the level of molecular resolution (e.g., by detecting and screening for diagnostic markers that allow the phylogenetic dissection of major haplogroups into geographically more restricted subhaplogroups). A finer haplogrouping, however, requires larger sample sizes to yield robust results.
The visualization of high-dimensional data by means of projection should not, in itself, serve as an inference tool. Our PC analysis does, however, suggest targets for further study. For instance, the grouping together of central and eastern Mediterranean populations spotlights the role of gene flow along the Mediterranean at various times. PC analysis, even of a single-marker system such as mtDNA or the Y chromosome, therefore has a part to play in exploratory data analysis. What is crucial, however, as with the interpretation of all summary statistics, is a subsequent evaluation of how a pattern has been generated in the data or, on the other hand, why a pattern has not been generated. Such an evaluation can then lead to further studies. As Clark (2000) has suggested, this kind of analysis “sets the agenda for future research, rather than constituting a set of conclusions that can stand or fall on their own merits.”
Acknowledgments
V.M. is a Wellcome Trust Career Development Fellow. We thank Henry Harpending, for the use of his POPSTR program, and Clive Gamble and Cambridge University Press, for permission to use figure 1.
References
- Ammerman AJ, Cavalli-Sforza LL (1984) The Neolithic transition and the genetics of populations in Europe. Princeton University Press, Princeton, NJ [Google Scholar]
- Barbujani G, Chikhi L (2000) Genetic population structure of Europeans inferred from nuclear and mitochondrial DNA polymorphisms. In: Renfrew C, Boyle K (eds) Archaeogenetics: DNA and the population prehistory of Europe. McDonald Institute for Archaeological Research, Cambridge, pp 119–129 [Google Scholar]
- Bogucki P (2000) How agriculture came to north-central Europe. In: Price TD (ed) Europe’s first farmers. Cambridge University Press, Cambridge, pp 197–218 [Google Scholar]
- Casalotti R, Simoni L, Belledi M, Barbujani G (1999) Y-chromosome polymorphisms and the origins of the European gene pool. Proc R Soc Lond B Biol Sci 266:1959–1965 [Google Scholar]
- Cavalli-Sforza LL, Menozzi P, Piazza A (1994) The history and geography of human genes. Princeton University Press, Princeton, NJ [Google Scholar]
- Cavalli-Sforza LL, Minch E (1997) Paleolithic and Neolithic lineages in the European mitochondrial gene pool. Am J Hum Genet 61:247–251 [DOI] [PMC free article] [PubMed] [Google Scholar]
- Clark GA (2000) Genes, tribes, and African history. Curr Anthropol 41:372–373 [PubMed] [Google Scholar]
- Finnilä S, Lehtonen MS, Majamaa K (2001) Phylogenetic network for European mtDNA. Am J Hum Genet 68:1475–1484 [DOI] [PMC free article] [PubMed] [Google Scholar]
- Gamble C (1986) The Palaeolithic settlement of Europe. Cambridge University Press, Cambridge [Google Scholar]
- ——— (1999) The Palaeolithic societies of Europe. Cambridge University Press, Cambridge [Google Scholar]
- Helgason A, Hickey E, Goodacre S, Bosnes V, Stefánsson K, Ward R, Sykes B (2001) mtDNA and the islands of the North Atlantic: estimating the proportions of Norse and Gaelic ancestry. Am J Hum Genet 68:723–737 [DOI] [PMC free article] [PubMed] [Google Scholar]
- Hill EW, Jobling MA, Bradley DG (2000) Y-chromosome variation and Irish origins. Nature 404:351–352 [DOI] [PubMed] [Google Scholar]
- Jobling M, Tyler-Smith C (2000) New uses for new haplotypes: the human Y chromosome, disease and selection. Trends Genet 16:356–362 [DOI] [PubMed] [Google Scholar]
- Lutz S, Wessier H-J, Heizmann J, Pollak S (1998) Location and frequency of polymorphic positions in the mtDNA control region of individuals from Germany. Int J Leg Med 111:67–77 [DOI] [PubMed] [Google Scholar]
- Macaulay V, Richards M, Hickey E, Vega E, Cruciani F, Guida V, Scozzari R, Bonné-Tamir B, Sykes B, Torroni A (1999) The emerging tree of west Eurasian mtDNAs: a synthesis of control-region sequences and RFLPs. Am J Hum Genet 64:232–249 [DOI] [PMC free article] [PubMed] [Google Scholar]
- Menozzi P, Piazza PA, Cavalli-Sforza LL (1978) Synthetic maps of human gene frequencies in Europeans. Science 201:786–792 [DOI] [PubMed] [Google Scholar]
- Pfeiffer H, Brinkmann B, Hühne J, Rolf B, Morris AA, Steighner R, Holland MM, Forster P (1999) Expanding the forensic German mitochondrial DNA control region database: genetic diversity as a function of sample size and microgeography. Int J Legal Med 112:291–298 [DOI] [PubMed] [Google Scholar]
- Price TD (2000) Europe’s first farmers. Cambridge University Press, Cambridge [Google Scholar]
- Richards M, Macaulay V (2000) Genetic data and the colonization of Europe: genealogies and founders. In: Renfrew C, Boyle K (eds) Archaeogenetics: DNA and the population prehistory of Europe. McDonald Institute for Archaeological Research, Cambridge, pp 139–151 [Google Scholar]
- Richards MB, Macaulay VA, Bandelt H-J, Sykes BC (1998) Phylogeography of mitochondrial DNA in western Europe. Ann Hum Genet 62:241–260 [DOI] [PubMed] [Google Scholar]
- Richards M, Macaulay V, Hickey E, Vega E, Sykes B, Guida V, Rengo C, et al (2000) Tracing European founder lineages in the Near Eastern mitochondrial gene pool. Am J Hum Genet 67:1251–1276 [PMC free article] [PubMed] [Google Scholar]
- Rosser ZH, Zerjal T, Hurles ME, Adojaan M, Alavantic D, Amorim A, Amos W, et al (2000) Y-chromosomal diversity in Europe is clinal and influenced primarily by geography, rather than language. Am J Hum Genet 67:1526–1543 [DOI] [PMC free article] [PubMed] [Google Scholar]
- Semino O, Passarino G, Brega A, Fellous M, Santachiara-Benerecetti S (1996) A view of the Neolithic demic diffusion in Europe through two Y chromosome–specific markers. Am J Hum Genet 59:964–968 [PMC free article] [PubMed] [Google Scholar]
- Semino O, Passarino G, Oefner PF, Lin AA, Arbuzova S, Beckman LE, De Benedictis G, Francalacci P, Kouvatisu A, Limborska S, Marcikiae M, Mika A, Mika B, Primorac D, Santachiara-Benerecetti S, Cavalli-Sforza LL, Underhill PA (2000) The genetic legacy of Paleolithic Homo sapiens sapiens in extant Europeans: a Y chromosome perspective. Science 290:1155–1159 [DOI] [PubMed] [Google Scholar]
- Simoni L, Calafell F, Pettener D, Bertranpetit J, Barbujani B (2000) Geographic patterns of mtDNA diversity in Europe. Am J Hum Genet 66:262–278 [DOI] [PMC free article] [PubMed] [Google Scholar]
- Sokal RR, Harding RM, Oden NL (1989) Spatial patterns of human gene frequencies in Europe. Am J Phys Anthropol 80:267–294 [DOI] [PubMed] [Google Scholar]
- Sokal RR, Oden NL, Wilson C (1991) Genetic evidence for the spread of agriculture in Europe by demic diffusion. Nature 351:143–144 [DOI] [PubMed] [Google Scholar]
- Torroni A, Bandelt H-J, D’Urbano L, Lahermo P, Moral P, Sellitto D, Rengo C, Forster P, Savantaus M-L, Bonné-Tamir B, Scozzari R (1998) mtDNA analysis reveals a major late Paleolithic population expansion from southwestern to northeastern Europe. Am J Hum Genet 62:1137–1152 [DOI] [PMC free article] [PubMed] [Google Scholar]
- Torroni A, Bandelt H-J, Macaulay V, Richards M, Cruciani F, Rengo C, Martinez-Cabrera V, et al (2001) A signal, from human mtDNA, of postglacial recolonization in Europe. Am J Hum Genet 69:844–852 [DOI] [PMC free article] [PubMed] [Google Scholar]
- Torroni A, Richards M, Macaulay V, Forster P, Villems R, Nørby S, Savantaus M-L, Huoponen K, Scozzari R, Bandelt H-J (2000) mtDNA haplogroups and frequency patterns in Europe. Am J Hum Genet 66:1173–1177 [DOI] [PMC free article] [PubMed] [Google Scholar]
- Wilson JF, Weiss DA, Richards M, Thomas MG, Bradman N, Goldstein DB (2001) Genetic evidence for different male and female roles during cultural transitions in the British Isles. Proc Natl Acad Sci USA 98:5078–5083 [DOI] [PMC free article] [PubMed] [Google Scholar]
- Y Chromosome Consortium, The (2002) A nomenclature system for the tree of human Y-chromosomal binary haplogroups. Genome Res 12:339–348 [DOI] [PMC free article] [PubMed] [Google Scholar]
- Zilhão J (2000) From the Mesolithic to the Neolithic in the Iberian peninsula. In: Price TD (ed) Europe’s first farmers. Cambridge University Press, Cambridge, pp 144–182 [Google Scholar]


