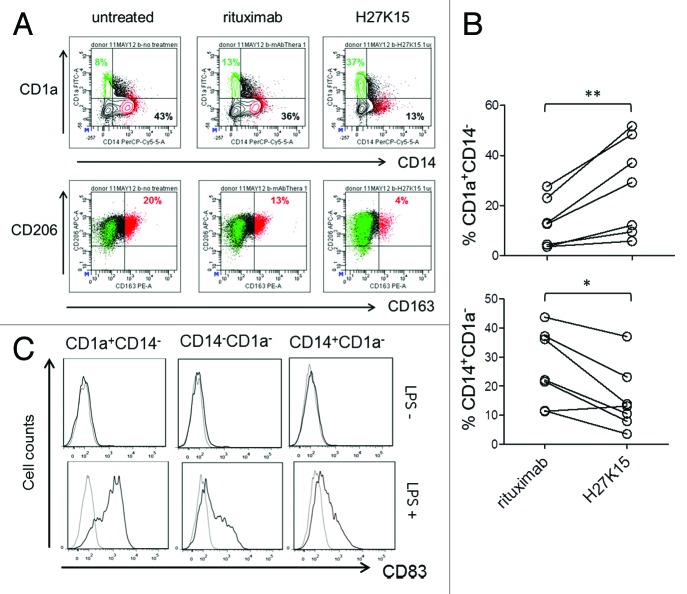
Figure 5. mAb H27K15 skews monocyte differentiation from macrophages toward DCs. (A) Dot plots represent CD1a and CD14 expression (upper panel) or CD206 and CD163 expression (lower panel) after 6 d of monocyte differentiation with GM-CSF and CSF-1 in the presence or absence of mAb H27K15 or control IgG1 rituximab. CD1a+CD14- cells (green) are CD163-CD206+, while the CD163-positive population (red) is CD14+CD1a-. Percentages of CD1a+CD14- and CD14+CD1a- cells are indicated in the corresponding quadrants and percentages of CD206+CD163+ cells are shown in red. (B) Increase in DCs (CD1a+CD14-, upper panel) and decrease in macrophages (CD14+CD1a-, lower panel) within the live cell population in monocyte from 7 different blood donors differentiated with GM-CSF and CSF-1 in presence of 1 µg/ml H27K15, compared with control rituximab. **p = 0.015 and *p = 0.03 using Wilcoxon’s paired test. (C) CD83 expression was analyzed by FC in monocytes cultured for 6 d with GM-CSF and CSF-1 in presence of mAb H27K15, without (upper panels) or after LPS stimulation (lower panels) for an additional 24 h. Histograms showing CD83 staining (black lines) compared with isotype control (gray lines) in the CD1a+CD14-, CD1a-CD14- and CD14+CD1a- populations. Results from one blood donor representative of 2 tested in independent experiments.

An official website of the United States government
Here's how you know
Official websites use .gov
A
.gov website belongs to an official
government organization in the United States.
Secure .gov websites use HTTPS
A lock (
) or https:// means you've safely
connected to the .gov website. Share sensitive
information only on official, secure websites.
