

Abstract
A majority of breast cancers are estrogen receptor (ER) positive and have a luminal epithelial phenotype. However, these ER+ tumors often contain heterogeneous subpopulations of ER− tumor cells. We previously identified a population of cytokeratin 5 (CK5) positive cells within ER+ and progesterone receptor positive (PR+) tumors that is both ER−PR− and CD44+, a marker of breast tumor-initiating cells (TICs). These CK5+ cells have properties of TICs in luminal tumor xenografts, and we speculated that they are more resistant to chemo- and anti-ER-targeted therapies than their ER+ neighbors. To test this, we used ER+PR+ T47D and MCF7 breast cancer cells. CK5+ cells had lower proliferative indices than CK5− cells, were less sensitive to 5-fluorouracil and docetaxel, and cultures became enriched for CK5+ cells after treatments. CK5+ cells were less prone to drug-induced apoptosis than CK5− cells. In cells treated with 17β-estradiol (E) plus anti-estrogens tamoxifen or fulvestrant, ER protein levels decreased, and CK5 protein levels increased, compared to controls treated with E alone. In ER+ tumors from patients treated with neoadjuvant endocrine therapies ER gene expression decreased, and CK5 gene expression increased in post compared to pre-treatment tumors. The number of CK5+ cells in tumors also increased in post- compared to pre-treatment tumors. We conclude that an ER−PR−CK5+ subpopulation found in many luminal tumors is resistant to standard endocrine and chemotherapies, relative to the majority ER+PR+CK5− cells. Compounds that effectively target these cells are needed to improve outcome in luminal breast cancers.
Keywords: Tumor-initiating cells, Estrogen receptors, Endocrine therapy, Tamoxifen, Cytokeratin 5, Breast cancer
Introduction
Luminal subtype breast cancers are distinguished by expression of receptors for the female steroid hormone estrogen (ER). These tumors are usually also progesterone receptor (PR) positive, although a subset of ER+PR− tumors exist [1], express other luminal markers such as the epithelial-specific intermediate filament protein cytokeratin (CK) 18 and Mucin 1, and can be positive or negative for human epidermal growth factor receptor 2 (HER2) [2]. Growth of luminal tumors is driven by estrogens and targeting of estrogen/ER is the cornerstone of current therapeutic strategies. While luminal tumors have a much more favorable prognosis than triple negative phenotype (TNP) tumors, which lack ER, PR, and HER2, drug resistance and subsequent local and distant recurrences remain a critical problem and major cause of death for luminal disease. Molecular profiling of ER+ tumors (i.e., Oncotype Dx testing) provides a recurrence score that identifies patients with high risk disease. This allows for more targeted treatment regimens for these patients [3], but does not explain the cause of resistance/recurrence in these ER+ tumors. Furthermore, the propensity of luminal tumors to relapse cannot be explained by the percent of ER+ cells alone [4]. Most luminal ER+ tumors contain heterogeneous subpopulations of ER− tumor cells. The role of these ER− populations in mediating drug resistance and tumor recurrence has not been fully explored.
One plausible explanation for acquisition of drug resistance, relapse, and metastasis in luminal tumors is the presence of drug extruding, tumor-initiating cells (TICs). The phenotype of TICs is defined as being relative quiescent, compared to the majority of tumor cells, with heightened expression of multi-drug resistant pumps, such as members of the ABC transport family [5], and lower levels of reactive oxygen species [6]. These properties would confer a selective advantage in avoiding therapeutic drugs. TICs in primary human breast cancers are described as Lin−CD44+CD24−/low, epithelial specific antigen (ESA)+[7]. CD44+CD24−/low cells are relatively resistant to standard chemotherapies [8, 9] and radiation therapy [6, 10] compared to non CD44+CD24−/low tumor cells. CD44+CD24−/low cells also contain a stem-like and invasive gene signature which is itself a predictor of metastasis free survival [11, 12]. However, other studies have found no association between the actual prevalence of these cells in human breast tumors and overall survival [13, 14]. Thus, there remains a need for more specific markers to define the drug resistant cells within the CD44+CD24−/low fraction. One such marker, aldehyde dehydrogenase 1 (ALDH1) additionally specifies TICs within the CD44+CD24−/low fraction of TNP breast tumors, but appears to be absent in luminal ER+ breast cancer cell lines and tumors [15, 16]. This underscores the need to better define TICs in common luminal ER+ breast cancers, and their role in drug resistance and recurrence in luminal disease. It has been postulated that ER− subpopulations within ER+ luminal breast cancers harbor such TICs [17].
We previously identified a subpopulation of cells that exist within the CD44+CD24−/low TIC fraction of luminal ER+PR+ tumor xenografts that are positive for CK5 [18]. The latter is a signature marker of poor prognostic ER− basal breast tumors [2]. In fact, the CK5+ cells in luminal tumors lack ER and PR as well. CK5 has been implicated as a marker of both stem cells and bi-potent progenitor cells in the normal breast [19–21]. We previously demonstrated that these CK5+ cells show properties of TICs in ER+PR+ breast tumor xenografts [18]. Their ER negativity and residence within the CD44+CD24−/low population make them good candidates for a more specific marker of TICs within luminal ER+ disease. We speculated that the CK5+ fraction of luminal tumors would have heightened resistance to both chemotherapy drugs and endocrine therapy agents that target ER+ tumor cells. In this article, we demonstrate that CK5+ cells are mitotically quiescent as compared to surrounding CK5− cells, and are less sensitive to the chemotherapeutic agents 5-fluorouracil and docetaxel. Furthermore, treatment of ER+ breast cancer cells with tamoxifen or fulvestrant in vitro, and neoadjuvant endocrine therapy of ER+ tumors clinically, decreases expression of ER while concomitantly increasing the expression of CK5. We conclude that luminal ER+ tumors contain a subpopulation of ER−PR−CK5+ cells that are more resistant to chemo- and endocrine therapies compared to the bulk CK5− tumor cells. Effective targeting of these cells in luminal ER+ disease may improve therapy response and reduce recurrence in this group of patients.
Materials and methods
Reagents
The human breast cancer cell lines T47D and MCF7 were originally obtained from Iafa Keydar [22], and Sam Brooks, the Michigan Cancer Foundation, respectively. They were maintained in MEM supplemented with 0.2 units/ml insulin and 5% fetal bovine serum (FBS). Both cell lines are ductal carcinomas isolated from pleural effusions of breast cancer patients. Cell line authenticity was confirmed by short tandem repeat analyses in the University of Colorado DNA Sequencing Core Laboratory. Antibodies were mouse mAb to CK5 (XM26, Novacastra, UK); rabbit mAb to ER (SP1, Lab Vision, Fremont, CA); mouse mAb to PR (1294, DAKO, Carpinteria, CA), rabbit pAb to cleaved caspase 3 (Promega); rabbit pAb to cleaved poly (ADP-ribose) polymerase (PARP, Danvers, MA), and mouse mAb to β-actin (A5316, Sigma-Aldrich, St. Louis, MO). 17β-estradiol (E), 6α-Methyl-17α-hydroxyprogesterone acetate (MPA), 5-Fluorouracil, 4-hydroxytamoxifen, 5-bromo-2-deoxyuridine (BrdU), and 4′, and 6-diamidino-2-phenylindole (DAPI) were purchased from Sigma (St. Louis, MO). Docetaxel was purchased from LC Labs (Woburn, MA), and ICI-182780 from Tocris Bioscience (Ellisville, MO). Reduced growth factor Matrigel was from BD Biosciences (Franklin Lakes, NJ).
Cell culture and drug treatments
T47D cells were isolated from xenograft tumors as previously described [18] and are termed T47DT cells. For two-dimensional (2D) culture, T47DT and MCF7 cells were seeded in 60-mm dishes onto glass coverslips at 105 cells/well in phenol red-free 5% dextran-coated, charcoal-stripped media. Dose–response curves were performed for 5-FU and Dx in T47D and MCF7 cells using MTT assays and concentrations chosen that elicited a 80–90% cytoreduction after 3 days. For chemotherapy experiments, cells were either treated with vehicle (ethanol), 150 μM 5-fluorouracil (5-FU) or 10 nM docetaxel (Dx) for 3 days. For hormone therapy, cultures were either unsupplemented (estrogen withdrawal, EWD), or supplemented with 10 nM E alone, E + 100 nM 4-hydroxytamoxifen (Tam), or E + 100 nM ICI-182780 (fulvestrant). Cultures were incubated for 3 weeks under each of these conditions, replenishing media and hormones every other day. Three-dimensional (3D) culture of cells in Matrigel was previously described [18]. For the current 3D experiments, 104 cells were seeded onto Matrigel on day 1 in MEM plus 5% dextran-coated charcoal-stripped FBS. Cells were treated with vehicle, 150 μM 5-FU, or 10 nM Dx for 3 days prior to fixation and paraffin embedding. For some experiments, cells were treated 1 day prior to drug treatments with either 100 nM MPA (P, T47D) or a combination of 10 nM E plus 100 nM MPA (E + P, MCF7), which expands the population of CK5+ cells [18, 23]. Cultures were incubated with 0.25 mg/ml (BrdU) for 1 h prior to collection and fixation.
Immunocytochemistry and immunohistochemistry
Breast cancer tissue arrays were purchased from Biochain (Hayward, CA). These were stained by immunohistochemistry (IHC) with an EnVision™ G|2 Doublestain System (DAKO) with antibodies to ER (DAB, brown) or PR (DAB, brown), and CK5 (Alkaline phospatase (AP), fast red). For cells in 2D culture, cells were fixed onto glass coverslips in ice cold 70% acetone/30% methanol for 5 min and stained by immunocytochemistry (ICC) with antibodies to CK5/ER, CK5/PR, or CK5/BrdU. 3D cultures were formalin fixed and paraffin embedded as previously described [18]. Sections (5 μm) were dual stained using the antibody combinations CK5/BrdU, or CK5/cleaved caspase 3, or CK5/cleaved PARP where the second antibodies were rabbit mAbs. Secondary antibodies were anti-mouse and anti-rabbit Alexa Fluors 488 (green) and 555 (red)-conjugated, respectively. A Nikon E600 microscope was used for photography. Images were shot in black and white using ImagePro software (Media Cybernetics) and merged in Adobe Photoshop CS3 (Adobe).
Immunoblots
Protein extracts were prepared from T47D cells following treatments by solubilizing cells in lysis buffer (50 mM Tris pH 7.4, 150 mM NaCl, 1 mM EDTA, 1% Triton, 1% sodium deoxycholate (SOC), 0.1% SDS) supplemented with protease and phosphatase inhibitors. Protein concentrations were determined by Bradford assay. Cell extracts (50 μg of total protein) were resolved on 10% SDS-PAGE gels, transferred to nitrocellulose, and probed with monoclonal antibodies to ER, CK5, or β-actin. Bands were visualized by enhanced chemiluminescence. Bands were quantified by gel scanning and densitometry with an Alpha Imager 2200 (Alpha Innotech, San Leandro, CA).
Clinical array data
Details of an ongoing randomized phase II clinical trial investigating neoadjuvant treatment with exemestane alone, or exemestane plus tamoxifen have been described [24]. Briefly, women with locally advanced ER+ breast cancers underwent treatments for 4 months. Tumor samples were obtained pre-treatment via core needle biopsies, and post-treatment at the final excision surgery. For this study, paraffin sections of tumors pre- and post-treatment (6 pairs) were immunostained with an mAb to CK5 (EnVision™, DAKO, permanent red). Labeled cRNA was prepared from tumor pieces, hybridized to HGU133 Plus 2.0 Affymetrix oligonucleotide microarray chips, and analyzed as described [24]. Normalized expression levels (Genespring 7.3, Agilent Technologies) for the ER (ESR1) and CK5 (KRT5) probesets were determined pre- and post-therapy (n = 6 pairs). The protocol was approved by the Colorado Multiple Institutional Review Board. Informed consent was obtained from all patients prior to participation.
Biostatistics
Graphpad Prism software (version 4.0) was used to analyze and graph all data. For 2D culture, multiple fields (10–20) were counted and statistical significance was determined by Student’s t test (two groups), or one-way ANOVA/Dunnett’s post test (three groups). For 3D culture, individual colonies (10–20) were counted and statistical significance determined by one-way ANOVA/Tukey (three groups) or Student’s t test (two groups). For tumor sections (primary, T47D, MCF7), CK5+ cells were scored for ER and PR staining, plotted as the average percent positive and negative for each, and analyzed by Student’s t test. Primary tumors pre- and post-neoadjuvant endocrine therapy were scored for the number of CK5+ cells across multiple fields, plotted, and analyzed by paired t test. Paired t tests were also used to analyze normalized gene expression of specific probesets from previously described microarray data [24].
Results
A subpopulation of cells of with an ER−PR−CK5+ phenotype exists in many primary luminal ER+ human breast tumors and xenograft tumors derived from ER+ breast cancer cell lines
To determine the prevalence of a CK5+ subpopulation within ER+ tumors, a human breast cancer tissue array representing 25 cases was stained by dual IHC for CK5/ER. Luminal ER+PR+/− tumors, all invasive ductal carcinomas, represented 16/25 cases of the dataset (64% of the cohort). All 16 luminal tumors contained CK5+ cells; some of these were located in residual normal areas. Nine/16 (56%) also contained CK5+ cells within the tumor tissue. Figure 1a depicts representative samples of primary breast cancers and xenograft tumors derived from T47D or MCF7 breast cancer cells immunostained for ER(brown)/CK5(pink) or PR(brown)/CK5(pink). A low magnification view of a primary and T47D tumor depicts the prevalence of a minor subpopulation of CK5+ cells that ranges from 1 to 10% [23, 25]. Higher magnification views depict that CK5+ cells are both ER− (primary, MCF7) and PR− (primary, T47D), indicated by arrows. Figure 1b depicts the percent of CK5+ cells in primary and xenograft tumors that are negative/positive for ER and PR. Greater than 95% of CK5+ cells are negative for both ER and PR confirming these cells represent one ER−PR− subpopulation within luminal tumors (P < 0.0001, t test).
Fig. 1.
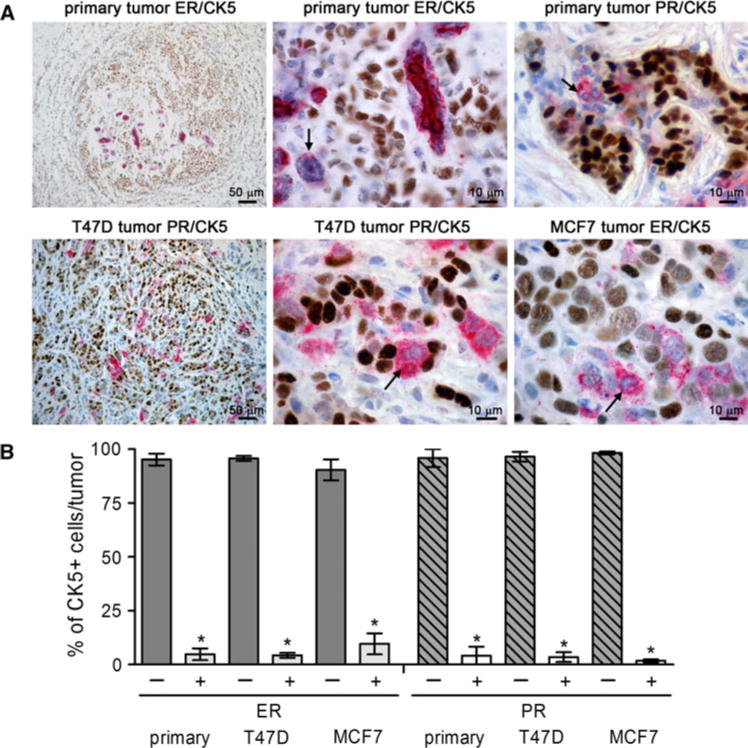
Luminal ER+ breast cancers contain a subpopulation of ER−PR−CK5+ cells. a Paraffin sections of primary ER+ breast tumors and T47D and MCF7 breast cancer xenografts were stained by dual IHC for ER (brown)/CK5 (pink) or PR (brown)/CK5 (pink). Lower and higher magnification images are shown. Arrows indicate ER−CK5+ or PR−CK5+ cells in each higher magnification image. b Graph illustrates the percent of CK5+ cells that were positive or negative for each steroid receptor plus/minus SEM (n = 10 tumors T47D (PR), MCF7 (ER); n = 5 tumors T47D (ER), MCF7 (PR); n = 9 primary tumors (ER, PR)). * P < 0.0001 t test comparing the percent of CK5+ cells that were positive versus negative for ER or PR in each tumor type. (Color figure online)
We have demonstrated that the Lin−ESA+ fraction of cells isolated from T47D xenograft tumors (T47DT) retain a static population of 10–20% CK5+ cells on both 2D plastic and in 3D Matrigel culture, at similar levels to the tumors from which they were derived [18]. For the majority of experiments described here, we use the T47DT cells as a model to study the relative resistance of CK5+ cells to therapies compared to the majority CK5− cells. We have also previously demonstrated that treatment with a combination of estrogen- plus progestin (E + P), but not estrogen alone (E), increases the number of CK5+ cells from 0–2 to 10–20% in breast cancer cell lines and xenograft tumors derived from these cell lines [23, 25]. This occurs in all ER+PR+ cell lines tested (T47D, MCF7, ZR75-1, BT474), but not in ER−PR− cells (BT549, MDA-MB-231). T47D and MCF7 cells treated with P or E + P are used for some studies, where noted.
Relative quiescence of CK5+ compared to CK5− cells within luminal breast cancer cell lines
To determine if the CK5+ and CK5− populations within ER+ breast cancer cell cultures proliferate at similar or different rates, we analyzed BrdU incorporation. T47DT and MCF7 cells were plated either into 2D plastic culture (105 cells), or into 3D Matrigel culture (104 cells) and colonies allowed to form for several days. For MCF7 cells, cultures were inoculated with E + P on day 1 to expand CK5+ cells for this analysis [23]. BrdU (0.25 mg/ml) was added to cultures 1 h prior to harvest. Cells in 2D were fixed and dual fluorescent ICC was performed for ER/CK5, PR/CK5, BrdU/CK5, or BrdU/PR (T47DT). Cells in 3D were fixed in paraformaldehyde, embedded into paraffin blocks, and stained by dual IHC for BrdU/CK5. All samples were counterstained with DAPI. The CK5+ (green) cells are negative for both ER and PR (>95% ER−PR−, indicated by arrows), similar to that observed in primary and xenograft tumors (Fig. 1). Conversely, both the PR+ (red) and ER+ (red) cells are CK5− (indicated by arrows). Representative immunostains for both T47DT and MCF7 cells grown in 2D (top) or 3D culture (bottom) are depicted in Fig. 2b (BrdU, red nuclear; CK5, green cytoplasmic). A CK5+BrdU+ cell in T47DT culture is indicated by an asterisk. Multiple fields (2D) or colonies (3D) were scored for DAPI+, BrdU+, CK5+, and PR+ (T47DT) cells. Results are plotted in Fig. 2c as the average percent of CK5−/BrdU+, PR+/BrdU+, and CK5+/BrdU+ cells per field. In T47DT 2D cultures, CK5+ (17.6%) cells were significantly less proliferative than either CK5− (26.4%) or PR+ (23.8%) cells (P < 0.05). Similarly, in MCF7 2D cultures CK5+ cells (4.8%) were less proliferative than CK5− (29.0%) cells (P < 0.001). In 3D cultures, 21.4 and 20.6% of CK5− T47DT and MCF7 cells were BrdU+. In contrast, BrdU positivity was significantly reduced in CK5+ cells in T47DT (6.5%) and MCF7 cultures (2.2%) (t test at P < 0.01 and P < 0.001, respectively). Dual staining for CK5/Ki67 yielded similar results (not shown). We conclude that in luminal breast cancer cell lines, the minority CK5+ population has a lower proliferative rate relative to the majority CK5− cells.
Fig. 2.
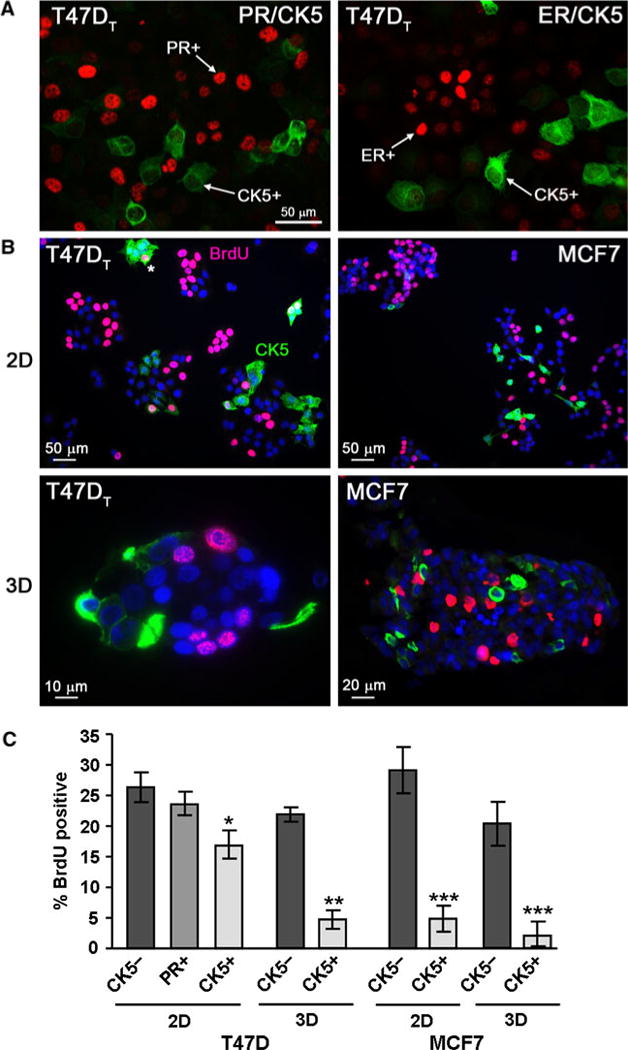
Relative quiescence of CK5+ compared to CK5− cells in luminal breast cancer cell lines. a T47DT cells were stained by dual fluorescent ICC for PR (red)/CK5 (green) or ER (red)/CK5 (green). Arrows indicate PR+(CK5−) and ER+(CK5−) cells and CK5+(ER−PR−) cells. b T47DT and MCF7 cell lines were placed in 2D (top) or 3D Matrigel (bottom) culture conditions and allowed to grow into colonies for 3 days. Cultures were spiked with 0.25 mg/mL BrdU for 1 h prior to fixation. Representative fields of T47DT and MCF7 cells stained by dual ICC (2D) or IHC (3D) for CK5 (green) and BrdU (red) are shown. Sections were counterstained for DAPI (blue). Nuclear BrdU staining and cytoplasmic CK5 staining are indicated in panel one. An asterisk marks a dual CK5+/BrdU+ cell (T47DT, 2D). c Graph of BrdU incorporation in T47DT and MCF7 cells in 2D and 3D culture. Multiple fields (10–12, 2D), or colonies (20–22, 3D) were scored for the number of DAPI, BrdU, CK5, and PR (T47DT) positive cells. The percent of cells negative or positive for CK5, or PR (T47DT) that were also BrdU+ were calculated and plotted (average plus/minus SEM). * P < 0.05 compared to CK5− or PR+, one-way ANOVA/Tukey; ** P < 0.01 and *** P < 0.001 t test compared to CK5− cells. (Color figure online)
Chemotherapy treatment enriches for CK5+ cells in T47DT cultures
We speculated that CK5+ cells would be less sensitive to chemotherapy agents that target cell division, compared to the more rapidly dividing CK5− cells. To test this, T47DT cells were plated at 105 cells/60 mm well in 2D culture allowed to expand for 3 days, and then treated with vehicle, 150 μM 5-FU, or 10 nM Dx for 3 days. Cultures were fixed and stained for CK5 by ICC, and counterstained with DAPI. Figure 3a shows representative fields stained for CK5 following treatment with vehicle (control), 5-FU or Dx. Ten-12 fields per condition were scored for total cells (DAPI+) and CK5+ cells. These were plotted as a percent of total cells for each treatment in Fig. 3b. The average percent of CK5+ cells/field in control cells was 22.2%; this increased to 29.9 and 41.0% CK5+ cells/field in 5-FU and Dx-treated cells, respectively. These were statistically significant (ANOVA/Dunnett’s, P < 0.05 control vs. 5-FU, P < 0.01 control vs. Dx). Similar results were obtained for T47D cells treated with P (not shown). Longer treatment times and higher chemical doses could eradicate both populations of tumor cells. These data confirm that CK5+ cells become enriched 1.4–2 fold in cultures treated with chemotherapy agents that target DNA replication.
Fig. 3.
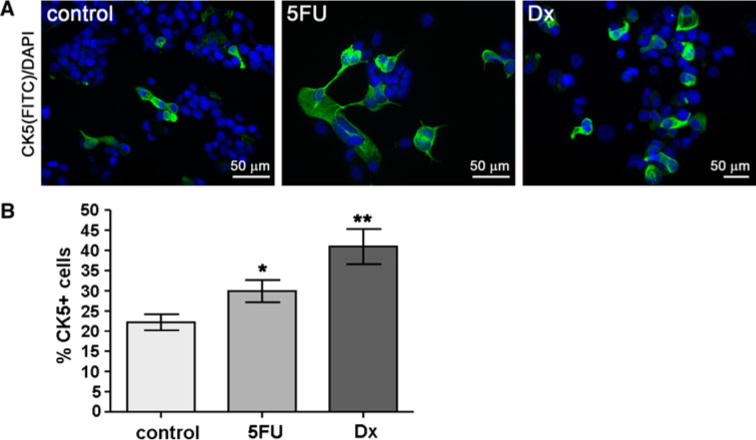
The CK5+ population is enriched in T47DT cells following chemotherapy. T47DT cells were plated at 105 cells/well and treated with vehicle, 150 μM 5-FU, or 10 nM Dx for 3 days. a Representative fields of cells treated with vehicle (control), 5-FU, or Dx and immunostained for CK5 (green) and DAPI (blue). b Multiple fields (n = 10–12) were counted for DAPI+ and CK5+ cells and plotted as the percent of CK5+ cells/field ± SEM. * P < 0.05 control versus 5-FU, ** P < 0.01 control versus Dx, one-way ANOVA/Dunnett’s post test. (Color figure online)
CK5+ tumor cells avoid chemotherapy induced apoptosis compared to CK5− cells
To confirm if CK5+ cells are less apoptotic during treatments compared to CK5− cells, we stained for known markers of apoptosis in 3D cultures of T47DT and MCF7 cells. For some experiments, T47D and MCF7 cells were treated with P (T47D) or E + P (MCF7) for 24 h prior to drug treatments. Cultures were treated with vehicle (cont), 150 μM 5-FU, or 10 nM Dx for 3 days. Paraffin sections of T47DT cells were stained by dual IHC for CK5 (green) and cleaved caspase 3 (cl. casp 3, red), and counterstained with DAPI. Representative T47DT colonies are depicted in Fig. 4a. Few (<1%) cells stained positive for cl. caspase 3 in control colonies (CK5− or CK5+) whereas in 5-FU-treated colonies, approximately one quarter of cells were positive for cl. caspase 3. Note that peripheral CK5+ cells lack cl. caspase 3 (arrows). More than twenty colonies were scored for each treatment group, and data were graphed as the total number of CK5− and CK5+ cells that were also cl. caspase 3+ (Fig. 4b). There was no statistical difference in cl. caspase 3 staining between CK5− and CK5+ cells in control T47DT colonies (2.0 and 0.0%, respectively). In 5-FU-treated T47DT colonies, 22.5% of CK5− compared to 8.3% of CK5+ cells were cl. caspase 3 positive (P < 0.01 t test). In Dx-treated T47DT colonies, 30.3% of CK5− cells compared to 9.5% of CK5+ cells were cl. caspase 3+ (P < 0.001 t test). CK5+ cells induced by P treatment of T47D cells were also less apoptotic than CK5− cells when challenged with 5-FU (26.7% vs. 1.4%, P < 0.001). For MCF7 cells cleaved PARP was used as the apoptotic marker. CK5+ cells in 5-FU-treated MCF7 cultures were significantly less cl. PARP+ compared to CK5− cells (0.0 vs. 20.0%, P < 0.0001, t test). These data confirm that CK5+ cells in luminal breast cancer cell cultures are less sensitive to chemotherapy agents than surrounding CK5− cells, potentially due to their slower proliferation rate and/or less uptake of the drugs. Furthermore, the population of CK5+ cells (i) in cultures isolated from tumors, and (ii) induced by P treatment are equally resistant to these drugs, suggesting the two populations are likely the same.
Fig. 4.
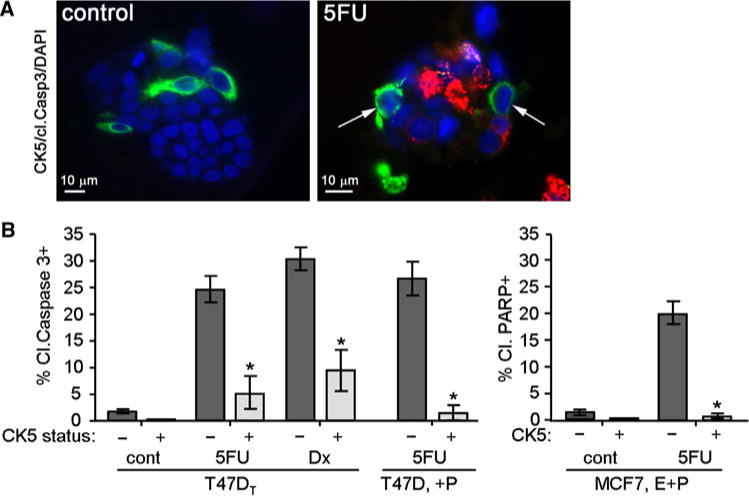
CK5+ cells resist chemotherapy induced apoptosis compared to CK5− cells in luminal breast cancer cell lines. T47DT, T47D (not derived from xenograft tumors), and MCF7 cells were plated into 3D Matrigel culture. T47D and MCF7 cells were treated with 100 nM MPA (+P) or 10 nM E + 100 nM MPA (E + P), respectively, for 24 h prior to drug treatments to induce CK5+ cells. Cells were treated with vehicle (control), 150 μM 5-FU, or 10 nM Dx for 3 days. a Representative immunostains of control or 5-FU-treated T47DT colonies immunostained for CK5 (green), cleaved caspase 3 (red), and DAPI (blue). Arrows mark CK5+/cleaved caspase 3− cells. b Graphs indicate the total percent of CK5+ and CK5− cells that stained negative or positive for cleaved caspase 3 in control, 5-FU, and Dx-treated T47DT cultures (n = 20), and in 5-FU-treated T47D/(+P) cultures (n = 10). The far graph indicates the total percent of CK5+ and CK5− cells that stained negative or positive for cleaved PARP in MCF7/(E + P) cells treated with vehicle (cont) or 5-FU (n = 10). * P < 0.0001, t tests comparing CK5+ versus CK5− for each treatment. (Color figure online)
A parallel decrease in ER and increase in CK5 protein levels in T47DT cells treated with endocrine therapy agents
We postulated that the ER−PR− status of CK5+ cells would also make them less sensitive to endocrine therapy drugs targeting the estrogen/ER-dependent growth of tumor cells. To test this, T47DT cells were plated into phenol red-free, charcoal-stripped media containing vehicle (estrogen withdrawal (EWD)), 10 nM E, E + 100 nM Tam, or E + 100 nM ICI-182780. After 3 weeks of treatment, whole cell extracts were prepared from cells and separated by SDS-PAGE. Immunoblots were probed with antibodies to ER, CK5, and β-actin (Fig. 5a). In E-treated cultures, ER was clearly present while CK5 expression was extremely low. Under EWD conditions (to mimic aromatase inhibitor (AI) therapy), ER protein levels decreased 2.7-fold, and CK5 protein levels increased 3.2-fold. Addition of Tam or ICI-82780 to E abrogated the effect of the estrogen. In these samples, ER protein levels decreased 2.3- and 3.4-fold, while CK5 protein levels increased 2.4- and 3.4-fold. PR protein levels were also decreased (not shown). These data suggest that endocrine therapy of luminal breast cancer cells increases a ER−PR−CK5+ subpopulation while decreasing the ER+PR+CK5− population. To assess ER levels in chemotherapy-treated cells, T47DT cells in 2D culture were treated with 5-FU as described, and whole cell extracts were prepared. Immunoblots were performed on extracts from control and 5-FU-treated cells, and probed with antibodies to ER or β-actin (Fig. 5b). ER protein is present in control cells, but is reduced ~threefold in 5-FU-treated cultures.
Fig. 5.
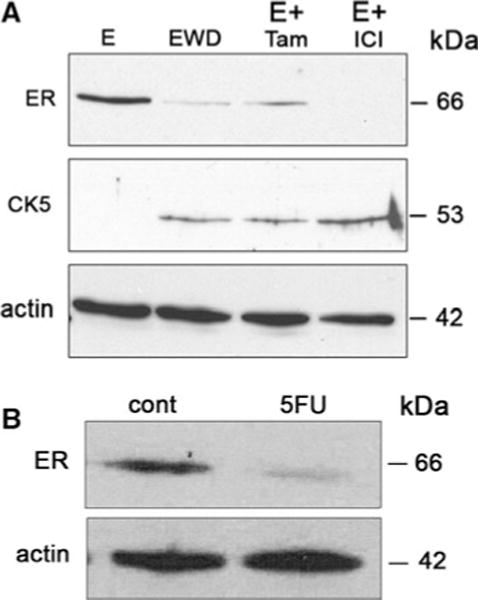
Loss of ER and gain of CK5 expression in T47DT cells following endocrine therapy treatments. a T47DT cells were maintained for 3 weeks in estrogen depleted media supplemented with 10 nM 17β-estradiol (E), no hormone (EWD), 10 nM E + 100 nM Tam (E + Tam), or 10 nM E + 100 nM ICI-182780 (E + ICI). Cells extracts were separated by SDS-PAGE and immunoblots probed with antibodies to ER, CK5, and β-actin (actin). b T47DT cells were plated in 2D culture and treated with control or 150 μM 5-FU for 3 days. Immunoblots of extracts from control (cont) or 5-FU-treated cultures were probed for ER (top) and β-actin (actin, bottom)
Loss of ER and gain of CK5 expression in ER+ tumors from patients treated with neoadjuvant endocrine therapy
To determine if the observed decrease in ER and increase in CK5 expression occurs in clinical samples, we performed analysis on a small set of tumor samples obtained from a phase II study of neoadjuvant exemestane (AI) with or without tamoxifen (described in [24]). Patients with ER+ breast cancers (defined by the presence of ≥10% ER+ cells by IHC and computational analysis) are recruited for this trial. Microarray expression analyses on six pairs of samples pre- and post-treatment were previously reported [24]. We extracted normalized expression data for specific probe sets of interest (CK5, ER) from the microarray database and graphed these as mean expression levels pre-and post-treatment (six samples each) (Fig. 6c). These were not clustered into treatment type (AI, or AI + Tam) or responders/non-responders for this study, because of the small sample size. The gene probes for ER (ESR1) decreased significantly from normalized levels of 56.7 ± 17.2 in pre-treatment tumors to 18.3 ± 5.3 in post-treatment tumors (paired t test, P < 0.05). The gene probes for CK5 (KRT5) increased significantly from 8.9 ± 3.8 in pre-treatment tumors, to 20.8 ± 5.2 in post-treatment tumors (paired t test, P < 0.05). Primary pre-treatment ER+ tumors varied in PR status. Collectively, expression of the gene for PR tended towards a decrease between pre-and post-treatment samples, but was not significant (not shown). Paraffin sections from the six sets of tumors (pre-and post-treatment) were stained by IHC for CK5 (Fig. 6a, two pairs shown). Pre-treatment tumors contained rare single CK5+ cells, while post-treatment tumors had patches of CK5+ cells. Sections were scored for the average number of CK5+ cells/field across each biopsy and are plotted in Fig. 6b. The average number of CK5+ cells/field increased in post-treatment samples (30.4 ± 11.3) compared to pre-treatment (2.6 ± 2.0) samples (paired t test, P < 0.05). These data corroborate the in vitro cell line data, demonstrating that a simultaneous decrease in ER and increase in CK5 expression occurs in ER+ tumors undergoing neoadjuvant endocrine therapy. We conclude that while ER+ cells are reduced in number by endocrine therapy, the ER-CK5+ cells are immune to ER targeted therapies, and would survive to repopulate the tumor.
Fig. 6.
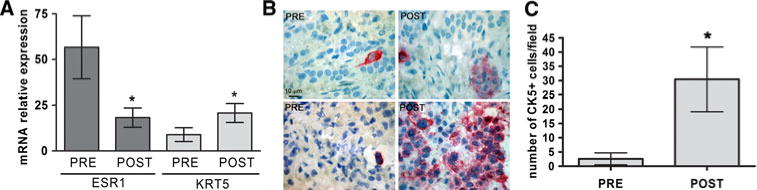
ER+ breast tumors from patients treated with neoadjuvant endocrine therapy have increased CK5 and decreased ER expression in post- versus pre-treatment samples. Patients with ER+ tumors from a phase II clinical trial were treated with neoadjuvant tamoxifen plus/minus exemestane for 4 months. Tumor samples were collected pre-and post-treatment. a mRNA levels for the genes encoding ER (ESR1) and CK5 (KRT5) were compared from published microarray data sets from these tumors (n = 6 pairs) [24]. Normalized expression levels plus/minus SEM are depicted. * P < 0.05, paired t test. b Sections from pre- and post-treatment tumors were immunostained for CK5 (n = 6 pairs). Two representative sections each of pre- and post- treatment tumors are shown. c Sections were scored for CK5 staining and plotted as number of cells per field plus/minus SEM (n = 6 pairs). * P < 0.05, paired t test
Discussion
Resistance to hormonal and conventional therapies remains a critical problem for patients with ER+ breast cancers. Most studies have focused on de novo or acquired resistance of the majority ER+ cells in these tumors. In this study, we demonstrate that a population of cells within luminal ER+ breast cancers that lack ER and PR, and express CK5 resists treatment with endocrine and chemotherapies. These ER−PR−CK5+ cells are a subpopulation of the CD44+CD24−/low TIC fraction and may represent a more specific marker of drug resistant cells in luminal disease. At first glance these cells appear phenotypically similar to those found in aggressive basal breast tumors, which are also steroid receptor negative, CK5+, and are enriched in CD44+CD24−/low cells [14, 25]. These basal tumors have a higher pathologic grade and proliferative index, and their initial response to chemotherapy is actually more robust than the response of luminal, ER+ tumors [26]. One might therefore expect the ER−CK5+ cell population within luminal cancers to have a similar response to chemotherapy. In this study, however, we present data that the CK5+ cells in luminal tumors are actually more quiescent than the ER+ cells and are significantly less sensitive to chemotherapies. Therefore, the ER−CK5+ cell subpopulation in luminal disease appears to be quite distinct from the CK5+ cells observed in aggressive basal breast cancers. These luminal harbored ER−CK5+ cells may act more like progenitors, remaining relatively quiescent until mobilized to repopulate the tumor. Clinically, we have a poor understanding of the ER− subpopulations in luminal breast cancers, viewing these populations as bystanders without a “drugable target”. The extent that patients benefit from anti-endocrine and conventional therapies may be mitigated in part by the responsiveness or lack thereof, of the remaining ER− cell subpopulations.
Expression of basal or stratified CKs (CKs 5/6, 14, 17) is associated with poor prognosis relative to tumors expressing luminal CKs (CKs 7/8, 18, 19) [27–29]. Interestingly, Abd El-Rehim et al. [27] described a set of tumors with combined luminal and basal CK markers that had worse prognosis than tumors expressing pure luminal CKs. CK5/6 alone was shown to be an independent indicator of relapse-free survival [27]. Furthermore, CK5 expression can divide TNP tumors into those with more (CK5−) or less favorable (CK5+ “basal”) prognoses [25]. Our data support the hypothesis that many ER+ tumors (>50%) have a mixed luminal and basal CK profile. This phenotype translates to many commonly studied ER+PR+ breast cancer cell lines (T47D, MCF7, ZR75-1, BT474), especially when they are grown as solid tumor xenografts in vivo. We have also demonstrated that hormonal signals, specifically progestin treatment, increases the number of CK5+ cells both in vitro and in xenograft tumors [18, 23]. Here, we use cells directly isolated from tumors that harbor a constitutive CK5+ population, and demonstrate that the CK5+ cells preferentially survive endocrine and chemotherapies. Microarray expression analyses and IHC confirm that the luminal located CK5+ cells co-express other basal CKs such as 6 and 17 [18]. These data provide a plausible explanation as to why luminal tumors with a mixed luminal/basal CK phenotype have poorer outcome.
Biological explanations for endocrine resistance in up to one-third of ER+ breast tumors continue to be sought [4]. ER+ cells can bypass dependency on ER signaling, and use alternate growth factor signaling pathways for survival [4]. A fraction of ER+ tumors (20–30%) will progressively lose expression of ER and assume a more untreatable de-differentiated phenotype [30, 31]. Of note is the fact that luminal ER+ tumors acquire the CD44+CD24−/low phenotype following letrozole or docetaxel treatment [32]. EGFR and HER2 expression are also upregulated following endocrine therapies, with down regulation of ER and estrogen-responsive genes [33, 34]. This is consistent with our data, where CK5+ cells, which co-express EGFR+ and CD44+, are enriched following endocrine treatments. We put forward that in ER+ luminal tumors, the ER−PR−CK5+ subpopulation expands during treatment as a means of survival. In the normal breast, ER− cells are stimulated to divide via a paracrine mechanism from surrounding quiescent ER+ cells [35]. In breast tumors, the transformed ER+ cells themselves are proliferative, and may signal ER− cells to divide under stress such as therapies. While loss of ER immediately following treatment is predictable, approximately 70–80% of ER+ primary tumors retain ER expression at later recurrence and in asynchronous metastases [36, 37]. This suggests that some ER−CK5+ cells regain expression of ER, or that the ER−CK5+ cells act as progenitors and spawn rapidly dividing ER+ progeny.
In summary, CK5+ cells in luminal tumors may survive chemotherapy by remaining relatively quiescent, and avoid ER targeted therapies by virtue of their ER negativity. We speculate that a subset of luminal ER+ tumors with preexisting CK5+ cells will be inherently more difficult to treat. The basal CK5, 6, and 17 expressing cells in these tumors have a tumor initiating phenotype (CD44+CD24−/lowEGFR+), indicative of drug resistance. Within luminal tumors, the ER+ and CK5+ cell populations have distinct gene expression signatures and activated pathways [18], providing an avenue to seek compounds that effectively block these cells. Novel agents that block TICs are under development, and have had some success in pre-clinical experiments [38]. Specific compounds that target the ER−PR−CK5+ subpopulation have potential to improve the outcome of luminal breast cancers with a mixed ER+/CK5+ phenotype.
Acknowledgments
This work was supported by grants from the American Society of Clinical Oncology YIA-PN200810-161 (P. Kabos), National Institutes of Health 1 F32 CA142096-01 (J.M. Haughian), Martha Cannon Dear Professorship (A. Elias), National Institutes of Health R01 CA26869 (K.B. Horwitz), Breast Cancer Research Foundation (K.B. Horwitz), the National Foundation for Cancer Research (K.B. Horwitz), The Avon Foundation (K.B. Horwitz), The Avon Foundation (C.A. Sartorius), and the University of Colorado Cancer Center (C.A. Sartorius).
Abbreviations
- AI
Aromatase inhibitor
- ALDH1
Aldehyde dehydrogenase 1
- BrdU
5-Bromo-2-deoxyuridine
- CK
Cytokeratin
- 2D
Two-dimensional
- 3D
Three dimensional
- DAPI
4′,6-Diamidino-2-phenylindole
- Dx
Docetaxel
- EGFR
Epidermal growth factor receptor
- ER
Estrogen receptor
- E
17β-estradiol
- ESA
Epithelial specific antigen
- EWD
Estrogen withdrawal
- FBS
Fetal bovine serum
- 5-FU
5-Fluorouracil
- HER2
Human epidermal growth factor receptor 2
- ICC
Immunocytochemistry
- IHC
Immunohistochemistry
- Lin
Lineage
- MPA
Medroxyprogesterone acetate
- PR
Progesterone receptor
- SOC
Sodium deoxycholate
- Tam
4-Hydroxytamoxifen
- TIC
Tumor initiating cell
- TNP
Triple negative phenotype
Footnotes
Conflicts of interest The authors have no conflicts of interest to disclose.
Contributor Information
Peter Kabos, Division of Medical Oncology, Department of Medicine, University of Colorado Anschutz Medical Campus, 12801 E 17th Ave, Aurora, CO 80045, USA.
James M. Haughian, Division of Endocrinology, Metabolism, and Diabetes, Department of Medicine, University of Colorado Anschutz Medical Campus, 12801 E 17th Ave, Aurora, CO 80045, USA
Xinshuo Wang, Division of Endocrinology, Metabolism, and Diabetes, Department of Medicine, University of Colorado Anschutz Medical Campus, 12801 E 17th Ave, Aurora, CO 80045, USA.
Wendy W. Dye, Division of Endocrinology, Metabolism, and Diabetes, Department of Medicine, University of Colorado Anschutz Medical Campus, 12801 E 17th Ave, Aurora, CO 80045, USA
Christina Finlayson, Department of Surgery, Department of Medicine, University of Colorado Anschutz Medical Campus, 12801 E 17th Ave, Aurora, CO 80045, USA.
Anthony Elias, Division of Medical Oncology, Department of Medicine, University of Colorado Anschutz Medical Campus, 12801 E 17th Ave, Aurora, CO 80045, USA.
Kathryn B. Horwitz, Division of Endocrinology, Metabolism, and Diabetes, Department of Medicine, University of Colorado Anschutz Medical Campus, 12801 E 17th Ave, Aurora, CO 80045, USA, Department of Pathology, University of Colorado Anschutz Medical Campus, 12801 E 17th Ave, Aurora, CO 80045, USA
Carol A. Sartorius, Email: Carol.Sartorius@ucdenver.edu, Division of Endocrinology, Metabolism, and Diabetes, Department of Medicine, University of Colorado Anschutz Medical Campus, 12801 E 17th Ave, Aurora, CO 80045, USA.
References
- 1.Cui X, Schiff R, Arpino G, et al. Biology of progesterone receptor loss in breast cancer and its implications for endocrine therapy. J Clin Oncol. 2005;23:7721–7735. doi: 10.1200/JCO.2005.09.004. [DOI] [PubMed] [Google Scholar]
- 2.Perou CM, Sorlie T, Eisen MB, et al. Molecular portraits of human breast tumours. Nature. 2000;406:747–752. doi: 10.1038/35021093. [DOI] [PubMed] [Google Scholar]
- 3.Paik S, Tang G, Shak S, et al. Gene expression and benefit of chemotherapy in women with node-negative, estrogen receptor-positive breast cancer. J Clin Oncol. 2006;24:3726–3734. doi: 10.1200/JCO.2005.04.7985. [DOI] [PubMed] [Google Scholar]
- 4.Osborne CK, Schiff R. Estrogen-receptor biology: continuing progress and therapeutic implications. J Clin Oncol. 2005;23:1616–1622. doi: 10.1200/JCO.2005.10.036. [DOI] [PubMed] [Google Scholar]
- 5.Dean M, Fojo T, Bates S. Tumour stem cells and drug resistance. Nat Rev Cancer. 2005;5:275–284. doi: 10.1038/nrc1590. [DOI] [PubMed] [Google Scholar]
- 6.Diehn M, Cho RW, Lobo NA, et al. Association of reactive oxygen species levels and radioresistance in cancer stem cells. Nature. 2009;458:780–783. doi: 10.1038/nature07733. [DOI] [PMC free article] [PubMed] [Google Scholar]
- 7.Al-Hajj M, Wicha MS, Benito-Hernandez A, et al. Prospective identification of tumorigenic breast cancer cells. Proc Natl Acad Sci USA. 2003;100:3983–3988. doi: 10.1073/pnas.0530291100. [DOI] [PMC free article] [PubMed] [Google Scholar]
- 8.Fillmore CM, Kuperwasser C. Human breast cancer cell lines contain stem-like cells that self-renew, give rise to phenotypically diverse progeny and survive chemotherapy. Breast Cancer Res. 2008;10:R25. doi: 10.1186/bcr1982. [DOI] [PMC free article] [PubMed] [Google Scholar]
- 9.Li X, Lewis MT, Huang J, et al. Intrinsic resistance of tumorigenic breast cancer cells to chemotherapy. J Natl Cancer Inst. 2008;100:672–679. doi: 10.1093/jnci/djn123. [DOI] [PubMed] [Google Scholar]
- 10.Phillips TM, McBride WH, Pajonk F. The response of cd24(−/low)/cd44+ breast cancer-initiating cells to radiation. J Natl Cancer Inst. 2006;98:1777–1785. doi: 10.1093/jnci/djj495. [DOI] [PubMed] [Google Scholar]
- 11.Liu R, Wang X, Chen GY, et al. The prognostic role of a gene signature from tumorigenic breast-cancer cells. N Engl J Med. 2007;356:217–226. doi: 10.1056/NEJMoa063994. [DOI] [PubMed] [Google Scholar]
- 12.Shipitsin M, Campbell LL, Argani P, et al. Molecular definition of breast tumor heterogeneity. Cancer Cell. 2007;11:259–273. doi: 10.1016/j.ccr.2007.01.013. [DOI] [PubMed] [Google Scholar]
- 13.Abraham BK, Fritz P, McClellan M, et al. Prevalence of cd44+/cd24−/low cells in breast cancer may not be associated with clinical outcome but may favor distant metastasis. Clin Cancer Res. 2005;11:1154–1159. [PubMed] [Google Scholar]
- 14.Honeth G, Bendahl PO, Ringner M, et al. The cd44+/cd24− phenotype is enriched in basal-like breast tumors. Breast Cancer Res. 2008;10:R53. doi: 10.1186/bcr2108. [DOI] [PMC free article] [PubMed] [Google Scholar]
- 15.Ginestier C, Hur MH, Charafe-Jauffret E, et al. Aldh1 is a marker of normal and malignant human mammary stem cells and a predictor of poor clinical outcome. Cell Stem Cell. 2007;1:555–567. doi: 10.1016/j.stem.2007.08.014. [DOI] [PMC free article] [PubMed] [Google Scholar]
- 16.Charafe-Jauffret E, Ginestier C, Iovino F, et al. Breast cancer cell lines contain functional cancer stem cells with metastatic capacity and a distinct molecular signature. Cancer Res. 2009;69:1302–1313. doi: 10.1158/0008-5472.CAN-08-2741. [DOI] [PMC free article] [PubMed] [Google Scholar]
- 17.O’Brien CS, Howell SJ, Farnie G, et al. Resistance to endocrine therapy: are breast cancer stem cells the culprits? J Mammary Gland Biol Neoplasia. 2009;14:45–54. doi: 10.1007/s10911-009-9115-y. [DOI] [PubMed] [Google Scholar]
- 18.Horwitz KB, Dye WW, Harrell JC, et al. Rare steroid receptor-negative basal-like tumorigenic cells in luminal subtype human breast cancer xenografts. Proc Natl Acad Sci USA. 2008;105:5774–5779. doi: 10.1073/pnas.0706216105. [DOI] [PMC free article] [PubMed] [Google Scholar]
- 19.Lim E, Vaillant F, Wu D, et al. Aberrant luminal progenitors as the candidate target population for basal tumor development in BRCA1 mutation carriers. Nat Med. 2009;15:907–913. doi: 10.1038/nm.2000. [DOI] [PubMed] [Google Scholar]
- 20.Boecker W, Buerger H. Evidence of progenitor cells of glandular and myoepithelial cell lineages in the human adult female breast epithelium: a new progenitor (adult stem) cell concept. Cell Prolif. 2003;36(Suppl 1):73–84. doi: 10.1046/j.1365-2184.36.s.1.7.x. [DOI] [PMC free article] [PubMed] [Google Scholar]
- 21.Boecker W, Moll R, Poremba C, et al. Common adult stem cells in the human breast give rise to glandular and myoepithelial cell lineages: a new cell biological concept. Lab Investig. 2002;82:737–746. doi: 10.1002/path.1241. [DOI] [PubMed] [Google Scholar]
- 22.Keydar I, Chen L, Karby S, et al. Establishment and characterization of a cell line of human breast carcinoma origin. Eur J Cancer. 1979;15:659–670. doi: 10.1016/0014-2964(79)90139-7. [DOI] [PubMed] [Google Scholar]
- 23.Sartorius CA, Harvell DM, Shen T, et al. Progestins initiate a luminal to myoepithelial switch in estrogen-dependent human breast tumors without altering growth. Cancer Res. 2005;65:9779–9788. doi: 10.1158/0008-5472.CAN-05-0505. [DOI] [PubMed] [Google Scholar]
- 24.Harvell DM, Spoelstra NS, Singh M, et al. Molecular signatures of neoadjuvant endocrine therapy for breast cancer: characteristics of response or intrinsic resistance. Breast Cancer Res Treat. 2008;112:475–488. doi: 10.1007/s10549-008-9897-4. [DOI] [PubMed] [Google Scholar]
- 25.Cheang MC, Voduc D, Bajdik C, et al. Basal-like breast cancer defined by five biomarkers has superior prognostic value than triple-negative phenotype. Clin Cancer Res. 2008;14:1368–1376. doi: 10.1158/1078-0432.CCR-07-1658. [DOI] [PubMed] [Google Scholar]
- 26.Hugh J, Hanson J, Cheang MC, et al. Breast cancer subtypes and response to docetaxel in node-positive breast cancer: use of an immunohistochemical definition in the bcirg 001 trial. J Clin Oncol. 2009;27:1168–1176. doi: 10.1200/JCO.2008.18.1024. [DOI] [PMC free article] [PubMed] [Google Scholar]
- 27.Abd El-Rehim DM, Pinder SE, Paish CE, et al. Expression of luminal and basal cytokeratins in human breast carcinoma. J Pathol. 2004;203:661–671. doi: 10.1002/path.1559. [DOI] [PubMed] [Google Scholar]
- 28.Malzahn K, Mitze M, Thoenes M, et al. Biological and prognostic significance of stratified epithelial cytokeratins in infiltrating ductal breast carcinomas. Virchows Arch. 1998;433:119–129. doi: 10.1007/s004280050226. [DOI] [PubMed] [Google Scholar]
- 29.van de Rijn M, Perou CM, Tibshirani R, et al. Expression of cytokeratins 17 and 5 identifies a group of breast carcinomas with poor clinical outcome. Am J Pathol. 2002;161:1991–1996. doi: 10.1016/S0002-9440(10)64476-8. [DOI] [PMC free article] [PubMed] [Google Scholar]
- 30.Kuukasjarvi T, Kononen J, Helin H, et al. Loss of estrogen receptor in recurrent breast cancer is associated with poor response to endocrine therapy. J Clin Oncol. 1996;14:2584–2589. doi: 10.1200/JCO.1996.14.9.2584. [DOI] [PubMed] [Google Scholar]
- 31.Spataro V, Price K, Goldhirsch A, et al. Sequential estrogen receptor determinations from primary breast cancer and at relapse: prognostic and therapeutic relevance. The international breast cancer study group (formerly Ludwig group) Ann Oncol. 1992;3:733–740. doi: 10.1093/oxfordjournals.annonc.a058330. [DOI] [PubMed] [Google Scholar]
- 32.Creighton CJ, Li X, Landis M, et al. Residual breast cancers after conventional therapy display mesenchymal as well as tumor-initiating features. Proc Natl Acad Sci USA. 2009;106:13820–13825. doi: 10.1073/pnas.0905718106. [DOI] [PMC free article] [PubMed] [Google Scholar]
- 33.Creighton CJ, Massarweh S, Huang S, et al. Development of resistance to targeted therapies transforms the clinically associated molecular profile subtype of breast tumor xenografts. Cancer Res. 2008;68:7493–7501. doi: 10.1158/0008-5472.CAN-08-1404. [DOI] [PMC free article] [PubMed] [Google Scholar]
- 34.Massarweh S, Osborne CK, Creighton CJ, et al. Tamoxifen resistance in breast tumors is driven by growth factor receptor signaling with repression of classic estrogen receptor genomic function. Cancer Res. 2008;68:826–833. doi: 10.1158/0008-5472.CAN-07-2707. [DOI] [PubMed] [Google Scholar]
- 35.Clarke RB, Howell A, Potten CS, et al. Dissociation between steroid receptor expression and cell proliferation in the human breast. Cancer Res. 1997;57:4987–4991. [PubMed] [Google Scholar]
- 36.Liedtke C, Broglio K, Moulder S, et al. Prognostic impact of discordance between triple-receptor measurements in primary and recurrent breast cancer. Ann Oncol. 2009;20:1953–1958. doi: 10.1093/annonc/mdp263. [DOI] [PMC free article] [PubMed] [Google Scholar]
- 37.Guarneri V, Giovannelli S, Ficarra G, et al. Comparison of her-2 and hormone receptor expression in primary breast cancers and asynchronous paired metastases: impact on patient management. Oncologist. 2008;13:838–844. doi: 10.1634/theoncologist.2008-0048. [DOI] [PubMed] [Google Scholar]
- 38.Gupta PB, Onder TT, Jiang G, et al. Identification of selective inhibitors of cancer stem cells by high-throughput screening. Cell. 2009;138:645–659. doi: 10.1016/j.cell.2009.06.034. [DOI] [PMC free article] [PubMed] [Google Scholar]