Abstract
We describe the incorporation of non-uniform sampling (NUS) compressed sensing (CS) into Oriented Sample (OS) Solid-state NMR for stationary aligned samples and Magic Angle Spinning (MAS) Solid-state NMR for unoriented ‘powder’ samples Both simulated and experimental results indicate that 25% to 33% of a full linearly sampled data set is required to reconstruct two-and three-dimensional solid-state NMR spectra with high fidelity. A modest increase in signal-to-noise ratio is accompanies the reconstruction.
Introduction
NMR spectroscopy has intrinsically low sensitivity. As a result, long periods (days – weeks) of signal averaging are often required to obtain signals in multidimensional experiments on proteins and other biopolymers that can be confidently identified above the noise level. However, progress is being made along several avenues to improve the sensitivity of the NMR experiments and decrease the amount of time required for signal averaging, including the use of very low probe and sample temperatures[1], dynamic nuclear polarization (DNP)[2; 3], and shortening the recycle delay by reducing T1 of the detected magnetization[4]. However, these approaches may be inapplicable to some samples, especially proteins and their complexes, because of the destabilizing and denaturing effects of adding chemicals or freezing the samples. For example, membrane proteins must reside in liquid crystalline phospholipids under physiological conditions of temperature and pH in order to function and adopt their native structures. Alternatively, several spectroscopic approaches generally referred to as non-uniform sampling (NUS) are being developed to improve sensitivity that do not require perturbation of the sample or its environment [5].
The most general approach to increasing the efficiency of NMR experiments is to acquire less data. Either lengthening the sampling interval or truncating the acquisition time in the indirect dimensions can reduce the experimental time, but at the cost of lower resolution or aliasing of signals. Here we describe a NUS scheme that consists of random sampling grids that can minimize these disadvantages for applications to solid-state NMR of stationary, aligned samples as well as unoriented ‘powder’ samples undergoing magic angle spinning. The archetypical examples are single-and poly-crystalline samples of small molecules, such as model peptides. However, our primary motivation is to improve the sensitivity of structure determination proteins in biological supramolecular assemblies, such as virus particles and membranes using orientated samples (OS) solid-state NMR and rotationally aligned (RA) solid-state NMR, which involve stationary and spinning experiments, respectively.
The free induction decays (FIDs) are the directly or indirectly observed time dependent signals that decrease in intensity over time due to relaxation. Traditionally, the intensities in the form of voltages at audio frequencies are measured at regular intervals in order to accommodate the requirements of the fast Fourier transform algorithm, which enables the analysis of signals in the frequency domain instead of the time domain where they are acquired. The most commonly used approach to reducing the number of data points collected in the indirect dimension of a multidimensional experiment is to perform uniformly distributed random sampling, for example under-sampling the signal in the indirect dimensions and reconstructing the spectra by numerical methods. Linear prediction (LP)[6] and maximum entropy (MaxEnt)[7–10] are widely applied to multi-dimensional NMR signal reconstructions, and recently maximum entropy interpolation (MINT)[11; 12] has been applied successfully in MAS solid-state NMR experiments. LP extrapolation is applicable when the signal-to-noise ratio is high or the signals are not highly truncated, otherwise the signal processing creates artifacts or decreases resolution[9]. To avoid these issues and provide high quality reconstructions, NUS and MaxEnt or MINT can be combined. Other approaches are proposed to reconstruct the spectra without using entropy as constraint, such as, projection-reconstruction (PR)[13; 14], multi-dimensional decomposition (MDD)[15; 16], GFT[17], non-uniform Fourier transformation (nu-FT)[18], spectroscopy by integration of frequency and time domain information (SIFT)[19–21], among others. Compressed sensing (CS) [22–24], a method under rapid development in the fields of imaging and signal reconstruction, has been successfully applied to MRI [25; 26]. Recent applications of CS in solution NMR experiments [27–31] have shown that it requires less data than MaxEnt for comparable results, and has better performance on weak signals [28]. Remarkably, this method has been used to reconstruct three-and four-dimensional solution NMR data sets with only 0.8% sampling [31]. The underlying principle of CS is that if the data set is sparse enough, then very limited information is sufficient to reconstruct the whole data set with high fidelity. Consequently CS is well suited for NMR spectroscopy because experimental NMR data can be treated as sparse, although there are significant quantitative differences between the data from solution NMR and solid-state NMR experiments. Here we describe the adaptation and steps towards optimization of CS for the stationary sample and MAS solid-state NMR.
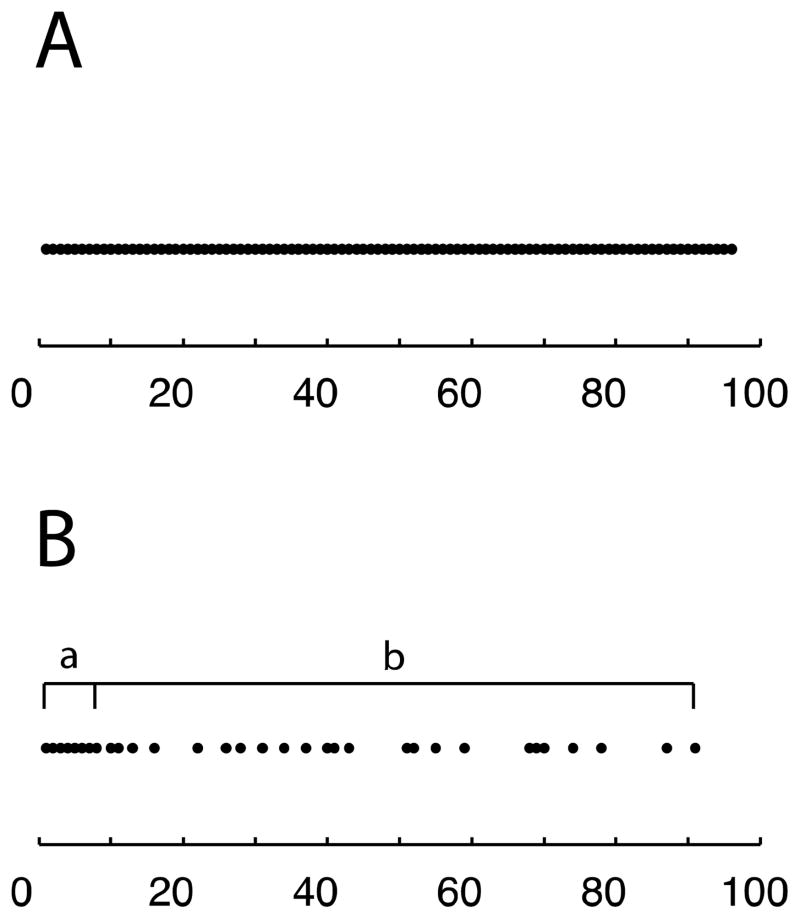
Non-uniformly distributed data sampling has several advantages. First of all, it can be tailored to emphasize the early, more intense portion of the FIDs, where the signal-to-noise ratios are the highest. Several schemes have been proposed for solution NMR conditions [32–36]. Even though these methods are robust, they still have higher risks of distortions for sampling the signals in solid-state NMR experiments due to the generally faster signal decay in the time domain. Among these methods, the sine-weighted Poisson-gap sampling method[34] appears to be closest to the requirements for solid-state NMR. Here we demonstrate the effects of varying the most relevant parameters, such as the sampling percentage, uniform sampling region, and the exponential decay weighting function in order to tailor the NUS schemes for solid-state NMR experiments [36]. Sampling percentage refers to the ratio of non-uniformly sampled points (Figure 1B) to the uniformly sampled points (Figure 1A). The uniform sampling region is set in the beginning of the free induction decays. An exponential decay weighting function modulates the random sampling in order to minimize sampling the low signal-to-noise ratio region, as shown in Fig. 1B. We optimized the NUS schemes for oriented samples, such as single crystals of model peptides and magnetically aligned proteins, and then extended the schemes to unoriented ‘powder’ samples of model proteins and proteins undergoing magic angle spinning.
Figure 1.
Illustrations of sampling schemes. A. Uniform sampling scheme (regular experiments). B. Non-uniform sampling (NUS) scheme consisted by a. the uniform sampling region and b. the sampling region that the sampling probabilities are modulated by an exponential decay weighting function.
A sparse data set refers to the situation where only a few basis functions have non-zero coefficients in a defined space. Under this condition, it is possible to use only a small amount of information to reconstruct the entire data set; therefore, the concept is referred to as compressed sensing[23]. Theoretically, using l0 norm minimization it is feasible to find the sparest solution (the original data) subjected to the constraints (the limited information obtained). However, l0 norm minimization is a NP-hard (non-deterministic polynomial-time hard) problem, which means that the upper bound of computational time is the polynomial expression of the size of input; as a result, it is not possible to solve this problem efficiently. Instead, l1 norm minimization is used to obtain an approximation of the solution. By applying Fourier transformation to these data, high-resolution spectra can be obtained from sparse data.
Based on the properties of NMR signals, we can solve the minimization problem by using a Lagrange multiplier, as shown in Equation (1).
| (1) |
F is the discrete Fourier transform operator; S is the under sampling operator; w is the weighting; x is the solution, y is the observation, and λ is Lagrange multiplier. In terms of NMR spectroscopy, y is the FID measured in the time domain, x is the reconstructed signal in the frequency domain, S is the NUS scheme, and w is the decay rates of the signals. w should be estimated from the knowledge, and the NUS schemes are generated with the same conditions. Since the reconstructed space is larger than the sampling space, the under sampling operator is applied first so that both dimensions are in agreement, as shown in the first term in Equation (1). Iterative soft thresholding (IST)[22; 24] is applied to efficiently solve this minimization problem. The thresholding is adjusted during each iteration, and only signals with intensities higher than the thresholding are included in the reconstruction.
Results
Compressed sensing was originally developed for sparse data. It is highly effective with solution NMR spectra because the resonance line widths are often <20 Hz and spread over a range of ~10 kHz. In contrast, in solid-state NMR spectra, individual signals and the dipolar doublets generated in separated local field experiments usually have much broader line widths, between 200 Hz and 400 Hz, spread over a similar frequency range.
We randomly generated one-dimensional FIDs from five or ten frequencies. Each example consisted of forty different FIDs with a decay rate corresponding to 400 Hz ± 100 Hz line widths of signals observed in solid-state NMR spectra. These decay rates correspond to typical sold-state NMR signals, and once CS is demonstrated to work under these conditions it is likely to work with narrower line width signals (sparser data) obtained with improved experiments and instrumentation, and in favorable cases. The FIDs consist of 128 points with a dwell time of 40 μs. Various amplitudes of noises were added to each FID. In addition to a noiseless spectrum, we obtained spectra with signal-to-noise ratios of 32, 16, 8, 4 and 2. Fifty NUS schemes were randomly generated under each set of conditions, which were varied by the parameters listed above. Sampling percentages of 50%, 33%, 25%, 20%, 15%, and 10% were applied to the 128 points in the time domain. The uniform sampling regions were 75%, 50%, 25%, 10%, and 0% of the sampling size. The exponential decay rates of the weighting functions were chosen to be 1, 2, 3, 4 and 5-times the decay rates of original FID. Taken together a very large number of tests were performed in this semi-empirical analysis; 150 NUS schemes with different parameters were randomly generated fifty times, and were applied to eighty spectra with six different signal-to-noise ratios. We evaluated the performance of reconstructions by l2 norm (L2) as indicated in equation (2) [36],
| (2) |
where yi and xi are the intensities in the noiseless and reconstructed spectra respectively at the frequency i.
The forty simulated spectra that were generated were used to evaluate the overall performance of each NUS scheme. The averaging of L2 was determined by comparing the noiseless and reconstructed spectra (Figure 2A). Since the primary goal of this development is to reduce the experimental time while preserving the quality of the experimental data, we first investigated the percentage of under-sampling that could be tolerated by CS with solid-state NMR signals. The probability of the random sampling is modulated by an exponential decay function with the decay rate of 400 Hz. The relationships between sampling percentages under different signal-to-noise ratios in terms of L2 are shown in Figure 2A. The trends of L2 rising with decreasing sampling percentage were observed for spectra with signal-to-noise signal ratios > 4. As expected, larger errors were apparent when the signals were generated with fewer restraints. The results suggest that to obtain a reliable reconstruction, the lowest signal-to-noise ratio that is viable is ~ 10. The growth rates of L2 are faster when the sampling percentage is < 20%, suggesting that to maintain the quality of reconstructions, at least 20% of the original data is needed. These results have been confirmed under other spectroscopic conditions where most reconstructions were performed with at least 20% of the full data set [27; 28].
Figure 2.
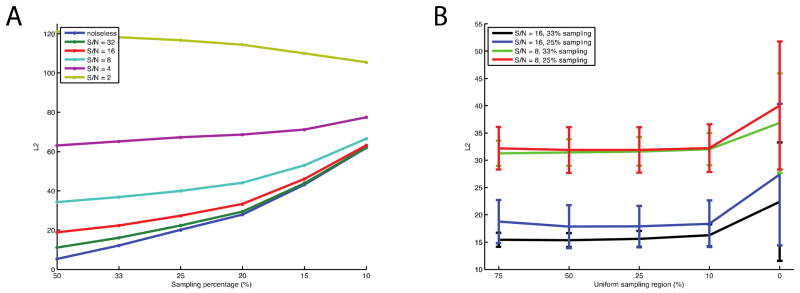
The values shown in the figure are the averages of every fifty NUS schemes generated by different conditions that are applied to the simulated spectra. Lower L2 values indicate higher similarities between the reconstructed and noiseless spectra. A. The qualities of reconstructions with various sampling percentages under different signal to noise ratios. It shows that the reconstructions have similar tendencies to the ideal signal if the signals have signal-to-noise ratio ~10, and the errors of reconstructions increase much faster if the sampling percentage lower than 20%. B. The qualities of reconstruction by adding uniform sampling region for 33% and 25% sampling. The reconstructions are improved by adding for 10% to 25% uniform sampling region. The error bars indicate the standard deviations of L2, which are significantly improved by introducing uniform sampling region, implying the qualities reconstructions are more stable. Lagrange multiplier is 0.05 for reconstructing the simulated signals.
The performance of NUS schemes is improved by incorporating a uniform sampling region at the beginning of the FID because this is where the signal-to-noise ratios are highest. The first few points are especially important, especially when the total number of sampled points is very limited. The uniform sampling regions examined ranged from 0% to 75% of the sampled data, and this provides similar results to both “Poisson-Gap Sampling”[34] and “Non-uniform weighted sampling”[37]. Figure 2B shows that including 10% and 25% uniform sampling regions improves L2 by 10% to 20%. As the uniform region becomes a larger percentage of the data, the effect of its inclusion becomes similar to truncation, and the reconstructed spectra lose resolution, which is reflected in the case of 25% sampling with 75% uniform sampling region. The standard deviations of L2 were significantly reduced by the inclusion of the uniform region at the beginning of the FID, demonstrating that the stability of reconstructions is improved.
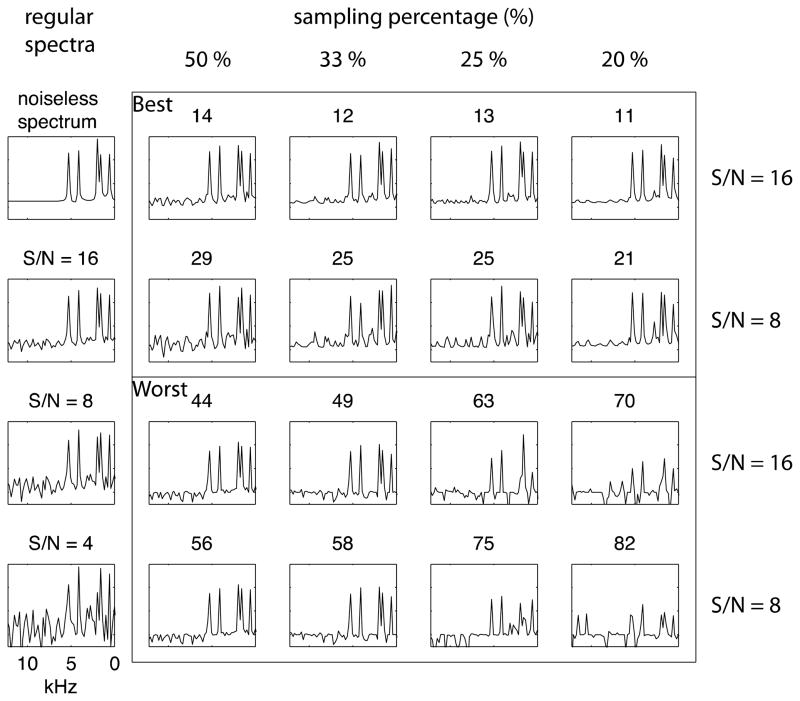
One of the simulated spectra and its “best” and “worst” reconstructed spectra are compared in Figure 3. In order to investigate the limits of this approach to NUS, we examined reconstructions of 25% sampling with 0%, 10%, 25%, and 50% uniform sampling region for the signals with signal-to-noise ratios equal to 16 and 8, as shown in Figure 3 based on the L2 behaviors shown in Figure 2B. From the analysis of L2, we find that 25% sampling and a signal-to-noise ratio of ~ 8 are about the minimums for reliable reconstructions, thus spectra obtained under these conditions are most sensitive to improvements due to variations in the sampling scheme. By adding the uniform sampling region, even the most difficult cases can be improved. The resolutions degrade slightly when the uniform sampling region increases, and, therefore, we find that 10% or 25% uniform sampling regions give the best results. Generally speaking, the signals can be identified with reasonable confidence, and the spectral resolution maintained even in the low frequency region (<2 kHz) in separated local field (SLF) spectra. Simulated spectra that would require the same amount of experimental time but have different signal-to-noise ratios are also provided for comparisons of the quality of reconstructed spectra.
Figure 3.
Best and worst reconstructed spectra of 25% sampling with 0% to 50% uniform sampling region on the spectra with signal to noise ratios equal 16 and 8. These spectra are chosen from fifty reconstructions of a selected simulated spectrum, and the criterion is based on L2, which is shown on each spectrum. The regular spectra shown in the left column for comparing the qualities of spectra acquired with the same amount of time. 25% sampling with signal to signal-to-noise ratio = 16 should be compared to the regular spectrum with signal-to-noise ratio = 8, and 25% sampling with signal to noise =8 should be compared to the regular spectrum with signal-to-noise ratio = 4. Most of the peaks can be reasonably identified after the improvement.
As is well known, the signal-to-noise ratios can be doubled by a four-fold increase of experimental time. Conversely, using one quarter of the experimental time gives one half of the signal-to-noise ratio. Therefore, we compare spectra with signal-to-noise ratios of 4, 8, and 16 obtained with uniform sampling to equivalent spectra obtained with between 8 % and 25% non-uniform sampling. The reconstructed spectra all have higher signal-to-noise ratios than the uniformly sampled spectra acquired in the same amount of experimental time. In addition, two-to five-fold increases in the decay rates from the weighting function were tested, but the reconstructions were not improved even with the addition of uniform sampling regions at the beginning of the FIDs.
Similar results were obtained with more crowded spectra (10 dipolar doublets with line widths of 400 ± 100 Hz span spread over +/− 10 kHz). We found the optimal conditions to correspond to 33% sampling with a 25% uniform sampling region at the beginning of the FID. However, 25% sampling is also adequate to provide reliable reconstructions. The same methods used to optimize the two-dimensional NUS schemes were applied to three-dimensional schemes. In practice, it generally takes too long to sample the whole space (Figure 4A) in these higher-dimensional experiments. Therefore, the typical strategy is to truncate the sampled space (Figure 4B) to 10% – 25% of the full space to perform the experiments within a reasonable amount of time, and then use LP to improve the resolution of the signals. Taking this into consideration, we designed the sampling percentage for two-dimensional NUS schemes based on the truncated space instead of the whole sampling space (Figure 4C). The optimized two-dimensional NUS schemes correspond to 25% – 33% sampling with 12.5% uniform sampling region over a 15% truncated space.
Figure 4.

Illustrations of two-dimensional sampling schemes A. Regular sampling scheme B. Truncated sampling scheme (10% of regular sampling scheme) C. NUS scheme (33% of truncated sampling scheme).
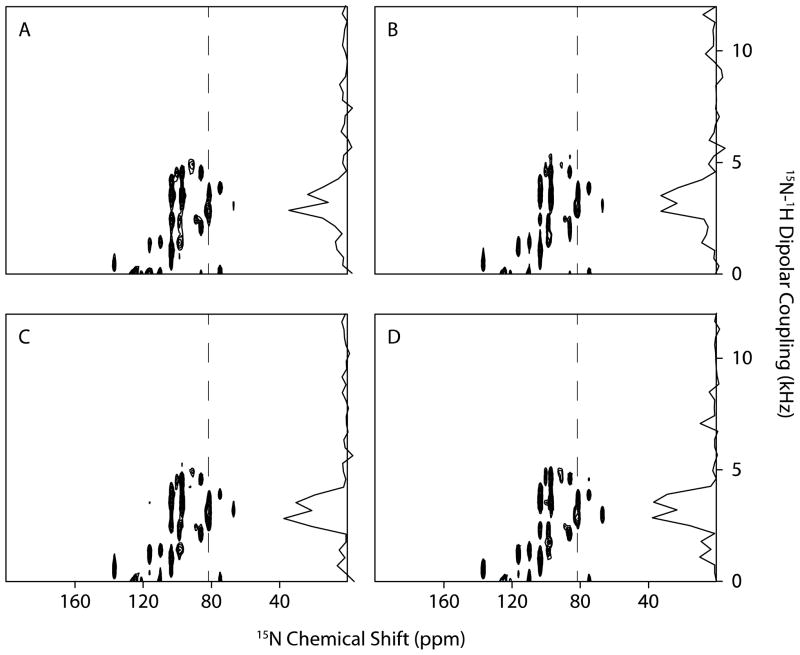
The optimization NUS schemes is illustrated with SLF spectra obtained using the SAMPI4 experiment on the membrane-bound form of uniformly 15N labeled Pf1 coat protein in DMPC (1,2-dimyristoyl-sn-glycero-3-phosphocholine) / DHPC (1,2-dihexanoyl-sn-glycero-3-phosphocholine) bicelles. The sensitivity (signal-to-noise ratio ~10) and line widths of spectra are similar to those in the simulations. The SLF spectrum was acquired with 80 t1 points, shown in Figure 5A, to which was applied Fourier transformation in the t1 dimension without additional processing. The reconstructions from 50%, 33%, and 25% NUS with a 20% uniform sampling region are shown in Figure 5B, C, and D, respectively. All the reconstructions yield well-resolved spectra, which suggests that the optimized NUS schemes are applicable to SLF experiments of membrane proteins in phospholipid bilayers.
Figure 5.
15N-detected SLF spectra of Pf1 protein in DHPC/DMPC bicelles. A. Fully sampled spectrum with 80 t1 points. Reconstructions from B. 50%, C. 33% and D. 25% sampling. Lagrange multiplier is 0.01. The slices are extracted from 81ppm.
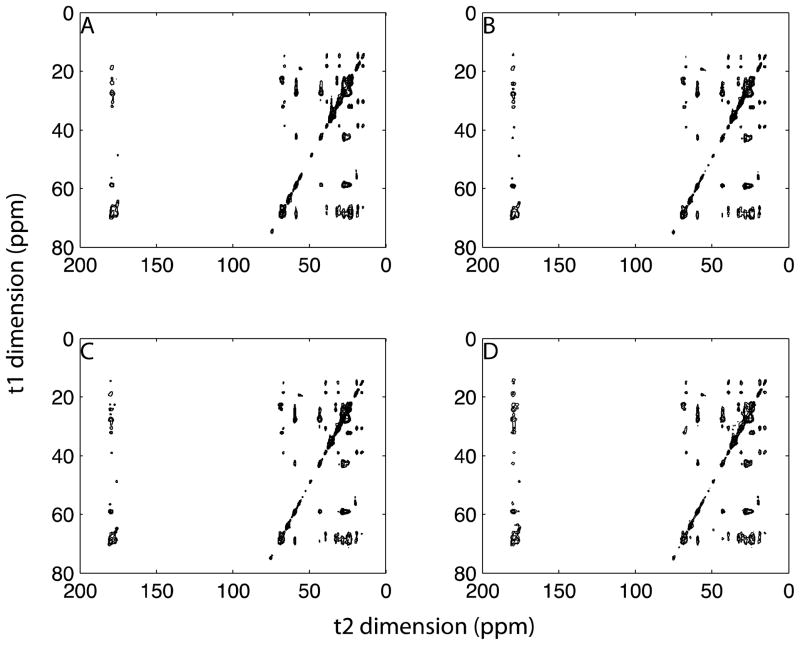
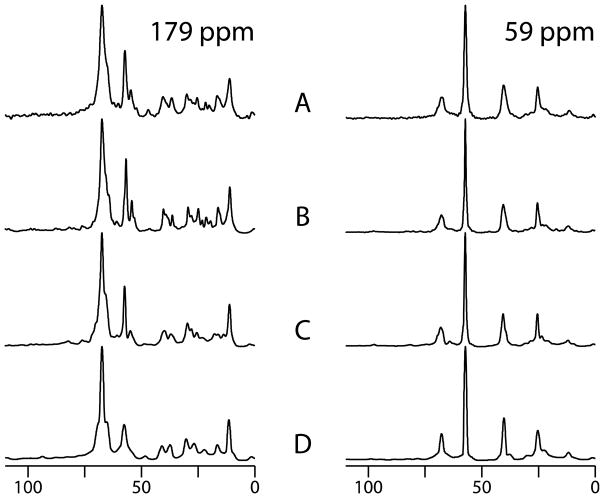
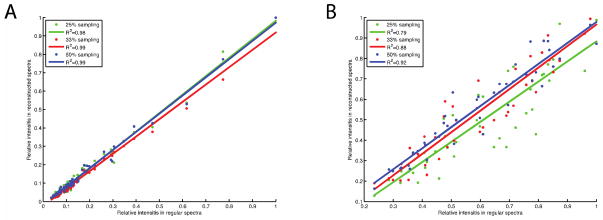
Using a 20% uniform sampling region, we demonstrated the application of NUS with two-dimensional 13C/13C correlation experiments on the membrane protein MerF in aligned bicelles. 96 t1 complex points were acquired in the conventional 13C/13C correlation experiment (Figure 6A) and 48, 32, and 24 t1 complex points were acquired in the NUS experiments, shown in Figure 6B, C, and D, respectively. No significant differences were observed between the regular and reconstructed spectra. We extracted spectral slices at 59 ppm and 179 ppm, which are representative of the Cα and CO spectral regions in Figure 7, where the strongest peaks are normalized. The signals are successfully reconstructed from the sparse region (59 ppm) with various sampling percentages. When the sampling percentage is < 25%, the line shapes are simplified, which may result in distortions. An advantage of using oriented sample solid-state NMR spectroscopy for protein structure determination is that it is based on frequency measurements, and line shape distortions or broadenings do not affect the results. For the crowded region (179 ppm), reconstructions from 50% data compare favorably with the regular signals and even provide improved signal-to-noise ratios [38]. However, fine structure of the signals is lost as the sampling percentage is reduced. These effects are caused by over-compression, which means that either the sampling percentage is too low or the information in a crowded region is too large to compress. To compare the reconstructed and regular spectra, we measured the intensities of 61 diagonal and cross peaks, and plot the correlations in Figure 8. The overall (diagonal and cross peaks) correlations show very high fidelity between reconstructed and regular spectra, which are insensitive to the sampling percentages. For the cross peaks, the high correlations (~0.9) are found with 33% and 50% sampling, but decrease to about 0.8 for 25% sampling. The average signal-to-noise ratios of cross peaks in 50%, 33%, and 25% sampling spectra are 1.48, 0.90, and 0.78, respectively, relative to the regular spectrum, which reflects the impact of T2 on the signal-to-noise ratios due to the relative increase in noise towards the end of the FIDs. First, the results are consistent with the sensitivity enhancement equation in that the maximum enhancement is achieved when the maximum acquisition (tmax) is 1.26T2 [38]. In this experiment T2 is about 3ms and tmax is 3.8ms for 50% sampling, and the largest enhancement is obtained under these conditions. A second way to evaluate the sensitivity of NUS schemes has been proposed according to the sampling points, spectral widths and T2 [39]. The “relative sensitivities” of these three sampling schemes (50%, 33%, and 25%) are 0.58, 0.46 and 0.38, and the “peak-to-side-lobe ratios” are 6.61, 5.13, and 5.97. Even though, the signal-to-noise ratios decrease slightly, the overall performance of the experiments is still improved when the savings in total experimental time is taken into account.
Figure 6.
Two-dimensional 13C/13C correlation spectra of MerF protein in 14-O-PC liposomes with 20ms mixing time. A. Fully sampling Fourier transform spectrum with 64 scans. Reconstructions from B. 50%, C. 33% and D. 25% sampling also with 64 scans. Lagrange multiplier is 0.03.
Figure 7.
Slices extracted from 59 ppm and 179 ppm in the t2 dimension of Fig. 5 showing the details of reconstructions: From the bottom to the top, regular experiment, reconstructions from 50%, 33%, and 25% respectively, where the strongest peaks are normalized. The average signal to noise ratios of cross peaks in 50%, 33%, and 25% sampling spectra are 1.48, 0.90, and 0.78 folds relative to the regular spectrum, respectively.
Figure 8.
Correlation plots of the intensities between regular and reconstructed spectra of Fig. 5. All the intensities are normalized to their own spectra. A. Correlation plots of diagonal and cross peaks. B. Correlation plots of cross peaks.
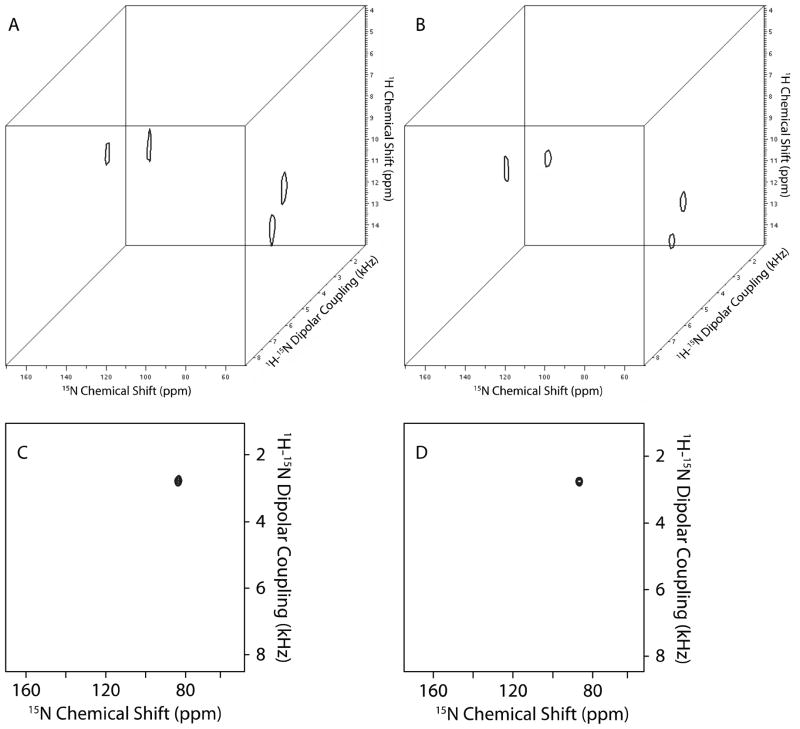
We also incorporated the NUS schemes described above into a three-dimensional HETCOR/SLF experiment[40], which provides correlations among 1H chemical shifts, 1H-15N dipolar couplings, and the 15N chemical shifts measured in the direct dimension. The conventional (Figure 9A and C) and NUS (Figure 9B and D) experiments are first demonstrated on a single crystal of 15N-labeled N-acetyl-leucine (NAL) at an arbitrary orientation. 20% of the sampling points (614 points) were selected based on the same rules as employed in the two-dimensional NUS schemes, and the size of the uniform sampling region is 20% of the selected sampling points. 20% NUS spectra show comparable results with the fully sampling spectra; however, compared to the performance in solution NMR experiments, there should be opportunities for further optimization [31] even for the broader line widths encountered in solid-state NMR spectra.
Figure 9.
Three-dimensional HETCOR-SAMMY spectrum and its reconstructed spectra of 15N-labeled NAL single crystal. A. Conventional three-dimensional HETCOR/SLF spectrum (32 t1 complex points, 96 t2 points). B. Reconstructed three-dimensional HETCOR/SLF spectrum 614 points (20%). C, and D. are the two-dimensional planes extracted from the 1H chemical shift at 12 ppm in A. and B., respectively. Lagrange multiplier is 0.01.
Discussion
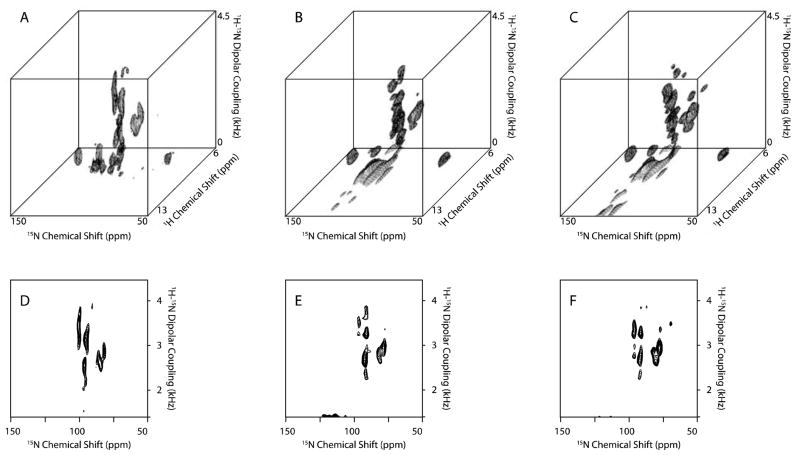
In practice, the usual strategy to efficiently obtain the data in multidimensional NMR experiments is to highly truncate the indirect dimensions, and then apply LP to recover some of the lost resolution. If necessary, further resolution is obtained by adding dimensions to the experiments; however, the line widths are sacrificed in order to acquire a three-or four-dimensional spectrum within a reasonable amount of time. We performed the NUS version of the experiment by sampling 33% of the full set of data points experiment in two ways: by reconstructing the spectrum with the same number of scans, which means we only utilize one-third of the experimental time required for the spectra shown in Figure 10B and E (40 scans, 4 s recycle delay); and by reconstructing the spectrum with three times the number of scans which means we utilize the same amount of the experimental time but each data set has 1.7 times the signal-to-noise ratio shown in Figure 10C and F (120 scans, 4 s recycle delay). In both cases spectra with improved resolution were obtained.
Figure 10.
Three-dimensional HETCOR-SAMMY spectrum and its reconstructed spectra of 15N-labeled Pf1 coat protein. A. Conventional three-dimensional HETCOR-SAMMY spectrum (20 t1 complex points, 32 t2 points, and 40 scans). B. Reconstructed three-dimensional HETCOR-SAMMY spectrum (212 points, and 40 scans). C. Reconstructed three-dimensional HETCOR-SAMMY spectrum (212 points, and 120 scans). D, E., and F. are the two-dimensional planes extracted from the 1H chemical shift at 9.5 ppm in A., B., and C., respectively. Lagrange multiplier is 0.05.
CS was originally proposed to reconstruct sparse data. In NMR spectroscopy, sparse data most closely resemble solution NMR spectra, which have signals with relatively high signal-to-noise ratios and narrow line widths spread over a large frequency range. We investigated the performance of CS for solid-state NMR studies of proteins with broader line widths and a wide range of signal-to-noise ratios, which is challenging because the conditions are not ideal for CS, and the sizes of datasets available for processing are limited. To optimize the NUS scheme, knowledge of the line widths and signal-to-noise ratios of both conventional and reconstructed spectra are required. However, in most cases these can be quickly measured or estimated from preliminary experiments on the same or similar samples. The results show that CS can provide reconstructions in two-and three-dimensional experiments using 25% – 33% sampling for spectra having signal-to-noise ratios ~ 10. The splitting artifacts are especially prominent in the low sensitivity and highly under-sampled experiments[22]. With these parameters the vast majority of signals are faithfully reproduced, although a few may be ambiguous following the reconstructions because of variations of the intensities. However, in terms of efficiency, only 25% – 33% of experimental time is required to obtain spectra with similar (or even higher) signal-to-noise ratios. In the future, wavelet transforms can be implemented [26], which transforms the spectral signals to the frequency domain and is advantageous for crowded spectra and solid-state NMR experiments associated strong spin interactions, such as dipolar coupling networks among like spins.
Using CS under optimized conditions it is possible to increase the efficiency, resolution, and signal-to-noise ratio of solid-state NMR spectra on stationary and spinning samples.
Experimental Methods
The generation of simulated FIDs, NUS schemes, and spectral reconstructions were performed with MATLAB (Mathworks, http://www.mathworks.com/) scripts. The IST algorithm is based on the pseudo-code proposed by Drori[24]. The direct dimension of the spectra was first processed with NMRpipe[41], and then, the indirect dimensions were reconstructed using the IST algorithm.
The two-dimensional NUS magic angle spinning solid-state NMR experiments were performed with a home-built 1H/13C/15N triple resonance probe at 800 MHz 13C/13C correlation experiments utilized the dipolar assisted rotational resonance (DARR) pulse sequence[42] for mixing, and we also implemented the repetitive cross-polarization (REP-CP) contacts via equilibration-re-equilibration of the proton bath [43; 44] to improve 1H/13C magnetization transfer. A 60-residue truncated construct of a mercury transport protein, MerFt, [45] was incorporated into 14-O-PC proteoliposomes at pH=6. The protein to lipid molar ratio was 1:68, and the MAS rotors contained a total of ~2 mg protein. All the spectra were acquired with 20 ms mixing at 5°C and a spinning rate of 11,111 Hz.
Stationary sample solid-state NMR experiments were performed using a home-built 1H/15N double resonance probe on a Bruker Avance spectrometer (http://www.Bruker-Biospin.com) at a 1H resonance frequency of 700 MHz Two-dimensional SLF and three-dimensional NUS HETCOR/SLF[40] experiments were performed with B1 field strength of 50 kHz at 42 °C, and 1H and 15N carrier frequencies of 9 ppm and 100 ppm, respectively. 512 complex points were acquired with dwell time of 40 μs in the direct dimension. The sample consisted of 3 mg of the membrane-bound form of the uniformly 15N-labeled 46-residue coat protein of bacteriophage Pf1 incorporated into q = 3.2 DMPC/DHPC bicelles[46] (q is the molar ratio of long chain to short chain lipids).
Supplementary Material
Compressed Sensing reduces experimental time in solid-state NMR.
The non-uniform sampling scheme was optimized for solid-state NMR.
A modest increase in signal-to-noise ratio accompanies the CS reconstruction.
Acknowledgments
We thank S. H. Park and G. J. Lu for assistance with the sample preparations. We also thank Chris Grant and Albert Wu for assistance with the instrumentation. The research was supported by Grants RO1GM066978, RO1GM099986, EB005161, and AI074805 from the National Institutes of Health. It utilized the Biomedical Technology Resource for NMR Molecular Imaging of Proteins at the University of California, San Diego supported by grant P41EB002031.
Footnotes
Publisher's Disclaimer: This is a PDF file of an unedited manuscript that has been accepted for publication. As a service to our customers we are providing this early version of the manuscript. The manuscript will undergo copyediting, typesetting, and review of the resulting proof before it is published in its final citable form. Please note that during the production process errors may be discovered which could affect the content, and all legal disclaimers that apply to the journal pertain.
References
- 1.Thurber KR, Tycko R. Biomolecular solid state NMR with magic-angle spinning at 25 K. J Magn Reson. 2008;195:179–186. doi: 10.1016/j.jmr.2008.09.015. [DOI] [PMC free article] [PubMed] [Google Scholar]
- 2.Hu KN, Bajaj VS, Rosay M, Griffin RG. High-frequency dynamic nuclear polarization using mixtures of TEMPO and trityl radicals. J Chem Phys. 2007;126:044512–7. doi: 10.1063/1.2429658. [DOI] [PubMed] [Google Scholar]
- 3.Hall DA, Maus DC, Gerfen GJ, Inati SJ, Becerra LR, Dahlquist FW, Griffin RG. Polarization-Enhanced NMR Spectroscopy of Biomolecules in Frozen Solution. Science. 1997;276:930–932. doi: 10.1126/science.276.5314.930. [DOI] [PubMed] [Google Scholar]
- 4.Grant CV, Yang Y, Glibowicka M, Wu CH, Park SH, Deber CM, Opella SJ. A Modified Alderman-Grant Coil makes possible an efficient cross-coil probe for high field solid-state NMR of lossy biological samples. J Magn Reson. 2009;201:87–92. doi: 10.1016/j.jmr.2009.08.009. [DOI] [PMC free article] [PubMed] [Google Scholar]
- 5.Joo CG, Hu KN, Bryant JA, Griffin RG. In Situ Temperature Jump High-Frequency Dynamic Nuclear Polarization Experiments: Enhanced Sensitivity in Liquid-State NMR Spectroscopy. J Am Chem Soc. 2006;128:9428–9432. doi: 10.1021/ja0611947. [DOI] [PubMed] [Google Scholar]
- 6.Hoch JC, Stern AS. NMR Data Processing. Wiley-Liss; New York: 1996. [Google Scholar]
- 7.Daniell GJ, Hore PJ. Maximum entropy and NMR-A new approach. J Magn Reson. 1989;84:515–536. [Google Scholar]
- 8.Sibisi S, Skilling J, Brereton RG, Laue ED, Staunton J. Maximum entropy signal processing in practical NMR spectroscopy. Nature. 1984;311:446–447. [Google Scholar]
- 9.Stern AS, Li KB, Hoch JC. Modern Spectrum Analysis in Multidimensional NMR Spectroscopy: Comparison of Linear-Prediction Extrapolation and Maximum-Entropy Reconstruction. J Am Chem Soc. 2002;124:1982–1993. doi: 10.1021/ja011669o. [DOI] [PubMed] [Google Scholar]
- 10.Jones DH, Opella SJ. Application of Maximum Entropy reconstruction to PISEMA spectra. J Magn Reson. 2006;179:105–13. doi: 10.1016/j.jmr.2005.11.014. [DOI] [PubMed] [Google Scholar]
- 11.Sun S, Yan S, Guo C, Li M, Hoch JC, Williams JC, Polenova T. A Time-Saving Strategy for MAS NMR Spectroscopy by Combining Nonuniform Sampling and Paramagnetic Relaxation Assisted Condensed Data Collection. J Phys Chem B. 2012;116:13585–13596. doi: 10.1021/jp3005794. [DOI] [PMC free article] [PubMed] [Google Scholar]
- 12.Paramasivam S, Suiter CL, Hou G, Sun S, Palmer M, Hoch JC, Rovnyak D, Polenova T. Enhanced Sensitivity by Nonuniform Sampling Enables Multidimensional MAS NMR Spectroscopy of Protein Assemblies. J Phys Chem B. 2012;116:7416–7427. doi: 10.1021/jp3032786. [DOI] [PMC free article] [PubMed] [Google Scholar]
- 13.Kupče Ē, Freeman R. Projection-Reconstruction Technique for Speeding up Multidimensional NMR Spectroscopy. J Am Chem Soc. 2004;126:6429–6440. doi: 10.1021/ja049432q. [DOI] [PubMed] [Google Scholar]
- 14.Kupče Ē, Freeman R. The radon transform: A new scheme for fast multidimensional NMR. Concept Magnetic Res A. 2004;22A:4–11. [Google Scholar]
- 15.Luan T, Jaravine V, Yee A, Arrowsmith C, Orekhov V. Optimization of resolution and sensitivity of 4D NOESY using Multi-dimensional Decomposition. J Biomol NMR. 2005;33:1-14-14. doi: 10.1007/s10858-005-1363-6. [DOI] [PubMed] [Google Scholar]
- 16.Orekhov VY, Ibraghimov I, Billeter M. Optimizing resolution in multidimensional NMR by three-way decomposition. J Biomol NMR. 2003;27:165-173-173. doi: 10.1023/a:1024944720653. [DOI] [PubMed] [Google Scholar]
- 17.Atreya HS, Garcia E, Shen Y, Szyperski T. J-GFT NMR for Precise Measurement of Mutually Correlated Nuclear Spin-Spin Couplings. J Am Chem Soc. 2006;129:680–692. doi: 10.1021/ja066586s. [DOI] [PubMed] [Google Scholar]
- 18.Kazimierczuk K, Zawadzka A, KoŸmiński W, Zhukov I. Random sampling of evolution time space and Fourier transform processing. J Biomol NMR. 2006;36:157–168. doi: 10.1007/s10858-006-9077-y. [DOI] [PubMed] [Google Scholar]
- 19.Eddy MT, Ruben D, Griffin RG, Herzfeld J. Deterministic schedules for robust and reproducible non-uniform sampling in multidimensional NMR. J Magn Reson. 2012;214:296–301. doi: 10.1016/j.jmr.2011.12.002. [DOI] [PMC free article] [PubMed] [Google Scholar]
- 20.Matsuki Y, Eddy MT, Griffin RG, Herzfeld J. Rapid Three-Dimensional MAS NMR Spectroscopy at Critical Sensitivity. Angew Chem Int Edit Engl. 2010;49:9215–9218. doi: 10.1002/anie.201003329. [DOI] [PMC free article] [PubMed] [Google Scholar]
- 21.Matsuki Y, Eddy MT, Herzfeld J. Spectroscopy by Integration of Frequency and Time Domain Information for Fast Acquisition of High-Resolution Dark Spectra. J Am Chem Soc. 2009;131:4648–4656. doi: 10.1021/ja807893k. [DOI] [PMC free article] [PubMed] [Google Scholar]
- 22.Stern AS, Donoho DL, Hoch JC. NMR data processing using iterative thresholding and minimum l1-norm reconstruction. J Magn Reson. 2007;188:295–300. doi: 10.1016/j.jmr.2007.07.008. [DOI] [PMC free article] [PubMed] [Google Scholar]
- 23.Donoho DL. Compressed sensing. IEEE T Inform Theory. 2006;52:1289–1306. [Google Scholar]
- 24.Drori I. Fast l1 minimization by iterative thresholding for multidimensional nmr spectroscopy. EURASIP J Adv Sig Pr. 2007;1 [Google Scholar]
- 25.Lustig M, Donoho DL, Santos JM, Pauly JM. Compressed Sensing MRI. IEEE Signal Proc Mag. 2008;25:72–82. [Google Scholar]
- 26.Lustig M, Donoho D, Pauly JM. Sparse MRI: The application of compressed sensing for rapid MR imaging. Magn Reson Med. 2007;58:1182–1195. doi: 10.1002/mrm.21391. [DOI] [PubMed] [Google Scholar]
- 27.Kazimierczuk K, Orekhov VY. Accelerated NMR Spectroscopy by Using Compressed Sensing. Angew Chem Int Edit Engl. 2011;50:5556–5559. doi: 10.1002/anie.201100370. [DOI] [PubMed] [Google Scholar]
- 28.Holland DJ, Bostock MJ, Gladden LF, Nietlispach D. Fast multidimensional NMR spectroscopy using compressed sensing. Angew Chem Int Edit Engl. 2011;123:6678–6681. doi: 10.1002/anie.201100440. [DOI] [PubMed] [Google Scholar]
- 29.Shrot Y, Frydman L. Spatial/spectral encoding of the spin interactions in ultrafast multidimensional NMR. J Chem Phys. 2009;131:224516. doi: 10.1063/1.3266422. [DOI] [PubMed] [Google Scholar]
- 30.Bostock M, Holland D, Nietlispach D. Compressed sensing reconstruction of undersampled 3D NOESY spectra: application to large membrane proteins. J Biomol NMR. 2012;54:15–32. doi: 10.1007/s10858-012-9643-4. [DOI] [PubMed] [Google Scholar]
- 31.Hyberts S, Milbradt A, Wagner A, Arthanari H, Wagner G. Application of iterative soft thresholding for fast reconstruction of NMR data non-uniformly sampled with multidimensional Poisson Gap scheduling. J Biomol NMR. 2012;52:315–327. doi: 10.1007/s10858-012-9611-z. [DOI] [PMC free article] [PubMed] [Google Scholar]
- 32.Kazimierczuk K, Zawadzka A, Kozminski W. Optimization of random time domain sampling in multidimensional NMR. J Magn Reson. 2008;192:123–130. doi: 10.1016/j.jmr.2008.02.003. [DOI] [PubMed] [Google Scholar]
- 33.Mobli M, Stern AS, Hoch JC. Spectral reconstruction methods in fast NMR: Reduced dimensionality, random sampling and maximum entropy. J Magn Reson. 2006;182:96–105. doi: 10.1016/j.jmr.2006.06.007. [DOI] [PubMed] [Google Scholar]
- 34.Hyberts SG, Takeuchi K, Wagner G. Poisson-Gap Sampling and Forward Maximum Entropy Reconstruction for Enhancing the Resolution and Sensitivity of Protein NMR Data. J Am Chem Soc. 2010;132:2145–2147. doi: 10.1021/ja908004w. [DOI] [PMC free article] [PubMed] [Google Scholar]
- 35.Hyberts S, Frueh D, Arthanari H, Wagner G. FM reconstruction of non-uniformly sampled protein NMR data at higher dimensions and optimization by distillation. J Biomol NMR. 2009;45:283–294. doi: 10.1007/s10858-009-9368-1. [DOI] [PMC free article] [PubMed] [Google Scholar]
- 36.Hyberts S, Arthanari H, Wagner G. Applications of Non-Uniform Sampling and Processing. Top Curr Chem. 2011:1–24. doi: 10.1007/128_2011_187. [DOI] [PMC free article] [PubMed] [Google Scholar]
- 37.Waudby CA, Christodoulou J. An analysis of NMR sensitivity enhancements obtained using non-uniform weighted sampling, and the application to protein NMR. J Magn Reson. 2012 doi: 10.1016/j.jmr.2012.04.013. [DOI] [PubMed] [Google Scholar]
- 38.Rovnyak D, Sarcone M, Jiang Z. Sensitivity enhancement for maximally resolved two-dimensional NMR by nonuniform sampling. Magn Reson Chem. 2011;49:483–491. doi: 10.1002/mrc.2775. [DOI] [PubMed] [Google Scholar]
- 39.Mobli M, Maciejewski MW, Schuyler AD, Stern AS, Hoch JC. Sparse Sampling Methods In Multidimensional NMR. Phys Chem Chem Phys. 2012;14:10835–10843. doi: 10.1039/c2cp40174f. [DOI] [PMC free article] [PubMed] [Google Scholar]
- 40.Lu GJ, Park SH, Opella SJ. Improved 1H amide resonance line narrowing in oriented sample solid-state NMR of membrane proteins in phospholipid bilayers. J Magn Reson. 2012;220:54–61. doi: 10.1016/j.jmr.2012.04.008. [DOI] [PMC free article] [PubMed] [Google Scholar]
- 41.Delaglio F, Grzesiek S, Vuister GW, Zhu G, Pfeifer J, Bax A. NMRPipe: a multidimensional spectral processing system based on UNIX pipes. J Biomol NMR. 1995;6:277–293. doi: 10.1007/BF00197809. [DOI] [PubMed] [Google Scholar]
- 42.Takegoshi K, Nakamura S, Terao T. 13C-1H dipolar-assisted rotational resonance in magic-angle spinning NMR. Chem Phys Lett. 2001;344:631–637. [Google Scholar]
- 43.Tang W, Nevzorov AA. Repetitive cross-polarization contacts via equilibration-re-equilibration of the proton bath: Sensitivity enhancement for NMR of membrane proteins reconstituted in magnetically aligned bicelles. J Magn Reson. 2011;212:245–248. doi: 10.1016/j.jmr.2011.06.028. [DOI] [PubMed] [Google Scholar]
- 44.Nevzorov AA. Ergodicity and efficiency of cross-polarization in NMR of static solids. J Magn Reson. 2011;209:161–166. doi: 10.1016/j.jmr.2011.01.006. [DOI] [PubMed] [Google Scholar]
- 45.Lu GJ, Tian Y, Vora N, Marassi FM, Opella SJ. The Structure of the Mercury Transporter MerF in Phospholipid Bilayers: A Large Conformational Rearrangement Results From N-terminal Truncation. J Am Chem Soc. 2013 doi: 10.1021/ja4042115. [DOI] [PMC free article] [PubMed] [Google Scholar]
- 46.Park SH, Loudet C, Marassi FM, Dufourc EJ, Opella SJ. Solid-state NMR spectroscopy of a membrane protein in biphenyl phospholipid bicelles with the bilayer normal parallel to the magnetic field. J Magn Reson. 2008;193:133–8. doi: 10.1016/j.jmr.2008.04.033. [DOI] [PMC free article] [PubMed] [Google Scholar]
Associated Data
This section collects any data citations, data availability statements, or supplementary materials included in this article.


