Abstract
Climatic change is expected to affect the spatiotemporal patterns of airborne allergenic pollen, which has been found to act synergistically with common air pollutants, such as ozone, to cause Allergic Airway Disease (AAD). Observed airborne pollen data from six stations from 1994 to 2011 at Fargo (North Dakota), College Station (Texas), Omaha (Nebraska), Pleasanton (California), Cherry Hill and Newark (New Jersey) in the US were studied to examine climate change effects on trends of annual mean and peak value of daily concentrations, annual production, season start, and season length of Betula (birch) and Quercus (oak) pollen. The Growing Degree Hour (GDH) model was used to establish a relationship between start/end dates and differential temperature sums using observed hourly temperatures from surrounding meteorology stations. Optimum GDH models were then combined with meteorological information from the Weather Research and Forecasting (WRF) model, and land use land coverage data from the Biogenic Emissions Land use Database, version 3.1 (BELD3.1), to simulate start dates and season lengths of birch and oak pollen for both past and future years across the contiguous US (CONUS). For most of the studied stations, comparison of mean pollen indices between the periods of 1994–2000 and 2001–2011 showed that birch and oak trees were observed to flower 1–2 weeks earlier; annual mean and peak value of daily pollen concentrations tended to increase by 13.6%–248%. The observed pollen season lengths varied for birch and for oak across the different monitoring stations. Optimum initial date, base temperature, and threshold GDH for start date was found to be March 1, 8°C, and 1879 hours respectively for birch; March 1, 5°C, and 4760 hours respectively for oak. Simulation results indicated that responses of birch and oak pollen seasons to climate change are expected to vary for different regions.
Keywords: Climate change, Pollen season, Birch, Oak, Growing degree hour
Introduction
Climate change is expected to alter flowering time and allergenic airborne pollen count of trees, weeds and grasses (Fitter and Fitter 2002; Yli-Panula et al. 2009; Ziska et al. 2003). Changes in spatiotemporal distribution of allergenic airborne pollen are closely associated with Allergic Airway Diseases (AAD) and related rising public health costs (Singh et al. 2010; Lamb et al. 2006). One third of the U.S population were impacted by allergic diseases including asthma, hay fever, rhinitis, and atopic dermatitis (Bielory et al. 2012). These allergic diseases can be potentially triggered and exacerbated by allergenic pollen, such as birch and oak, under climate change scenarios (Shea et al. 2008). Synergism of pollen with other common atmospheric pollutants under conditions of climate change has been identified and has enhanced the severity of AAD (Adhikari et al. 2006).
Studies of climate change effects on distributions of allergenic pollens have typically been focused on analysis of observed airborne pollen counts in Europe and their regression relationships with local meteorological and/or climatic factors (Zhang et al. 2013; Emberlin et al. 2002). Responses of allergenic birch pollen season to climate change have been examined based on statistical analyses in Switzerland, Finland, Denmark and Germany (Rasmussen 2002; Frei 1998; Frei and Gassner 2008; Estrella et al. 2006; Yli-Panula et al. 2009). Climate change effects on oak pollen timing and levels have also been statistically investigated in Spain, Turkey and Greece (Garcia-Mozo et al. 2006;-Mozo et al. 2002; Erkan 2010; Damialis et al. 2007). These studies have shown that, under climate change, birch and oak pollen season tends to start earlier and that recorded total airborne pollen count tends to increase across Europe with rising temperature.
Qualitative or semi-quantitative pollen dispersion models have also been developed to provide high spatial and temporal resolution forecasts of pollen concentrations (Sofiev et al. 2006; Vogel et al. 2008). These dispersion models usually couple the transport module of an air quality model with output from an operational meteorology model based on either Lagrangian or Eulerian scheme (Siljamo et al. 2008; Hernández-Ceballos et al. 2011; Efstathiou et al. 2011; Helbig et al. 2004). The recent modeling studies of birch pollen emission and dispersion could reasonably well reproduce the low and high concentrations, but had difficulties to characterize the intermediate concentrations (Siljamo et al. 2013). A major shortcoming of dispersion modeling is that large uncertainties exist in pollen emission modules (Sofiev et al. 2013). It is important to obtain crucial information relevant to pollen emission, such as detailed vegetation coverage, and high resolution timing of season start and length (Pauling et al. 2012).
In the current study, statistical analysis was carried out to identify trends of Start Date (SD), Season Length (SL), Annual Mean (AM) and Peak Value (PV) of daily concentrations, and Annual Production (AP) of Betula (birch) and Quercus (Oak) pollen from observed airborne pollen data at six monitoring stations across the contiguous US (CONUS). The Growing Degree Hour (GDH) model was parameterized based on observed pollen counts and hourly temperatures from surrounding meteorology stations. It was then utilized to produce spatially resolved start dates and season lengths for birch and oak pollen.
Methods
Data source
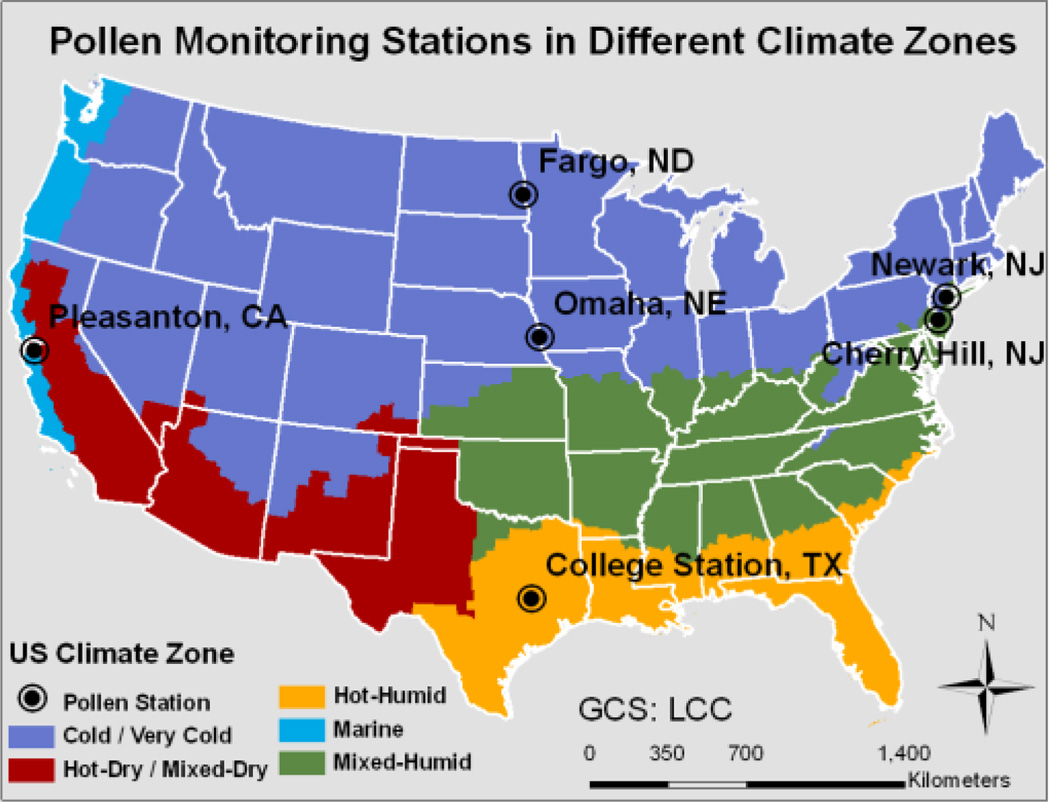
Observed airborne pollen counts were obtained from six monitoring stations of the American Academy of Allergy Asthma and Immunology (AAAAI). The reported pollen data were only classified at the level of genus. Species under genus of either Betula or Quercus were not differentiated. The selected stations are located at Fargo (North Dakota), College Station (Texas), Omaha (Nebraska), Pleasanton (California), Cherry Hill (New Jersey) and Newark (New Jersey). These stations were selected because (1) they have airborne daily pollen counts available for birch and oak for multiple years between 1994 and 2011; and (2) they are located at representative geographical and climatic regions across the CONUS as shown in Figure 1. These locations span various geographic regions and climate zones across CONUS (Baechler et al. 2010). Table 1 lists the geographic information, main climate characteristics, and number of years with valid pollen counts at the studied pollen monitoring stations. Data of pollen counts were not continuously reported to AAAAI; data in missing years were either not available or not valid according to the standard used in following subsection (Pollen indices). Since there are large areas of desert and mountain in the Hot-Dry / Mixed Dry climate zone, few valid pollen counts were reported in that climate zone (Figure 1).
Figure 1.
The geographical locations of six selected pollen monitoring s tations in five major climate zones across CONUS. Map of climate zones was adapted from Baechler et al. (2010).
Table 1.
Coordinates, elevation (meters above sea level), main climate characteristics, and number of years with valid pollen data for the studied monitoring stations.
| Station | Latitude | Longitude | Elevation (m) |
Climate Zone a |
Mean Air Temp. (C°) |
Years of Data | |
|---|---|---|---|---|---|---|---|
| Birch | Oak | ||||||
| Fargo, ND | 46.84°N | 96.87°W | 277 | Cold / Very Cold | 5.9 | 11 yr (97-00, 03–08, 10) | 11 yr (96-00, 03, 05–08, 10) |
| College Station, TX | 36.64°N | 96.31°W | 91 | Hot-Humid | 20.3 | 6 yr (03–05, 07, 08, 10) | 10 yr (97-00, 03–05, 07, 08, 10) |
| Omaha, NE | 41.14°N | 95.97°W | 304 | Cold / Very Cold | 10.8 | 5 yr (95,96, 03,06,10) | 10 yr (94–00, 03, 06, 10) |
| Pleasanton, CA | 37.69°N | 121.91°W | 100 | Marine | 14.6 | 10 yr (97,98,00,03–08, 10) | 10 yr (94, 96–98, 00, 04–07, 10) |
| Cherry Hill, NJ |
39.94°N | 74.91°W | 13 | Mixed-Humid | 12.6 | 13 yr (95-00, 03–08, 10) | 13 yr (95-00, 03–08, 10) |
| Newark, NJ | 40.74°N | 74.19°W | 43 | Mixed-Humid | 13.1 | 11 yr (94–97, 03, 05, 06, 08–11) | 11 yr (94–97,03, 05, 06, 08, 10, 11) |
Climate zones are defined according to Guide to Determining Climate Regions by County (Baechler et al. 2010)
Observed hourly temperatures from 1994 to 2011 were obtained from the National Climatic Data Center (NCDC) meteorology stations nearest to the corresponding AAAAI pollen stations. Spatially resolved hourly surface temperatures for 2004 and 2050 were obtained from established Weather Research and Forecasting (WRF) model simulations archived by the North American Regional Climate Change Assessment Program (NARCCAP) (Mearns et al. 2009). The NARCCAP dataset was generated based on Intergovernmental Panel on Climate Change (IPCC) scenario A2, which assumes regionally and economically oriented development with projection of CO2 level being 850 ppm in year 2100 (Nakicenvoic et al. 2000). Configurations of the WRF simulations including model domain and physics parameterizations followed those described by Leung and Qian (2009) for the NARCCAP Phase I experiment.
Area coverage data for birch and oak trees were obtained from the Biogenic Emissions Land use Database, version 3.1 (BELD3.1) (Kinnee et al. 1997).
Pollen indices
With day 1 being January 1st, the Start Date (SD, day of year) of pollen season is the day when the cumulative pollen count reaches 5% and end date when it reaches 95% of annual total count. Season Length (SL, day) is defined as the duration between start and end dates. Annual Mean (AM, pollen.m−3) is the mean and Peak Value (PV, pollen.m−3) the maximum daily concentration recorded during a pollen season; Annual Production (AP, pollen.m−3) is defined as the sum of daily concentrations during a pollen season. Pollen data with SL of less than 7 or greater than 80 days are assumed unreasonable and excluded for further calculation. Regression analysis was carried out to identify the trends of these indices derived from airborne pollen data.
Natural variability exists in both climate and plant growth. It has recently been reported that internal climate variability played an important role in regional climate change (Deser et al. 2012). The intrinsic inter-annual variation of plant growth has been observed by many researchers (Silvertown 1980; Masaka and Maguchi 2001). In order to reduce the effects of the natural climate and plant-growth variability on pollen indices, mean birch and oak pollen indices were calculated for 1994–2000 and 2001–2011. Pollen indices in these two periods were also compared using the Student Test to check the significance of the corresponding difference.
GDH model
The GDH model was used to predict start and end dates of pollen season based on accumulation of Growing Degree Hours for a selected period before and/or during pollen season (Rasmussen 2002). The hypothesis of the GDH model is that the trees, after having reached certain GDHs, start to pollinate (or stop pollinating), i.e. the pollen season is beginning (or ending). The GDH model is presented in equation (1),
| (1) |
where ID is the Initial Date starting to accumulate the difference between the hourly ground surface temperature Ti (°C) and the base temperature Tb (°C).
The station specific optimum GDH value for a fixed initial date and a base temperature is determined by a least square fitting of the corresponding observed pollen start/end dates at that monitoring station for 1994–2011. This GDH value is utilized to calculate the modeled start/end dates and the corresponding Root Mean Square (RMS) error and correlation coefficient and p value with respect to the observed start/end dates. The station specific optimum initial date and base temperature are then selected based on Root Mean Square (RMS) errors and correlation coefficients. The overall optimum GDH value GDHO under optimum ID and Tb across the US is finally obtained through a weighted average over multiple stations as presented in equation (2),
| (2) |
where GDHi is station specific optimum GDH at station i, and Ni is number of years in which valid pollen counts are registered.
The overall optimum GDH value, initial date and base temperature were then combined in equation (1) to simulate start date and season length of birch and oak pollen using vegetation coverage data from BELD3.1 and estimated meteorology from the WRF model. The simulations were conducted for 2004 and 2050 covering CONUS with spatial resolution of 50×50 km.
Results
Trend analysis of pollen indices
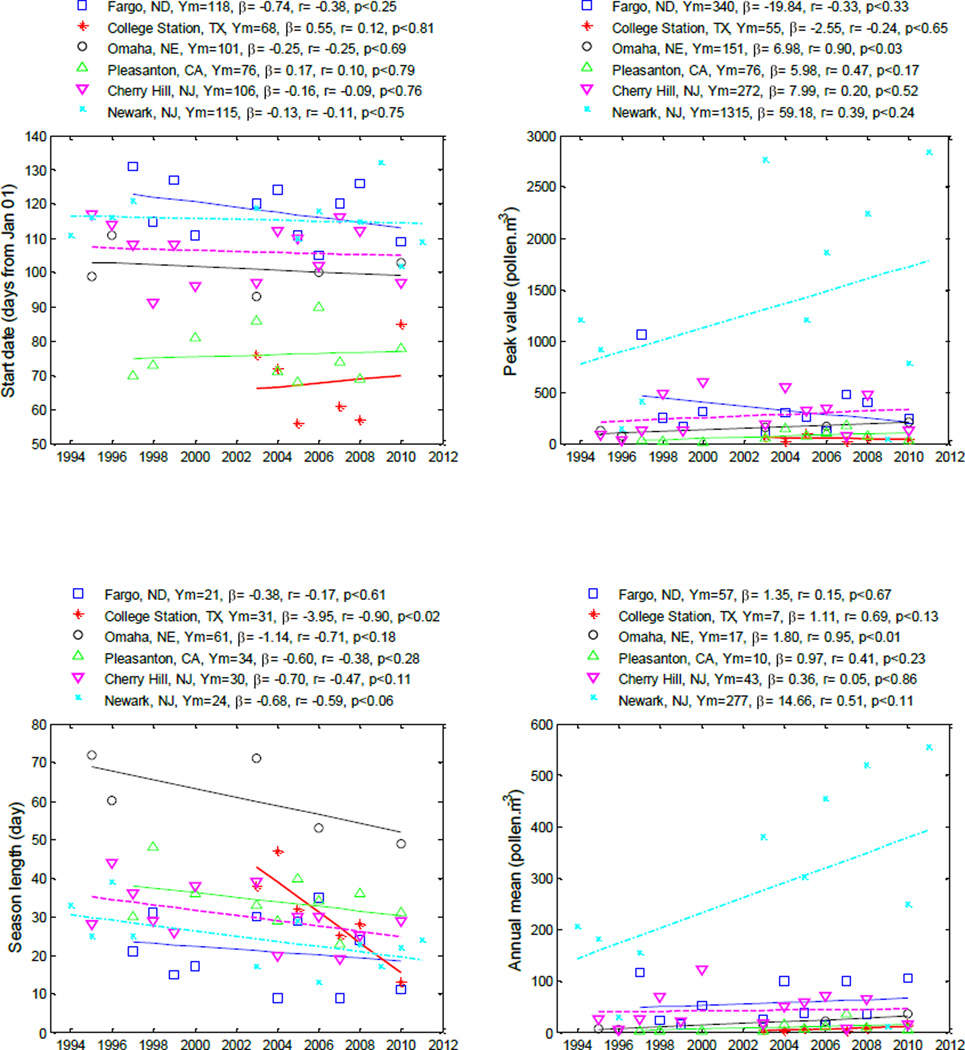
Figure 2 shows results of trend analysis of birch pollen indices between 1994 and 2011 at the six stations. In each legend, also listed are the mean value Ym, trend β, correlation coefficient r and p value. Birch pollen season is observed to start earlier in Fargo, Omaha, Cherry Hill and Newark, but slightly later in College Station and Pleasanton. Annual mean and peak value are found to increase for most of the studied stations. Birch season length tends to be shorter. However, only some of the observed trends are statistically significant.
Figure 2.
Birch pollen indices and calculated trends from 1994 to 2011 for six stations in the US. Ym is the mean value, β the annual trend, r the correlation coefficient and p the significance of the trend.
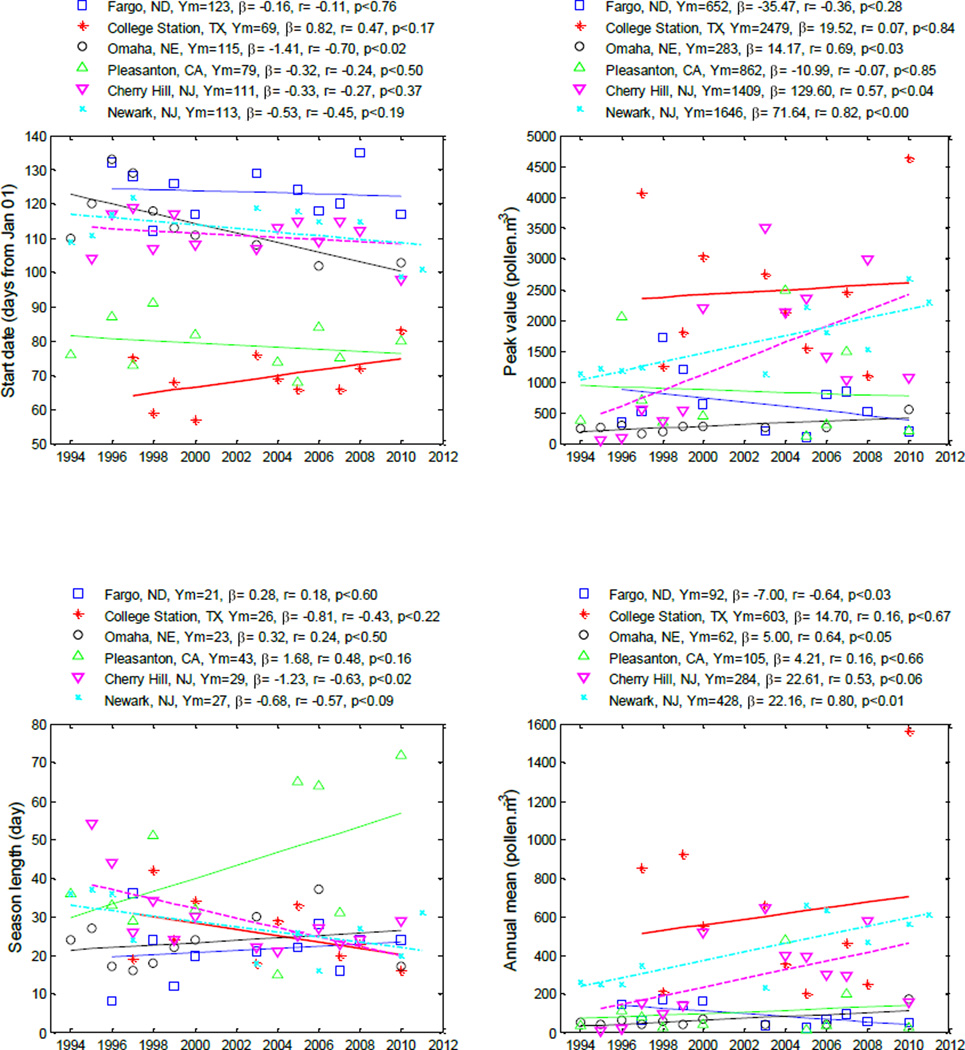
Figure 3 presents the results of trend analysis of oak pollen indices. Oak pollen season was also found to start earlier at five out of the six monitoring stations; season lengths at Fargo, Omaha and Pleasanton were observed to be longer, while season lengths at College Station, Cherry Hill and Newark appeared to be shorter. Increases in annual mean and peak value have been identified at most of the studied stations.
Figure 3.
Oak pollen indices and calculated trends from 1994 to 2011 for six stations in the US. Ym is the mean value, β the annual trend, r the correlation coefficient and p the significance of the trend.
Annual production of birch pollen tended to increase at Omaha, Pleasanton and Newark, and to decrease slightly at Fargo, College Station, and Cherry Hill. Rising trends of annual production were observed for oak pollen at Omaha, Pleasanton, Cherry Hill and Newark, and decreasing trends at Fargo and College Station. For both birch and oak pollen, only the trend of annual production at Omaha was found to be significant at 5% level.
Table 2 lists mean birch and oak pollen indices for 1994–2000 and 2001–2011. Also listed are the corresponding differences between these two periods. Based on the differences between mean pollen indices, birch pollen season in Fargo and Omaha for 2001–2011 started around one week earlier than that in 1994–2000, while in Pleasanton it started around one week later. At both New Jersey stations, birch pollen season tended to start around the same time during both periods. Birch pollen season length was approximately 6–10 days shorter in 2001–2011 than in 1994–2000. Annual mean increased by 13.6%–248.0% at most of the stations, with the exception that it decreased by 10.2% at Cherry Hill. Peak value increased by 72.2%–225.4% for most of the stations, with the exception that it decreased by 38.5% at Fargo. Annual production increased by 82.0%–184.6% at Newark, Omaha and Pleasanton, while decreased by 19.3%–26.9% at Cherry Hill and Fargo.
Table 2.
Comparisons of mean Start Date (SD, day of year), Season Length (SL, day), Peak Value (PV, pollen.m−3), Annual Mean (AM, pollen.m−3) and Annual Production (AP, pollen.m−3) between periods 1994–2000 and 2001–2011 at the six stations.
| Station | Mean in 1994–2000 | Mean in 2001–2011 | Difference | |||||||||||||
|---|---|---|---|---|---|---|---|---|---|---|---|---|---|---|---|---|
| SD | SL | PV | AM | AP | SD | SL | PV | AM | AP | SD | SL | PV | AM | AP | ||
| Fargo, ND | Birch | 121 | 21 | 450 | 58 | 1203 | 116 | 21 | 277 | 66 | 971 | −5 | 0 | −173 | 8 | −232 |
| Oak | 123 | 20 | 894 | 152 | 2772 | 124 | 23 | 451 | 62 | 1335 | 1 | 3 | −443 | −90 | −1417* | |
| College Station, TX | Birch | - | - | - | - | - | 68 | 31 | 55 | 7 | 182 | - | - | - | - | - |
| Oak | 65 | 30 | 2542 | 635 | 16511 | 72 | 23 | 2438 | 581 | 11449 | 7 | −7 | −104 | −54 | −5063 | |
| Omaha, NE | Birch | 105 | 66 | 106 | 7 | 465 | 99 | 58 | 182 | 24 | 1323 | −6 | −8 | 76 | 17 | 858 |
| Oak | 119 | 21 | 248 | 52 | 1098 | 104 | 28 | 363 | 85 | 1911 | −15* | 7 | 115 | 33 | 812 | |
| Pleasanton, CA | Birch | 72 | 39 | 27 | 4 | 138 | 77 | 33 | 88 | 12 | 333 | 6 | −6 | 61* | 8 | 195 |
| Oak | 82 | 36 | 794 | 59 | 1999 | 76 | 49 | 930 | 151 | 3568 | −6 | 13 | 136 | 92 | 1659 | |
| Cherry Hill, NJ | Birch | 106 | 34 | 243 | 45 | 1518 | 107 | 27 | 297 | 40 | 1109 | 1 | −6 | 54 | −5 | −409 |
| Oak | 112 | 35 | 637 | 115 | 4533 | 110 | 24 | 2071 | 394 | 9344 | −2 | −11* | 1434* | 239* | 4790 | |
| Newark, NJ | Birch | 116 | 31 | 675 | 143 | 4094 | 115 | 21 | 1681 | 354 | 7452 | −1 | −10* | 1006 | 354 | 3359 |
| Oak | 115 | 33 | 1198 | 276 | 8960 | 111 | 23 | 1945 | 529 | 12393 | −4 | −10* | 747* | 253* | 3433 | |
The * indicates the difference is statistically significant at 5% level.
Comparisons of mean oak pollen indices between 2001–2011 and 1994–2000 indicate that oak pollen season started 1 to 15 days earlier at Omaha, Pleasanton, Newark and Cherry Hill, while about one week later at College Station. Season length of oak pollen was 3 to 13 days longer at Fargo, Omaha and Pleasanton, 6 to 11 days shorter at College Station, Newark and Cherry Hill. Annual production, annual mean and peak value of oak pollen in the period of 2001–2011 increased by 17.1%–225.0% at Omaha, Pleasanton, Newark and Cherry Hill, and decreased by 8.5%–59.4% at Fargo and College Station.
Parameterization of the GDH model
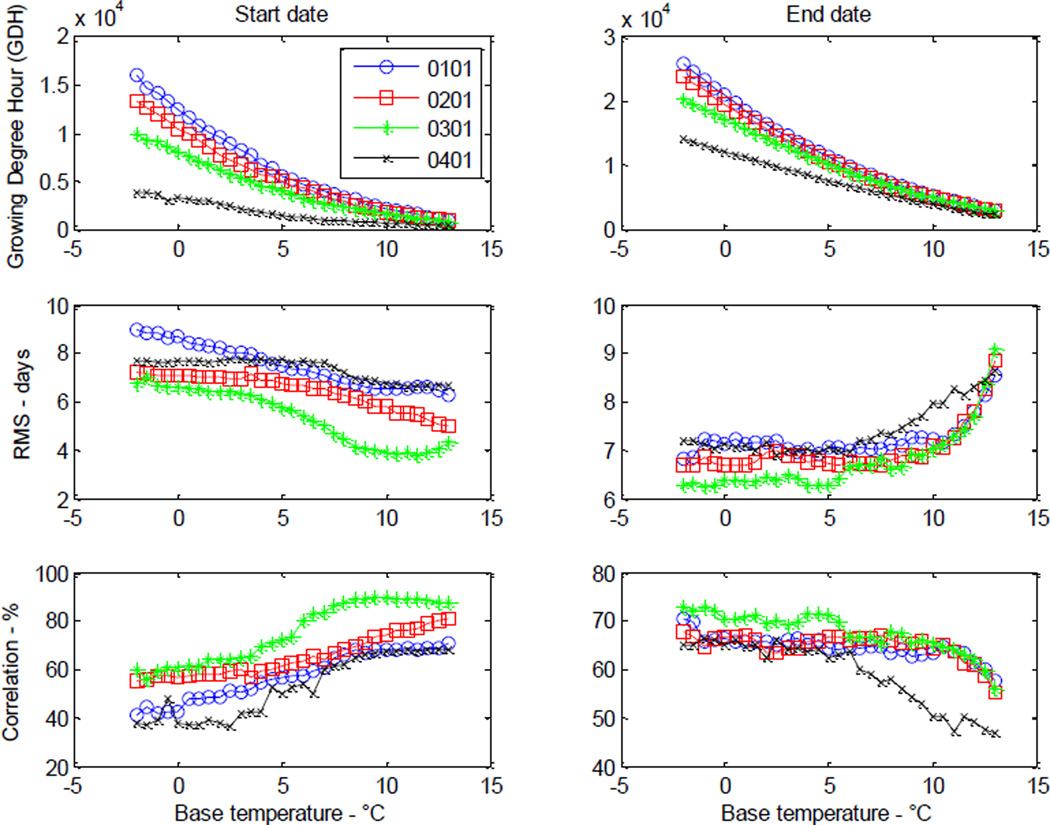
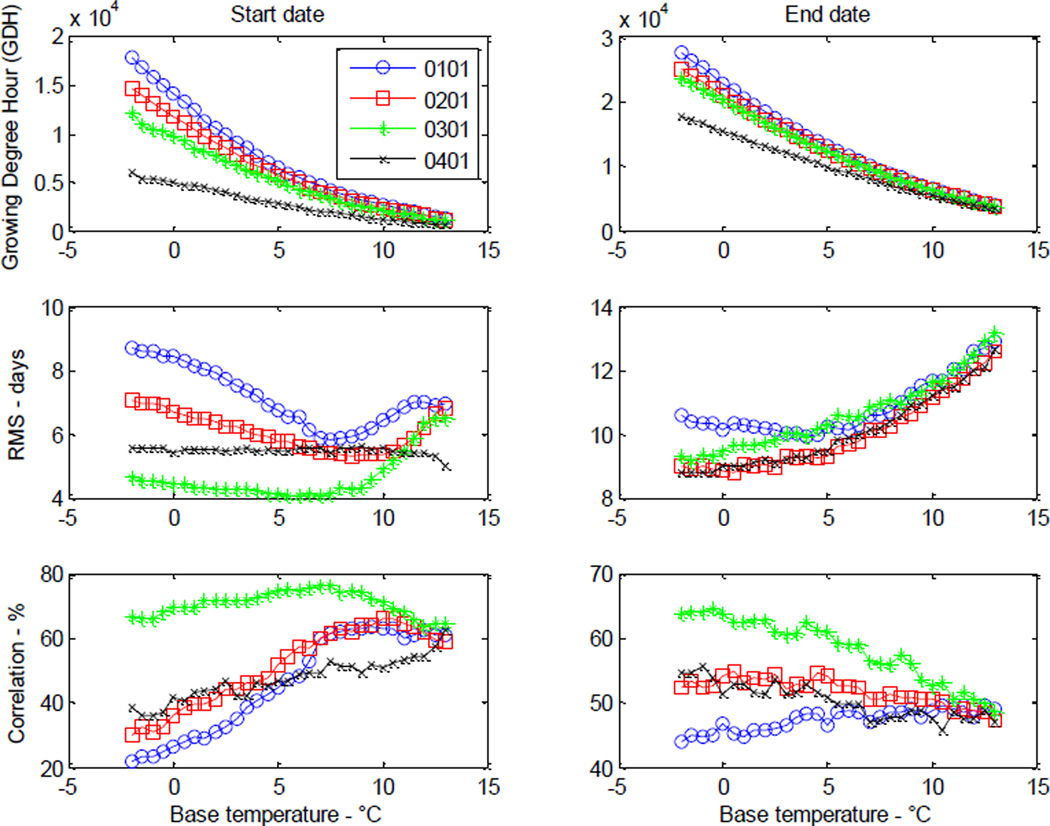
Figure 4 depicts the station-specific optimum GDHs, initial dates and base temperatures for birch pollen at Cherry Hill. The top panel illustrates the optimum GDHs of start and end dates for different initial dates and base temperatures. Optimum GDHs of start and end dates are, for example, about 2,265 and 6,637 respectively with initial date March 1st and base temperature 8°C. The optimum GDHs from different IDs tend to converge for higher base temperatures. The middle and bottom panels show corresponding root mean square errors and correlation coefficients utilizing the GDH values from the top panels.
Figure 4.
Optimum GDHs (Top Panel) of start and end dates with different initial dates and base temperatures for birch pollen at the Cherry Hill, New Jersey station. Also plotted are the corresponding Root Mean Square (RMS) errors (Middle Panel) and correlation coefficients (Bottom Panel) with respect to observed pollen data.
As demonstrated by both the RMSs and correlation coefficients in Figure 4, March 1st is the optimum ID and base temperature of 8°C is a good trade-off for the GDH model for both start and end dates of birch pollen in Cherry Hill. Similarly, station specific optimum GDH, ID, and base temperature were generated through analysis of the airborne birch pollen data and corresponding observed hourly temperatures for monitoring stations at Fargo, College Station, Omaha, Pleasanton, and Newark. These station-specific optimum GDHs, IDs and base temperatures for all six stations are listed in Table 3 together with the corresponding RMSs, correlation coefficients and p values.
Table 3.
Station specific Growing Degree Hours (GDH) and corresponding Root Mean Square error (RMS) and p value and correlation coefficient of start and end dates with initial date being Mar 1st. The base temperatures are 8 and 5 C° for birch and oak pollen, respectively.
| Station | Start Date | End Date | |||||||
|---|---|---|---|---|---|---|---|---|---|
| GDH | RMS | r | p | GDH | RMS | r | p | ||
| Fargo, ND | Birch | 1794 | 5 | 0.89 | 0.000 | 4859 | 11 | 0.50 | 0.121 |
| Oak | 3216 | 8 | 0.67 | 0.025 | 6846 | 8 | 0.56 | 0.071 | |
| College Station, TX | Birch | 2651 | 13 | −0.12 | 0.817 | 11318 | 19 | −0.06 | 0.911 |
| Oak | 2246 | 8 | 0.12 | 0.738 | 7926 | 5 | 0.67 | 0.036 | |
| Omaha, NE | Birch | 2414 | 2 | 0.96 | 0.009 | 13385 | 6 | 0.78 | 0.121 |
| Oak | 6030 | 6 | 0.95 | 0.000 | 10435 | 7 | 0.58 | 0.080 | |
| Pleasanton, CA | Birch | 1469 | 4 | 0.83 | 0.003 | 5996 | 8 | 0.71 | 0.022 |
| Oak | 1758 | 7 | 0.37 | 0.294 | 7859 | 15 | 0.88 | 0.000 | |
| Cherry Hill, NJ | Birch | 2265 | 4 | 0.88 | 0.000 | 6637 | 7 | 0.68 | 0.011 |
| Oak | 5088 | 4 | 0.75 | 0.003 | 12213 | 10 | 0.61 | 0.027 | |
| Newark, NJ | Birch | 3194 | 6 | 0.58 | 0.064 | 8613 | 9 | 0.48 | 0.131 |
| Oak | 5673 | 6 | 0.67 | 0.008 | 12168 | 6 | 0.70 | 0.003 | |
Figure 5 shows the station specific optimum GDH, ID, and base temperatures for oak pollen at the Cherry Hill station. Similar phenomena as for birch pollen shown in Figure 4 can also be identified for oak pollen in Figure 5. For oak pollen at the Cherry Hill station, the optimum GDHs for start and end dates are 5088 and 12,213 respectively with ID being March 1st and base temperature being 5°C. Table 3 also lists the station specific GDHs, IDs, and base temperatures for oak pollen and the corresponding RMSs, correlation coefficients, and p values at the six studied stations.
Figure 5.
Optimum GDHs (Top Panel) of start and end dates with different initial dates and base temperatures for oak pollen at the Cherry Hill, New Jersey station. Also plotted are the corresponding Root Mean Square (RMS) errors (Middle Bottom) and correlation coefficients (Bottom Panel) for the observed pollen data.
The overall optimum GDHs for start and end dates of birch pollen season were calculated based on equation (2) using the station-specific optimum GDHs for Fargo, Cherry Hill and Pleasanton. These stations were selected because they have (a) at least ten years of data available; and (b) higher correlation coefficients and lower p values for both start and end dates. The overall optimum GDHs of start and end dates for birch pollen season are 1,879 and 5,873, respectively, with the ID being March 1st and base temperature being 8°C.
Similarly, the overall optimum GDHs of oak pollen season were calculated using the station-specific optimum GDHs for Fargo, Omaha and Cherry Hill. The overall optimum GDHs for start and end dates of oak pollen season are 4,760 and 9,960, respectively, with ID being March 1st and base temperature being 5°C.
The overall optimum GDHs were then used to simulate the start and end dates at the six stations. The corresponding RMSs with respect to observations were comparable with their counterparts that were based on station-specific optimum GDHs listed in Table 3.
Pollen seasons under future climate change scenarios
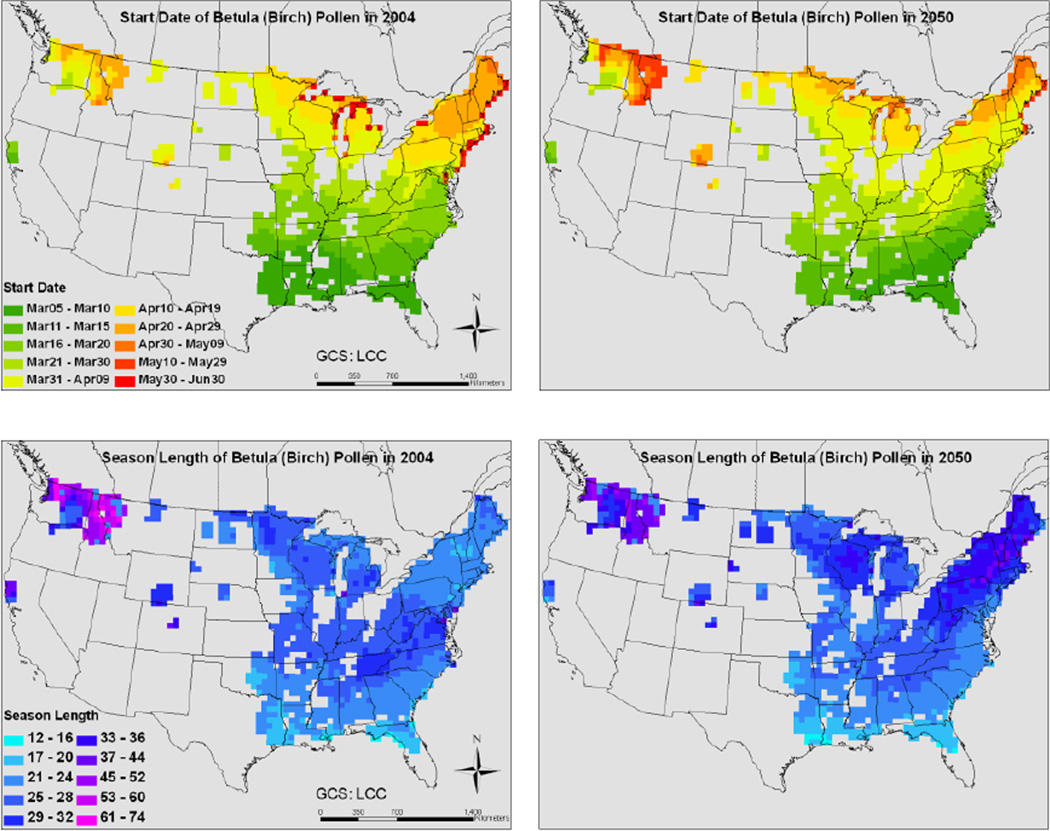
As illustrated in Figure 6, responses of birch pollen season to climate change are different in different regions. In the Northeastern US (e.g., Maine), the birch pollen season of 2050 is expected to start earlier and last for a longer period than that of 2004; while in the Northwestern US (e.g., Washington), it is expected to start later and last for a shorter period. In other regions, the estimates of birch pollen season do not appear to change significantly.
Figure 6.
Start date (Top panel) and season length (Bottom panel) of birch pollen in 2004 and 2050. Data are mapped only on cells in which the area coverage of birch trees is greater than zero.
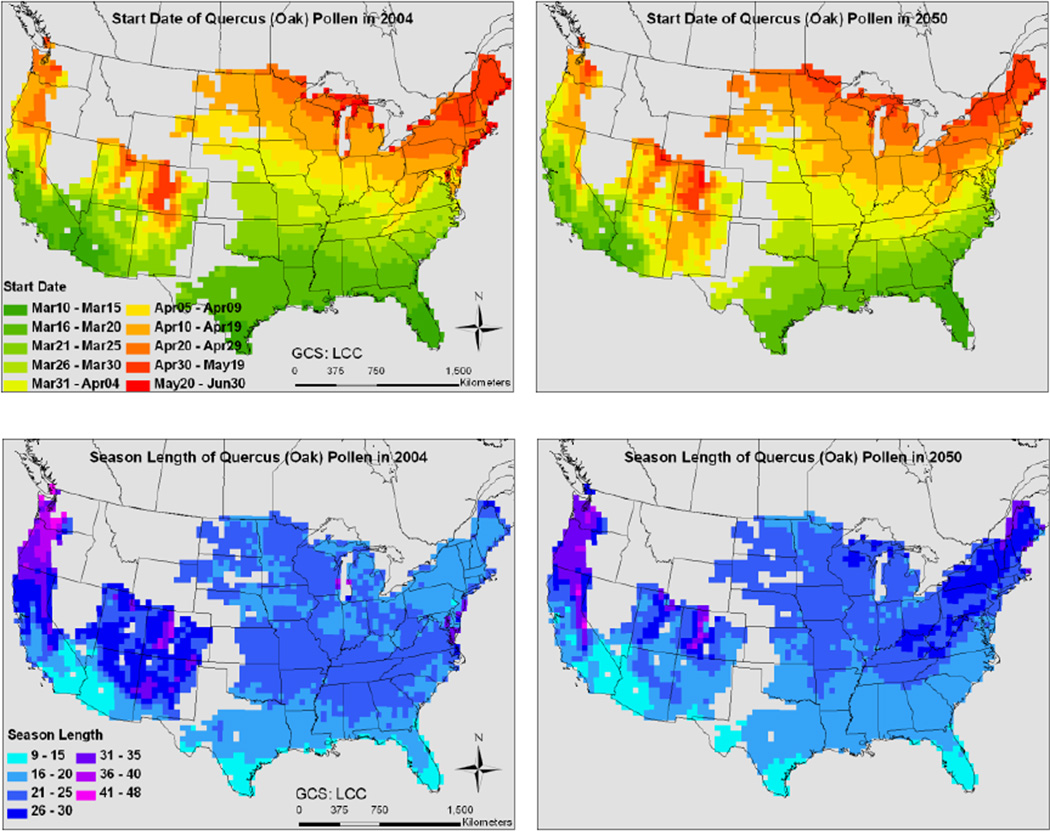
As depicted in Figure 7, oak pollen season also behaves differently in response to climate changes in different regions. In the Northwestern US (e.g., Oregon), the oak pollen season of 2050 is expected to start earlier than that of 2004; while in Central and Southern US (e.g., Tennessee and Texas), it is expected to start later. In the Northeastern US (e.g., Maine), the oak pollen season of 2050 is expected to be longer; while in the Southern US (e.g., Georgia and Alabama), it is expected to be shorter.
Figure 7.
Start date (Top panel) and season length (Bottom panel) of oak pollen in 2004 and 2050. Data are mapped only on cells in which the area coverage of oak trees is greater than zero.
Discussion
Although few observations and estimates were reported regarding season start and length of birch and oak pollen in the US, earlier start dates and rising pollen concentrations have been widely reported in many European countries such as Switzerland, Finland, Denmark, Germany, Spain and Turkey (Garcia-Mozo et al. 2006; Frei 1998; Frei and Gassner 2008; Erkan 2010; Yli-Panula et al. 2009; Rasmussen 2002; Estrella et al. 2006). For most of the stations considered in the present work, the trend analysis results are consistent with the findings from European countries.
The GDH models parameterized using observed start and end dates and hourly temperatures at multiple stations, can provide spatially resolved pollen season start date and length, which are crucial for generating spatiotemporal profiles of pollen emissions. RMSs of start dates for birch pollen in the current study are smaller or comparable with those reported by Rasmussen (2002). RMSs of start dates for oak pollen in Table 3 are also comparable with those reported by-Mozo et al. (2002), in which a modified Growing Degree Days (GDD) model was used to simulate the start date of oak pollen in Spain.
Research indicates that accumulation of chilling time, masting behaviors, and meteorology factors such as precipitation and humidity also play important roles in determining start dates, season lengths and ambient levels of birch and oak pollen (Jato et al. 2007; Masaka and Maguchi 2001; Kasprzyk 2009). Kasprzyk (2009) has discussed the effectiveness of modeling start date of oak pollen season through GDD, meteorological regressions, bioclimatic factors and indicator taxon. It was found that although there are low correlation coefficients between observed and modeled values, GDD model was shown to be highly effective for test years in some cases, and models based on bioclimatic indices and meteorological variables were not satisfactory (Kasprzyk 2009). The accumulation of chilling time, masting behavior, and other impacting meteorology factors, such as humidity and precipitation should be taken into consideration to further improve the accuracy of the modeled start dates and season lengths of birch and oak pollen.
The different response behaviors of birch and oak pollen seasons, especially the start dates and season lengths, may be due to substantial regional variations of climate change. The Intergovernmental Panel on Climate Change (IPCC) has reported that observed and projected climatic changes are not uniform with land-surface warming expected to be enhanced in regions with high latitudes and altitudes (IPCC 2007a, 2007b; Hansen et al. 2006). Earlier start dates and longer pollen seasons of birch and oak in Northeastern US are most probably related to the enhanced regional warming projected by IPCC (2007c).
Conclusions
Observed airborne pollen data for six stations at locations representing a wide range of geographic and climatic conditions across CONUS, were analyzed statistically to identify the trends of start date, season length, annual mean and peak value of daily concentrations of birch and oak pollen. For most of the studied stations, birch and oak pollen seasons in 2001–2011were found to start earlier than those in 1994–2000 with rising trends of annual mean and peak values. The trends for observed pollen season lengths appeared to be different for birch and oak across different stations.
The optimum GDH models were first parameterized using observed pollen and meteorology data, and then combined with BELD3.1 and WRF to simulate spatially resolved start dates and season lengths covering the CONUS. Simulation results showed varied responses to climate change of birch and oak pollen seasons in different regions.
Acknowledgment
This research was funded in part by USEPA under STAR Grant EPA-RD-83454701-0 (PI: L. Bielory, MD) to Rutgers University and UMDNJ, and by the NIEHS sponsored UMDNJ Center for Environmental Exposures and Disease at EOHSI (P30ES005022). We also wish to thank Dr. Ruby Leung (PNNL), Dr Alan Robock (Rutgers), and NARCCAP for providing the meteorology data, AAAAI for providing airborne pollen data, and Ms. Linda Everett and Zhongyuan Mi (EOHSI) for editorial assistance.
References
- Adhikari A, Reponen T, Grinshpun SA, Martuzevicius D, LeMasters G. Correlation of ambient inhalable bioaerosols with particulate matter and ozone: A two-year study. Environmental Pollution. 2006;140(1):16–28. doi: 10.1016/j.envpol.2005.07.004. [DOI] [PubMed] [Google Scholar]
- Baechler CM, Williamson J, Gilbride T, Cole P, Heft M, Love MP. Building Americal Best Practice. Vol. 7.1. USA: U.S. Department of Energy; 2010. Guide to Determining Climate Regions by County. [Google Scholar]
- Bielory L, Lyons K, Goldberg R. Climate Change and Allergic Disease. Current Allergy and Asthma Reports. 2012;12(6):485–494. doi: 10.1007/s11882-012-0314-z. [DOI] [PubMed] [Google Scholar]
- Damialis A, Halley JM, Gioulekas D, Vokou D. Long-term trends in atmospheric pollen levels in the city of Thessaloniki, Greece. Atmospheric Environment. 2007;41(33):7011–7021. [Google Scholar]
- Deser C, Knutti R, Solomon S, Phillips AS. Communication of the role of natural variability in future North American climate. Nature Clim Change. 2012;2(11):775–779. [Google Scholar]
- Efstathiou C, Isukapalli S, Georgopoulos P. A mechanistic modeling system for estimating large scale emissions and transport of pollen and co-allergens. Atmospheric environment (Oxford, England: 1994) 2011;45(13):2260–2276. doi: 10.1016/j.atmosenv.2010.12.008. [DOI] [PMC free article] [PubMed] [Google Scholar]
- Emberlin JE, Detandt MD, Gehrig RG, Jaeger SJ, Nolard NN, Rantio-Lehtimäki AR-L. Responses in the start of Betula (birch) pollen seasons to recent changes in spring temperatures across Europe. International Journal of Biometeorology. 2002;46(4):159–170. doi: 10.1007/s00484-002-0139-x. [DOI] [PubMed] [Google Scholar]
- Erkan PaBai Adem, Aybeke Mehmet. Analysis of airborne pollen fall in Tekirdag, Turkey. Asthma Allergy Immunology. 2010;8:46–54. [Google Scholar]
- Estrella N, Menzel A, Krämer U, Behrendt H. Integration 289 of flowering dates in phenology and pollen counts in aerobiology: analysis of their spatial and temporal coherence in Germany (1992-1999) International Journal of Biometeorology. 2006;51(1):49–59. doi: 10.1007/s00484-006-0038-7. [DOI] [PubMed] [Google Scholar]
- Fitter AH, Fitter RSR. Rapid Changes in Flowering Time in British Plants. Science. 2002;296(5573):1689–1691. doi: 10.1126/science.1071617. [DOI] [PubMed] [Google Scholar]
- Frei T. The effects of climate change in Switzerland 1969-1996 on airborne pollen quantities from hazel, birch and grass. Grana. 1998;37(3):172–179. [Google Scholar]
- Frei T, Gassner E. Climate change and its impact on birch pollen quantities and the start of the pollen season an example from Switzerland for the period 1969-2006. International Journal of Biometeorology. 2008;52(7):667–674. doi: 10.1007/s00484-008-0159-2. [DOI] [PubMed] [Google Scholar]
- Fernández D, Gutierrez AM, Rodriguez FJ, Trigo MM, Dominguez-Vilches E. Modelling start of oak pollen season in different climatic zones in Spain. Agricultural and Forest Meteorology. 2002;110(4):247–257. [Google Scholar]
- Garcia-Mozo H, Galan C, Jato V, Belmonte J, de la Guardia C, Fernandez D, Gutierrez M, Aira M, Roure J, Ruiz L, Trigo M, Dominguez-Vilches E. Quercus pollen season dynamics in the Iberian peninsula: response to meteorological parameters and possible consequences of climate change. Ann Agric Environ Med. 2006;13(2):209–224. [PubMed] [Google Scholar]
- Hansen J, Sato M, Ruedy R, Lo K, Lea DW, Medina-Elizade M. Global temperature change. Proc Natl Acad Sci U S A. 2006;103(39):14288–14293. doi: 10.1073/pnas.0606291103. [DOI] [PMC free article] [PubMed] [Google Scholar]
- Helbig N, Vogel B, Vogel H, Fiedler F. Numerical modelling of pollen dispersion on the regional scale. Aerobiologia. 2004;20(1):3–19. [Google Scholar]
- Hernández-Ceballos MA, García-Mozo H, Adame JA, Domínguez-Vilches E, Bolívar JP, la Morena BA, Pérez-Badía R, Galán C. Determination of potential sources of Quercus airborne pollen in Córdoba city (southern Spain) using back-trajectory analysis. Aerobiologia. 2011;27(3):261–276. [Google Scholar]
- IPCC. IPCC Climate Change 2007,The Physical Science Basis. Cambridge, United Kingdom and New York, NY, USA: 2007a. Summary for Policymakers. [Google Scholar]
- IPCC. IPCC Climate Change 2007,The Physical Science Basis. Cambridge, United Kingdom and New York, NY, USA: 2007b. Chapter 2 Changes in Atmospheric Constituents and in Radiative Forcing. [Google Scholar]
- IPCC. IPCC Climate Change 2007,The Physical Science Basis. Cambridge, United Kingdom and New York, NY, USA: 2007c. Chapter 10 Global Climate Projections. [Google Scholar]
- Jato V, Rodriguez-Rajo FJ, Aira MJ. Use of phenological and pollen-production data for interpreting atmospheric birch pollen curves. Ann Agric Environ Med. 2007;14(2):271–280. [PubMed] [Google Scholar]
- Kasprzyk I. Forecasting the start of Quercus pollen season using several methods – the evaluation of their efficiency. International Journal of Biometeorology. 2009;53(4):345–353. doi: 10.1007/s00484-009-0221-8. [DOI] [PubMed] [Google Scholar]
- Kinnee E, Geron C, Pierce T. United states land use inventory for estimating biogenic ozone precursor emissions. Ecological Applications. 1997;7(1):46–58. [Google Scholar]
- Lamb CE, Ratner PH, Johnson CE, Ambegaonkar AJ, Joshi AV, Day D, Sampson N, Eng B. Economic impact of workplace productivity losses due to allergic rhinitis compared with select medical conditions in the United States from an employer perspective. Current medical research and opinion. 2006;22(6):1203–1210. doi: 10.1185/030079906X112552. [DOI] [PubMed] [Google Scholar]
- Leung LR, Qian Y. Atmospheric rivers induced heavy 334 precipitation and flooding in the western U.S. simulated by the WRF regional climate model. Geophys Res Lett. 2009;36(3):L03820. [Google Scholar]
- Masaka K, Maguchi S. Modelling the Masting Behaviour of Betula platyphylla var. japonica using the Resource Budget Model. Annals of Botany. 2001;88(6):1049–1055. [Google Scholar]
- Mearns LO, Gutowski W, Jones R, Leung R, McGinnis S, Nunes A, Qian Y. A Regional Climate Change Assessment Program for North America. Eos Trans AGU. 2009;90(36) [Google Scholar]
- Nakicenvoic N, Davidson O, Davis G, Grübler A, Kram T, Rovere E, Metz M, Morita T, Pepper W, Pitcher H, Sankovski A, Shukla P, Swart R, Watson R, Dadi Z. Special report on emissions scenarios: A special report of working group iii of the intergovernmental panel on climate change. Cambridge, UK: IPCC; 2000. [Google Scholar]
- Pauling A, Rotach M, Gehrig R, Clot B, Network CttEA. A method to derive vegetation distribution maps for pollen dispersion models using birch as an example. International Journal of Biometeorology. 2012;56(5):949–958. doi: 10.1007/s00484-011-0505-7. [DOI] [PubMed] [Google Scholar]
- Rasmussen A. The effects of climate change on the birch pollen season in Denmark. Aerobiologia. 2002;18(3):253–265. [Google Scholar]
- Shea KM, Truckner RT, Weber RW, Peden DB. Climate change and allergic disease. Journal of Allergy and Clinical Immunology. 2008;122(3):443–453. doi: 10.1016/j.jaci.2008.06.032. doi: http://dx.doi.org/10.1016/j.jaci.2008.06.032. [DOI] [PubMed] [Google Scholar]
- Siljamo P, Sofiev M, Filatova E, Grewling L, Jager S, Khoreva E, Linkosalo T, Jimenez SO, Ranta H, Rantio-Lehtimaki A, Svetlov A, Veriankaite L, Yakovleva E, Kukkonen J. A numerical model of birch pollen emission and dispersion in the atmosphere. Model evaluation and sensitivity analysis. International Journal 358 of Biometeorology. 2013;57(1):125–136. doi: 10.1007/s00484-012-0539-5. [DOI] [PMC free article] [PubMed] [Google Scholar]
- Siljamo P, Sofiev M, Severova E, Ranta H, Kukkonen J, Polevova S, Kubin E, Minin A. Sources, impact and exchange of early-spring birch pollen in the Moscow region and Finland. Aerobiologia. 2008;24(4):211–230. [Google Scholar]
- Silvertown JW. The evolutionary ecology of mast seeding in trees. Biological Journal of the Linnean Society. 1980;14(2):235–250. [Google Scholar]
- Singh K, Axelrod S, Bielory L. The epidemiology of ocular and nasal allergy in the United States, 1988-1994. Journal of Allergy and Clinical Immunology. 2010;126(4) doi: 10.1016/j.jaci.2010.06.050. 778-783.e776. [DOI] [PubMed] [Google Scholar]
- Sofiev M, Siljamo P, Ranta H, Linkosalo T, Jaeger S, Rasmussen A, Rantio-Lehtimaki A, Severova E, Kukkonen J. A numerical model of birch pollen emission and dispersion in the atmosphere. Description of the emission module. International Journal of Biometeorology. 2013;57(1):45–58. doi: 10.1007/s00484-012-0532-z. [DOI] [PMC free article] [PubMed] [Google Scholar]
- Sofiev M, Siljamo P, Ranta H, Rantio-Lehtimäki A. Towards numerical forecasting of long-range air transport of birch pollen: theoretical considerations and a feasibility study. International Journal of Biometeorology. 2006;50(6):392–402. doi: 10.1007/s00484-006-0027-x. [DOI] [PubMed] [Google Scholar]
- Vogel H, Pauling A, Vogel B. Numerical simulation of birch pollen dispersion with an operational weather forecast system. International Journal of Biometeorology. 2008;52(8):805–814. doi: 10.1007/s00484-008-0174-3. [DOI] [PubMed] [Google Scholar]
- Yli-Panula E, Fekedulegn DB, Green BJ, Ranta H. Analysis of airborne betula pollen in Finland; a 31-year perspective. International journal of environmental research and public health. 2009;6(6):1706–1723. doi: 10.3390/ijerph6061706. [DOI] [PMC free article] [PubMed] [Google Scholar]
- Zhang Y, Isukapalli SS, Bielory L, Georgopoulos PG. Bayesian analysis 381 of climate change effects on observed and projected airborne levels of birch pollen. Atmospheric Environment. 2013;68(0):64–73. doi: 10.1016/j.atmosenv.2012.11.028. doi: http://dx.doi.org/10.1016/j.atmosenv.2012.11.028. [DOI] [PMC free article] [PubMed] [Google Scholar]
- Ziska LH, Gebhard DE, Frenz DA, Faulkner S, Singer BD, Straka JG. Cities as harbingers of climate change: Common ragweed, urbanization, and public health. Journal of Allergy and Clinical Immunology. 2003;111(2):290–295. doi: 10.1067/mai.2003.53. [DOI] [PubMed] [Google Scholar]


